NZDUSD H4 | Bearish dropKiwi (NZD/USD) is rising towards the sell entry, which is a pullback resistance and could reverse from this level and drop lower.
Sell entry is at 0.5978, which is a pullback resistance.
Stop loss is at 0.6002, which is a pullback resistance that lines up with the 50% Fibonacci retracement.
Take profit is at 0.5942, which is a multi-swing low support.
High Risk Investment Warning
Trading Forex/CFDs on margin carries a high level of risk and may not be suitable for all investors. Leverage can work against you.
Stratos Markets Limited (tradu.com ):
CFDs are complex instruments and come with a high risk of losing money rapidly due to leverage. 65% of retail investor accounts lose money when trading CFDs with this provider. You should consider whether you understand how CFDs work and whether you can afford to take the high risk of losing your money.
Stratos Europe Ltd (tradu.com ):
CFDs are complex instruments and come with a high risk of losing money rapidly due to leverage. 66% of retail investor accounts lose money when trading CFDs with this provider. You should consider whether you understand how CFDs work and whether you can afford to take the high risk of losing your money.
Stratos Global LLC (tradu.com ):
Losses can exceed deposits.
Please be advised that the information presented on TradingView is provided to Tradu (‘Company’, ‘we’) by a third-party provider (‘TFA Global Pte Ltd’). Please be reminded that you are solely responsible for the trading decisions on your account. There is a very high degree of risk involved in trading. Any information and/or content is intended entirely for research, educational and informational purposes only and does not constitute investment or consultation advice or investment strategy. The information is not tailored to the investment needs of any specific person and therefore does not involve a consideration of any of the investment objectives, financial situation or needs of any viewer that may receive it. Kindly also note that past performance is not a reliable indicator of future results. Actual results may differ materially from those anticipated in forward-looking or past performance statements. We assume no liability as to the accuracy or completeness of any of the information and/or content provided herein and the Company cannot be held responsible for any omission, mistake nor for any loss or damage including without limitation to any loss of profit which may arise from reliance on any information supplied by TFA Global Pte Ltd.
The speaker(s) is neither an employee, agent nor representative of Tradu and is therefore acting independently. The opinions given are their own, constitute general market commentary, and do not constitute the opinion or advice of Tradu or any form of personal or investment advice. Tradu neither endorses nor guarantees offerings of third-party speakers, nor is Tradu responsible for the content, veracity or opinions of third-party speakers, presenters or participants.
Forex market

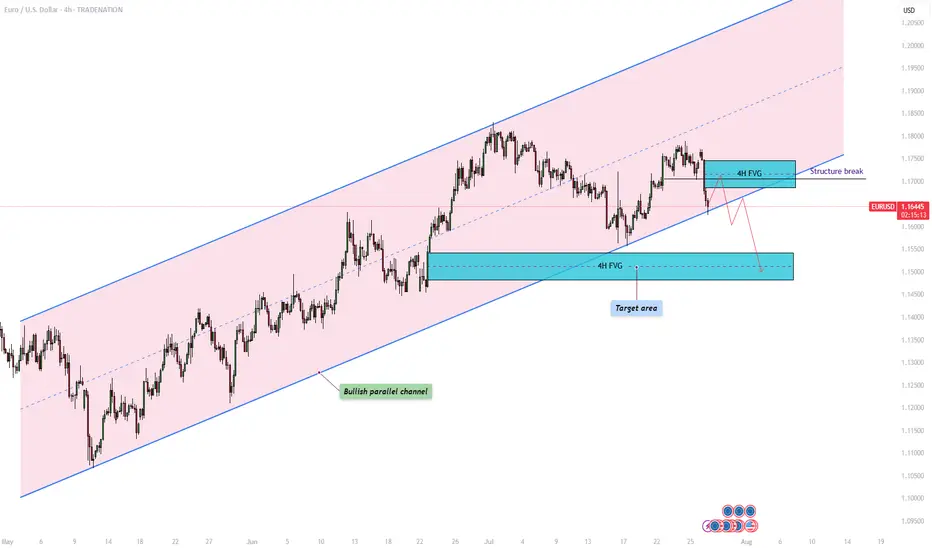
EURUSD – Will the bullish parallel channel hold?The EUR/USD currency pair is currently trading within a clearly defined bullish parallel channel, as shown on the 4-hour chart. This channel has provided consistent directional structure over recent weeks, with price respecting both its upper resistance and lower support boundaries. At present, the pair is approaching the lower end of this channel, raising the critical question: will it bounce off support and continue the bullish trajectory, or will it decisively break down, opening the door to lower price targets?
Bullish parallel channel
On the 4-hour timeframe, the EUR/USD has been consistently moving within a bullish parallel channel, characterized by higher highs and higher lows. This price structure suggests sustained upward momentum, with the top of the channel acting as dynamic resistance and the bottom as reliable support. Today, price action is testing the lower boundary of the channel once again. A successful hold at this level could confirm continued bullish structure and open the door for a potential rebound.
Bullish scenario
In the bullish scenario, the EUR/USD holds its ground at the support region around 1.164, where the lower boundary of the channel intersects with price. For upward continuation, it must overcome the short-term resistance posed by the 4-hour Fair Value Gap (FVG) between 1.169 and 1.174. A reclaim and close above this zone could signal a shift in short-term momentum and lead to a move back toward the upper boundary of the channel. However, the path upward is not without resistance , price must navigate through potential supply zones and maintain higher lows to preserve the bullish structure.
Bearish scenario
On the other hand, a break and close below the channel support could indicate a change in market sentiment and invalidate the bullish pattern. In this bearish case, we would expect a structure break confirmation followed by a possible retest of the broken trendline and the 4-hour FVG. If this retest fails to reclaim the trendline, bearish continuation becomes more likely. The next significant area of interest lies around the 1.150 level, where a bullish 4-hour FVG exists. This zone could act as a potential short-term support and serve as a target for the downside move before any meaningful bounce occurs.
Final thoughts
The EUR/USD pair is currently at a technical crossroads. Traders should watch closely for price behavior around the lower channel boundary to determine whether bullish momentum will resume or whether a bearish breakout will set the tone for deeper retracement. Confirmation, either through a bounce or a breakdown with a retest, will be key in validating the next directional move.
-------------------------
Disclosure: I am part of Trade Nation's Influencer program and receive a monthly fee for using their TradingView charts in my analysis.
Thanks for your support. If you enjoyed this analysis, make sure to follow me so you don't miss the next one. And if you found it helpful, feel free to drop a like 👍 and leave a comment 💬, I’d love to hear your thoughts!
AUDUSD H4| Bearish reversal off 38.2% Fibonacci resistanceAussie (AUD/USD) is rising towards the sell entry, which is a pullback resistance that lines up with the 38.2% Fibonacci retracement and could reverse to the take profit.
Buy entry is at 0.6541, which is a pullback resistance that lines up with the 38.2% Fibonacci retracement.
Stop loss is at 0.6580, which is a pullback resistance that aligns with the 61.8% Fibonacci retracement.
Take profit is at 0.6467, which is a swing low support.
High Risk Investment Warning
Trading Forex/CFDs on margin carries a high level of risk and may not be suitable for all investors. Leverage can work against you.
Stratos Markets Limited (tradu.com ):
CFDs are complex instruments and come with a high risk of losing money rapidly due to leverage. 65% of retail investor accounts lose money when trading CFDs with this provider. You should consider whether you understand how CFDs work and whether you can afford to take the high risk of losing your money.
Stratos Europe Ltd (tradu.com ):
CFDs are complex instruments and come with a high risk of losing money rapidly due to leverage. 66% of retail investor accounts lose money when trading CFDs with this provider. You should consider whether you understand how CFDs work and whether you can afford to take the high risk of losing your money.
Stratos Global LLC (tradu.com ):
Losses can exceed deposits.
Please be advised that the information presented on TradingView is provided to Tradu (‘Company’, ‘we’) by a third-party provider (‘TFA Global Pte Ltd’). Please be reminded that you are solely responsible for the trading decisions on your account. There is a very high degree of risk involved in trading. Any information and/or content is intended entirely for research, educational and informational purposes only and does not constitute investment or consultation advice or investment strategy. The information is not tailored to the investment needs of any specific person and therefore does not involve a consideration of any of the investment objectives, financial situation or needs of any viewer that may receive it. Kindly also note that past performance is not a reliable indicator of future results. Actual results may differ materially from those anticipated in forward-looking or past performance statements. We assume no liability as to the accuracy or completeness of any of the information and/or content provided herein and the Company cannot be held responsible for any omission, mistake nor for any loss or damage including without limitation to any loss of profit which may arise from reliance on any information supplied by TFA Global Pte Ltd.
The speaker(s) is neither an employee, agent nor representative of Tradu and is therefore acting independently. The opinions given are their own, constitute general market commentary, and do not constitute the opinion or advice of Tradu or any form of personal or investment advice. Tradu neither endorses nor guarantees offerings of third-party speakers, nor is Tradu responsible for the content, veracity or opinions of third-party speakers, presenters or participants.

USDJPY | H4 Bullish bounce offBased on the H4 chart analysis, the price is falling towards the buy entry, which is an overlap support that aligns with the 61.8% Fibonacci retracement and could bounce from this level and rise higher.
Buy entry is at 147.08, which is an overlap support that lines up with the 61.8% Fibonacci retracement.
Stop loss is at 145.82, which is a multi-swing low support.
Take profit is at 148.72, which is pullback resistance.
High Risk Investment Warning
Trading Forex/CFDs on margin carries a high level of risk and may not be suitable for all investors. Leverage can work against you.
Stratos Markets Limited (tradu.com ):
CFDs are complex instruments and come with a high risk of losing money rapidly due to leverage. 65% of retail investor accounts lose money when trading CFDs with this provider. You should consider whether you understand how CFDs work and whether you can afford to take the high risk of losing your money.
Stratos Europe Ltd (tradu.com):
CFDs are complex instruments and come with a high risk of losing money rapidly due to leverage. 66% of retail investor accounts lose money when trading CFDs with this provider. You should consider whether you understand how CFDs work and whether you can afford to take the high risk of losing your money.
Stratos Global LLC (tradu.com ):
Losses can exceed deposits.
Please be advised that the information presented on TradingView is provided to Tradu (‘Company’, ‘we’) by a third-party provider (‘TFA Global Pte Ltd’). Please be reminded that you are solely responsible for the trading decisions on your account. There is a very high degree of risk involved in trading. Any information and/or content is intended entirely for research, educational and informational purposes only and does not constitute investment or consultation advice or investment strategy. The information is not tailored to the investment needs of any specific person and therefore does not involve a consideration of any of the investment objectives, financial situation or needs of any viewer that may receive it. Kindly also note that past performance is not a reliable indicator of future results. Actual results may differ materially from those anticipated in forward-looking or past performance statements. We assume no liability as to the accuracy or completeness of any of the information and/or content provided herein and the Company cannot be held responsible for any omission, mistake nor for any loss or damage including without limitation to any loss of profit which may arise from reliance on any information supplied by TFA Global Pte Ltd.
The speaker(s) is neither an employee, agent nor representative of Tradu and is therefore acting independently. The opinions given are their own, constitute general market commentary, and do not constitute the opinion or advice of Tradu or any form of personal or investment advice. Tradu neither endorses nor guarantees offerings of third-party speakers, nor is Tradu responsible for the content, veracity or opinions of third-party speakers, presenters or participants.

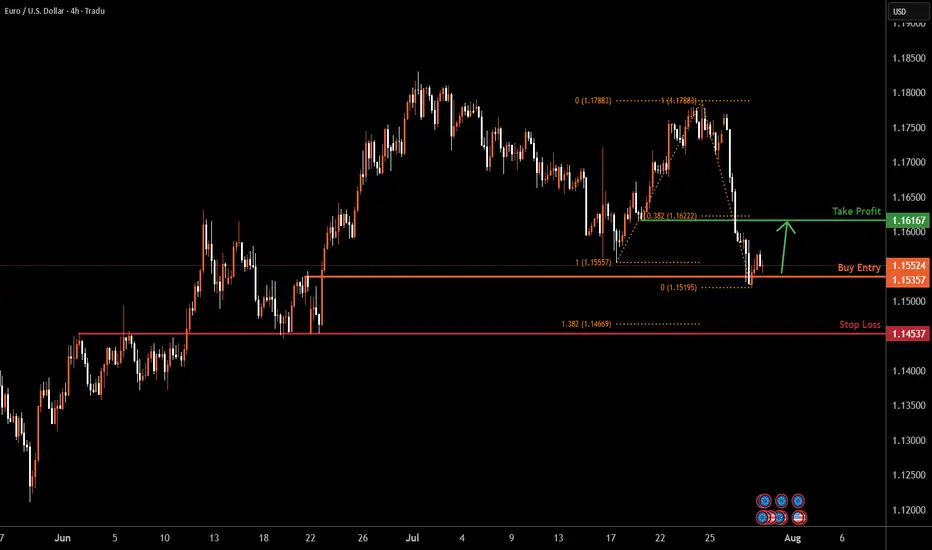
EURUSD | H4 Bullish bounce offBased on the H4 chart analysis, the price is reacting off the support level, which is a pullback support, and could rise higher.
Buy entry is at 1.1535, which is a pullback support.
Stop loss is at 1.1453, which is an overlap support that is underneath the 138.2% Fibonacci extension.
Take profit is at 1.1616, which is a pullback resistance that aligns with the 38.2% Fibonacci retracement.
High Risk Investment Warning
Trading Forex/CFDs on margin carries a high level of risk and may not be suitable for all investors. Leverage can work against you.
Stratos Markets Limited (tradu.com ):
CFDs are complex instruments and come with a high risk of losing money rapidly due to leverage. 65% of retail investor accounts lose money when trading CFDs with this provider. You should consider whether you understand how CFDs work and whether you can afford to take the high risk of losing your money.
Stratos Europe Ltd (tradu.com ):
CFDs are complex instruments and come with a high risk of losing money rapidly due to leverage. 66% of retail investor accounts lose money when trading CFDs with this provider. You should consider whether you understand how CFDs work and whether you can afford to take the high risk of losing your money.
Stratos Global LLC (tradu.com ):
Losses can exceed deposits.
Please be advised that the information presented on TradingView is provided to Tradu (‘Company’, ‘we’) by a third-party provider (‘TFA Global Pte Ltd’). Please be reminded that you are solely responsible for the trading decisions on your account. There is a very high degree of risk involved in trading. Any information and/or content is intended entirely for research, educational and informational purposes only and does not constitute investment or consultation advice or investment strategy. The information is not tailored to the investment needs of any specific person and therefore does not involve a consideration of any of the investment objectives, financial situation or needs of any viewer that may receive it. Kindly also note that past performance is not a reliable indicator of future results. Actual results may differ materially from those anticipated in forward-looking or past performance statements. We assume no liability as to the accuracy or completeness of any of the information and/or content provided herein and the Company cannot be held responsible for any omission, mistake nor for any loss or damage including without limitation to any loss of profit which may arise from reliance on any information supplied by TFA Global Pte Ltd.
The speaker(s) is neither an employee, agent nor representative of Tradu and is therefore acting independently. The opinions given are their own, constitute general market commentary, and do not constitute the opinion or advice of Tradu or any form of personal or investment advice. Tradu neither endorses nor guarantees offerings of third-party speakers, nor is Tradu responsible for the content, veracity or opinions of third-party speakers, presenters or participants.
EURUSD has formed a double top patternOn the daily chart, EURUSD has formed a double top pattern. Currently, attention should be paid to the resistance around 1.1600. If the rebound does not break through, it is expected to continue to fall. The support below is around 1.1450. If it falls below, the support below is around 1.1370.

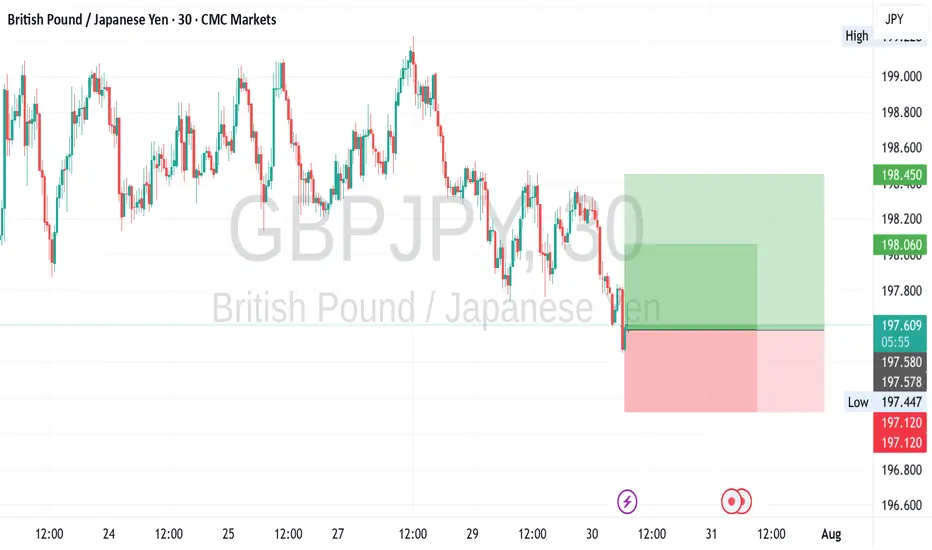
GBPJPY recent global risk appetite significantly increasedThrough the dynamic monitoring of market sentiment and capital flows found that the recent global risk appetite significantly increased, the structure of funds tilted to risky assets, the currency benefited from this trend to show upward momentum.
Public opinion analysis shows that the market is generally concerned about the positive impact of economic recovery and policy support, and media reports and analysts' views tend to be optimistic, which strengthens the bullish market atmosphere.
Money flow data supports the active inflow of funds into the currency, showing a combination of institutional and retail buying, pushing the price to stabilize and rebound.
It is recommended that investors combine the dynamic, reasonably adjust the position, low absorption, and actively participate in the market rebound.
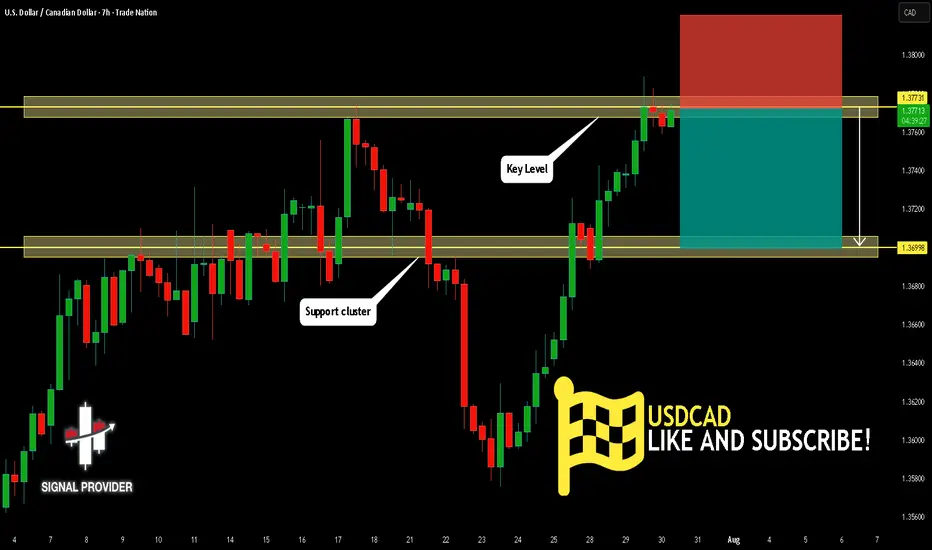
USDCAD Is Bearish! Sell!
Please, check our technical outlook for USDCAD.
Time Frame: 7h
Current Trend: Bearish
Sentiment: Overbought (based on 7-period RSI)
Forecast: Bearish
The market is trading around a solid horizontal structure 1.377.
The above observations make me that the market will inevitably achieve 1.369 level.
P.S
We determine oversold/overbought condition with RSI indicator.
When it drops below 30 - the market is considered to be oversold.
When it bounces above 70 - the market is considered to be overbought.
Disclosure: I am part of Trade Nation's Influencer program and receive a monthly fee for using their TradingView charts in my analysis.
Like and subscribe and comment my ideas if you enjoy them!
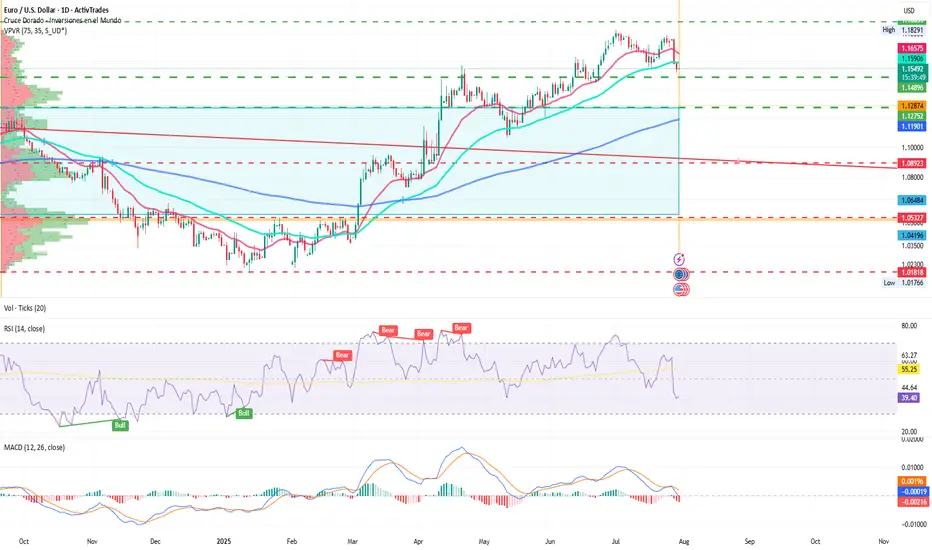
EUR/USD: ECB Pauses Amid UncertaintyBy Ion Jauregui – Analyst at ActivTrades
The European Central Bank has decided to pause its rate-cutting cycle after seven consecutive reductions over the past twelve months, leaving the deposit rate at 2%, the refinancing rate at 2.15%, and the marginal lending facility at 2.4%. This move, largely priced in by the markets, reflects the ECB’s growing caution in the face of inflation that has officially reached its 2% target but may rebound if certain fiscal and geopolitical risks materialize.
Christine Lagarde’s message has been interpreted with a hawkish tone. Although both headline and core inflation have eased — the latter standing at 2.3% — the ECB warns that surprises may still occur. Massive defense spending, fiscal imbalances, and international trade tensions (such as tariffs recently signed by Trump with Japan) could disrupt the current equilibrium.
Markets have reacted calmly: the EUR/USD barely moved a tenth of a percent after the decision, while implied interest rates in the money markets have lowered the odds of another rate cut in September. Now, only a symbolic 5 basis point cut is priced in at most.
Technical Analysis
Overall trend: Sideways to bearish in the short term; bullish in the long term.
Key support levels:
1.1488: technical and psychological reference level
1.1275: recent July low
Key resistance levels:
1.8291: short-term high
1.2278: next resistance level
The pair attempted to break higher last week but failed, starting this week with a bearish tone. As long as the price holds above key support, the bullish trend may continue. A daily close below the first support could trigger a move toward the point of control (POC) zone at 1.0419. The daily RSI is in oversold territory at 38.95%, while the MACD shows signs of turning lower, indicating a loss of bullish momentum.
There is growing speculation that the ECB's rate-cutting cycle may be over. Within the ECB, figures like Isabel Schnabel are calling for patience, while others, such as Philip Lane and Luis de Guindos, still don’t rule out a final adjustment if September projections show economic weakness.
In this context, the price range that began from the point of control zone toward recent highs appears to be losing steam. Going forward, the evolution of the EUR/USD will depend on inflation trends, European fiscal policy, and the ECB’s response to tariff tensions with the United States and other global challenges as summer draws to a close.
*******************************************************************************************
The information provided does not constitute investment research. The material has not been prepared in accordance with the legal requirements designed to promote the independence of investment research and such should be considered a marketing communication.
All information has been prepared by ActivTrades ("AT"). The information does not contain a record of AT's prices, or an offer of or solicitation for a transaction in any financial instrument. No representation or warranty is given as to the accuracy or completeness of this information.
Any material provided does not have regard to the specific investment objective and financial situation of any person who may receive it. Past performance and forecasting are not a synonym of a reliable indicator of future performance. AT provides an execution-only service. Consequently, any person acting on the information provided does so at their own risk. Political risk is unpredictable. Central bank actions can vary. Platform tools do not guarantee success.
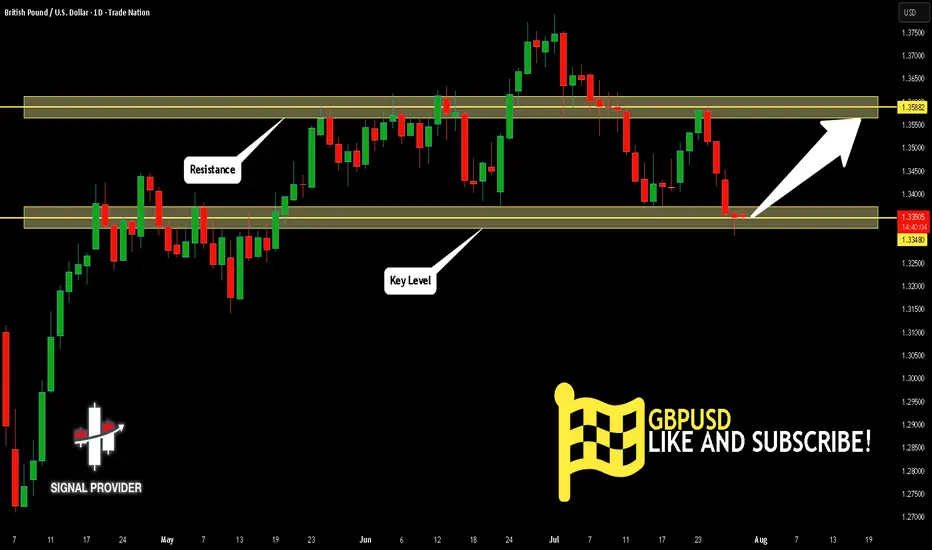
GBPUSD Is Very Bullish! Buy!
Here is our detailed technical review for GBPUSD.
Time Frame: 1D
Current Trend: Bullish
Sentiment: Oversold (based on 7-period RSI)
Forecast: Bullish
The market is testing a major horizontal structure 1.334.
Taking into consideration the structure & trend analysis, I believe that the market will reach 1.358 level soon.
P.S
Overbought describes a period of time where there has been a significant and consistent upward move in price over a period of time without much pullback.
Disclosure: I am part of Trade Nation's Influencer program and receive a monthly fee for using their TradingView charts in my analysis.
Like and subscribe and comment my ideas if you enjoy them!
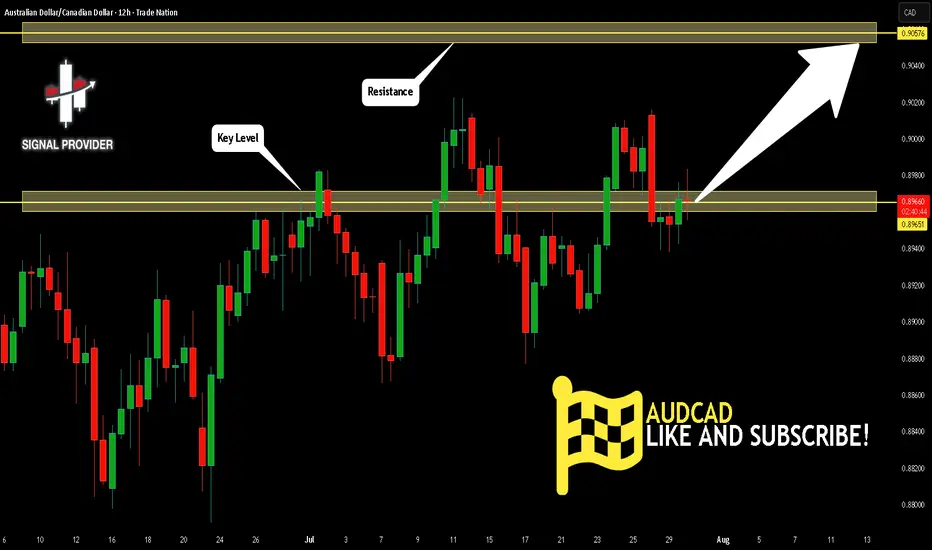
AUDCAD Is Going Up! Long!
Take a look at our analysis for AUDCAD.
Time Frame: 12h
Current Trend: Bullish
Sentiment: Oversold (based on 7-period RSI)
Forecast: Bullish
The market is approaching a key horizontal level 0.896.
Considering the today's price action, probabilities will be high to see a movement to 0.905.
P.S
Please, note that an oversold/overbought condition can last for a long time, and therefore being oversold/overbought doesn't mean a price rally will come soon, or at all.
Disclosure: I am part of Trade Nation's Influencer program and receive a monthly fee for using their TradingView charts in my analysis.
Like and subscribe and comment my ideas if you enjoy them!
USD/JPY) Bullish Trend Read The captionSMC Trading point update
Technical analysis of USD/JPY on the 4-hour timeframe, with a focus on a support-resistance structure and trend
---
Technical Breakdown:
1. Market Structure:
Price is moving in a clear uptrend, making higher highs and higher lows.
A recent pullback into a support zone suggests potential for a bullish continuation.
2. Key Zones:
Support Zone: Around 147.00–147.50, highlighted in yellow — the area where price recently bounced.
Resistance Zone: Around 148.800–149.300, which price is expected to break through.
Target Point: Clearly marked at 150.519, aligning with the prior high and a projected bullish extension.
3. EMA (200):
The 200 EMA (blue) is at 146.489, far below current price — signaling strong bullish momentum.
4. RSI (14):
RSI is at 61.14, showing bullish momentum without being overbought — supportive of further upside.
No divergence is noted, which supports trend continuation.
5. Projection (Drawn Path):
The chart suggests price may bounce from support, break through resistance, and rally toward 150.519, possibly after a retest of the resistance-turned-support.
Mr SMC Trading point
---
Trade Idea Summary:
Bias: Bullish
Entry Zone: Near 147.00–147.50 (support)
Confirmation: Bullish candlestick pattern or strong bounce
Target: 150.519
Invalidation: Break and close below 146.489 (200 EMA) or sustained move below support zone
---
Please support boost 🚀 this analysis)

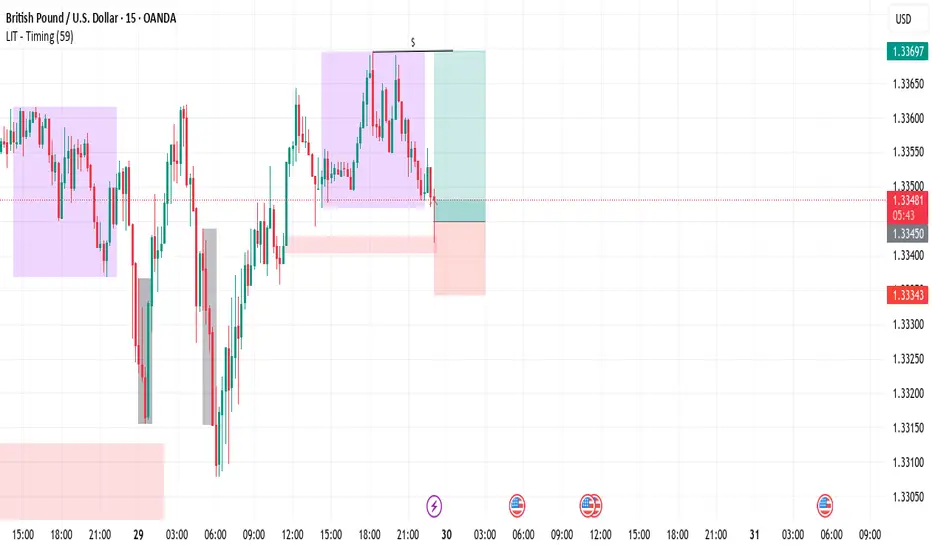
GBPUSD H4 | Bearish continuationThe Cable (GBP/USD) is rising toward a pullback resistance level and may reverse from this point, potentially dropping lower.
Buy entry is at 1.3391, located at a pullback resistance.
Stop loss is at 1.3460, also a pullback resistance, positioned slightly above the 50% Fibonacci retracement.
Take profit is at 1.3318, which is a pullback support level.
High Risk Investment Warning
Trading Forex/CFDs on margin carries a high level of risk and may not be suitable for all investors. Leverage can work against you.
Stratos Markets Limited (tradu.com ):
CFDs are complex instruments and come with a high risk of losing money rapidly due to leverage. 65% of retail investor accounts lose money when trading CFDs with this provider. You should consider whether you understand how CFDs work and whether you can afford to take the high risk of losing your money.
Stratos Europe Ltd (tradu.com ):
CFDs are complex instruments and come with a high risk of losing money rapidly due to leverage. 66% of retail investor accounts lose money when trading CFDs with this provider. You should consider whether you understand how CFDs work and whether you can afford to take the high risk of losing your money.
Stratos Global LLC (tradu.com ):
Losses can exceed deposits.
Please be advised that the information presented on TradingView is provided to Tradu (‘Company’, ‘we’) by a third-party provider (‘TFA Global Pte Ltd’). Please be reminded that you are solely responsible for the trading decisions on your account. There is a very high degree of risk involved in trading. Any information and/or content is intended entirely for research, educational and informational purposes only and does not constitute investment or consultation advice or investment strategy. The information is not tailored to the investment needs of any specific person and therefore does not involve a consideration of any of the investment objectives, financial situation or needs of any viewer that may receive it. Kindly also note that past performance is not a reliable indicator of future results. Actual results may differ materially from those anticipated in forward-looking or past performance statements. We assume no liability as to the accuracy or completeness of any of the information and/or content provided herein and the Company cannot be held responsible for any omission, mistake nor for any loss or damage including without limitation to any loss of profit which may arise from reliance on any information supplied by TFA Global Pte Ltd.
The speaker(s) is neither an employee, agent nor representative of Tradu and is therefore acting independently. The opinions given are their own, constitute general market commentary, and do not constitute the opinion or advice of Tradu or any form of personal or investment advice. Tradu neither endorses nor guarantees offerings of third-party speakers, nor is Tradu responsible for the content, veracity or opinions of third-party speakers, presenters or participants.

USDCHF sell Looks a good place to sell for a pullback down here finding resistance at this zone and forming structural i dictations for a sell off , I will e selling at 0.80.558 and looking for ta,e profits at 0.79157 that's a 1.75% drop down

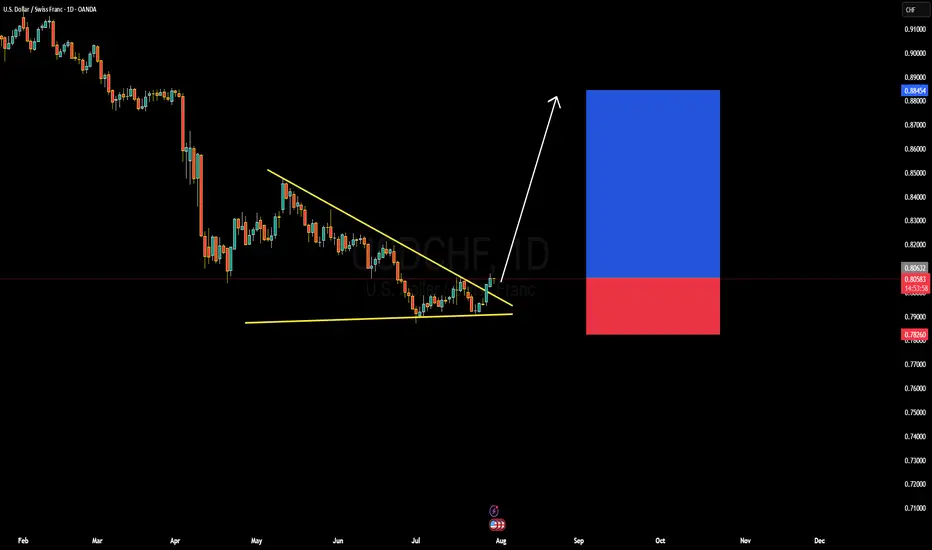
USDCHF Forming Falling WedgeUSDCHF has recently broken out of a falling wedge pattern on the daily timeframe, which is typically a bullish reversal signal. After an extended period of compression and lower highs, the pair has pierced above the descending trendline with strong bullish momentum. This breakout indicates a shift in sentiment, and we are now seeing early signs of a potential trend reversal to the upside. The structure suggests the market could target higher levels, with immediate resistance near the 0.8200–0.8300 zone and extended upside potential toward 0.8800.
From a macro perspective, the US dollar is gaining traction again, supported by firm US GDP growth and persistent inflation pressures, which keep the Federal Reserve in a cautious stance. Investors are now reassessing rate cut expectations, with Fed officials emphasizing data-dependency. On the other hand, the Swiss franc is seeing slight weakness as the Swiss National Bank remains dovish compared to other central banks. The widening monetary policy divergence favors dollar strength in the short to medium term.
Technically, the breakout above the wedge confirms buyer dominance, and with the RSI and MACD turning bullish, momentum favors continuation to the upside. The risk-to-reward remains attractive with a tight invalidation level below the recent lows around 0.7820. Price action traders may consider entering on minor pullbacks toward the breakout zone, with eyes on retesting the previous swing highs.
Overall, USDCHF presents a clean bullish setup following the breakout of a falling wedge pattern. With solid confluence from both technical and fundamental angles, this pair is poised for further gains in the coming sessions. Patience and confirmation remain key, but the structure supports a long bias for those aligned with momentum
Cad/chf sellI can see a stall in the cad dollar at this zone and is looking set for a pullback , I will be selling at 58,500 and looking for profits down at 57.876 a 0.74% profit 📈

GBPUSD SELLAfter seeing the previous daily candle close bearish and the 4hr had a retrace back into the moving averages we could expect price to see further sell off into support

30.07.25 Morning ForecastPairs on Watch -
FX:AUDUSD
FX:NZDUSD
FX:EURUSD
A short overview of the instruments I am looking at for today, multi-timeframe analysis down to what I will be looking at for an entry. Enjoy!

GBPUSD Forming Rising WedgeGBPUSD is currently showing a clear breakdown from a rising wedge pattern on the daily timeframe—a classic bearish signal. After a prolonged bullish channel, price has decisively broken below the lower trendline support, confirming a shift in momentum. The pair is now approaching a major demand zone around the 1.3100–1.3150 area, which previously acted as a strong support level. Based on price action structure, further downside movement is anticipated until price retests that zone for potential reaction.
From a fundamental perspective, the pound has come under pressure as UK economic data has started to show signs of softening. Slower retail sales, weakening PMI numbers, and sticky inflation are weighing on the British currency. Meanwhile, the US dollar remains firm, supported by a hawkish stance from the Federal Reserve and strong US GDP data. As markets continue to price in the possibility of another rate hike or a longer pause in rate cuts, dollar strength is expected to persist—adding bearish weight to GBPUSD.
Technically, the breakdown from the wedge pattern confirms a bearish reversal structure. The current bearish leg is aligned with increasing downside momentum, and if price sustains below 1.3360, the next key target sits around the 1.3200 zone. This area also aligns with previous consolidation and could serve as a temporary floor. However, a break below that zone may expose deeper targets toward 1.3050 in the medium term.
Overall, the bias for GBPUSD remains bearish unless there is a strong bullish reversal signal. For now, trend-following traders may look to sell the rallies, keeping an eye on key support levels for signs of exhaustion. The current setup offers a good risk-to-reward opportunity with confirmation from both technical breakdown and macroeconomic headwinds.

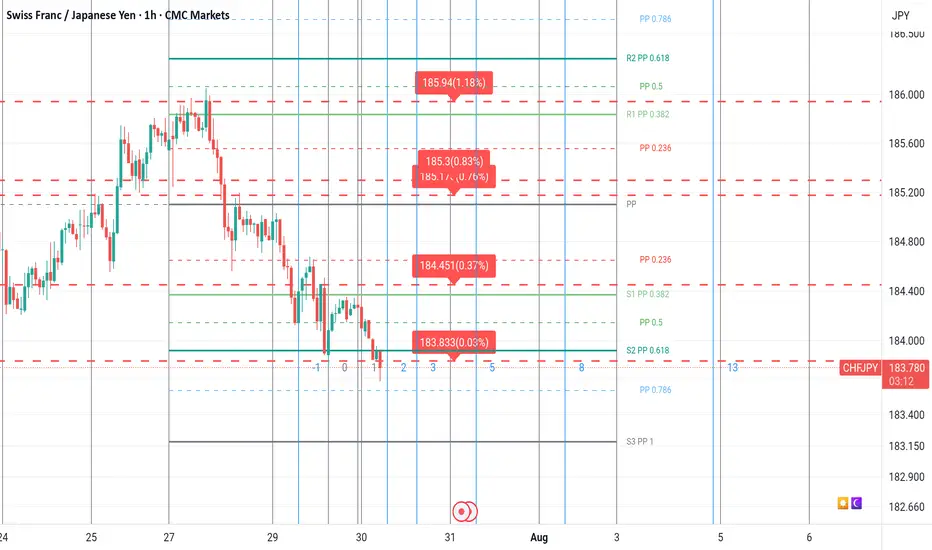
Chfjpy buy Looking to buy the Swiss franc at this point , has a large over sold indication and also should find support around here at this zone , I will be taking a buy here at 183.769 and looking to take profits at 185.94 zone thats 1.17% rise
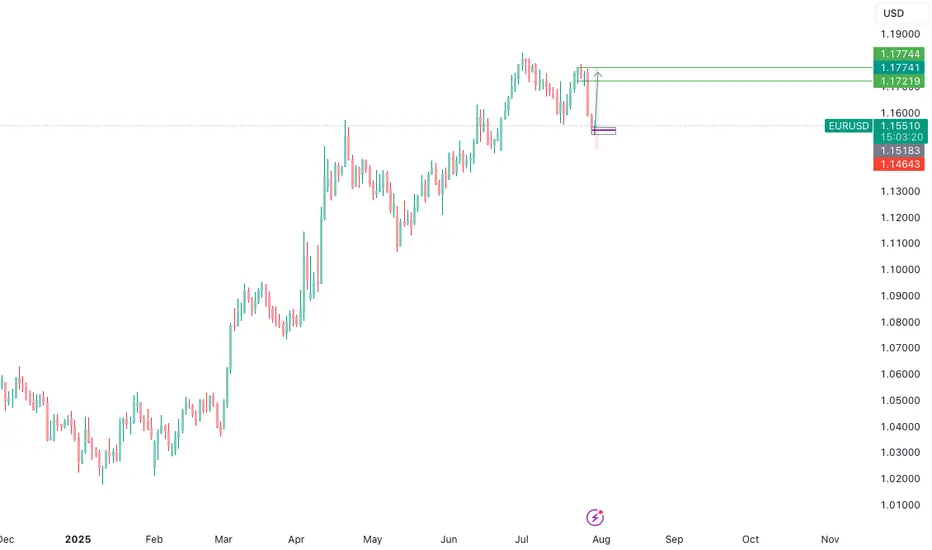
EURUSD Long Setup – Liquidity Sweep + Distribution Opportunity**📍 EURUSD Long Setup – Liquidity Sweep + Distribution Opportunity**
Currently monitoring EURUSD as price consolidates near a potential short-term demand zone. The recent price action suggests that we may observe a **liquidity grab below previous session lows**, possibly during the **London session**, before a directional move.
My focus remains on **how New York session will react** — potentially stepping in as a **distribution phase**, which could initiate the bullish leg toward the upper imbalance zones.
Key confluences:
* Anticipated liquidity below previous session lows (Asia & London).
* Bullish FVG aligned with higher timeframe structure.
* Targets at **1.17219** and extension toward **1.17744**, matching daily imbalance and previous supply area.
Patience is key here. Waiting for **clear confirmation post-sweep**, ideally via a CHoCH or bullish engulfing on the lower timeframe, before executing.
`DO NOT USE THIS AS SIGNAL OR ANY OF A KIND´
Emerson Massawe
COO | FINANCIAL MARKET ANALYST|
EURJPY ANALYSISAfter seeing the daily still pushing to the downside and breaking below key support of 171.250 we could be looking out for a retest and continuation to the down side target of 170.000
