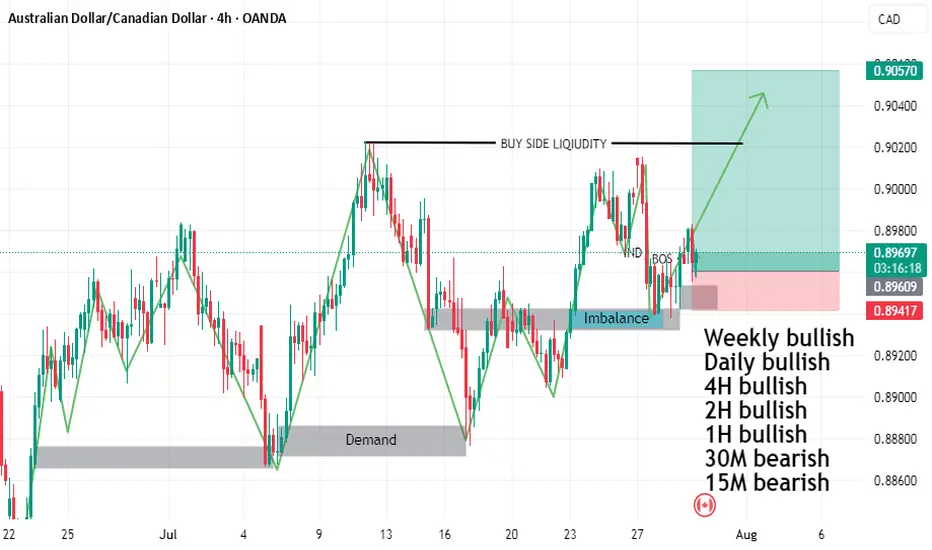
AUDCAD BUY SETUPTHE PRICE FORMED HEAD AND SHOULDER
and do rejection from mitigation order block and imbalance
and we have liquidity on time frame daily buy side liquidity
and time frame weekly double top
so I will buy with you
DON'T forget to follow me so that get more refresh analysis
Forex market
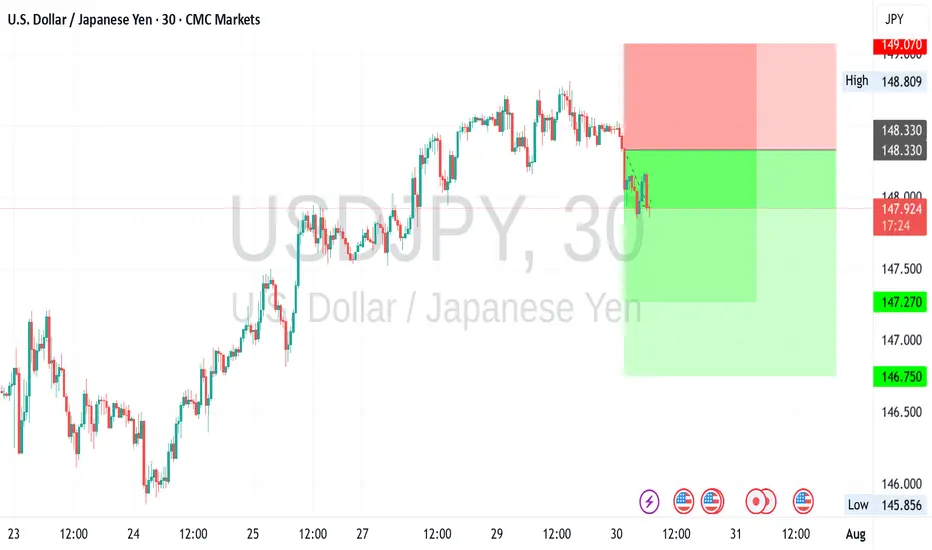
USDJPY Confirmed that the currency pair has been dominatedConfirmed that the currency pair has been dominated by the short side in the short term through high-frequency aggregated reasoning on the time-sharing K-line pattern, capital turnover bias, and short-cycle public opinion winds, especially suggests that under the current market conditions, investors need to be wary of what appears to be a mild rebound but is actually a long-drawn-out trap.
The trading spectrum chart tracked by the system shows that short high-frequency accounts have continued to maintain a steady increase in positions in recent trading cycles, while long transactions have shrunk significantly, with an obvious structural imbalance. Words like "conservative", "position reduction" and "trend risk" have proliferated in the public opinion platform, and the dominant market sentiment has shifted to defense.
What's more, multiple signals have formed a "negative resonance", including: macro pressure, net outflow of capital, weakening of technical rebound, and investors' mentality turning cold.
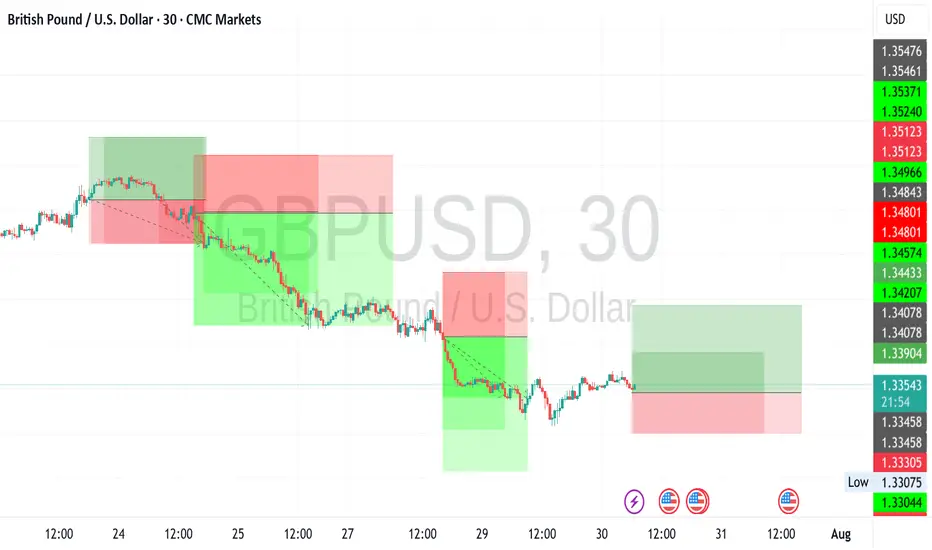
GBPUSD long Especially after some key economies announced higherCombined with the global market news sentiment, social platform dynamics and real-time capital flow situation, comprehensive judgment of the current foreign exchange market long and short pattern of positive changes. Especially after some key economies announced higher-than-market-expected GDP and inflation control results, the market's judgment on the future economic cycle tends to be positive.
The system monitored the rise of terms such as "return of growth", "confirmation of inflection point" and "confidence restoration" in social media and financial opinions, reflecting that market sentiment is shifting from wait-and-see to optimism. At the same time, the risk aversion mood edge down, risky asset allocation ratio rose, especially conducive to part of the high correlation between the performance of the currency pair repair.
Flow of funds data show that some large institutions since last week began to make up for the previous reduction in foreign exchange positions, the volume of transactions increased significantly, This is a positive reaction to the policy shift and improved economic data. Against this backdrop, the current formation of long momentum has a certain degree of sustainability.
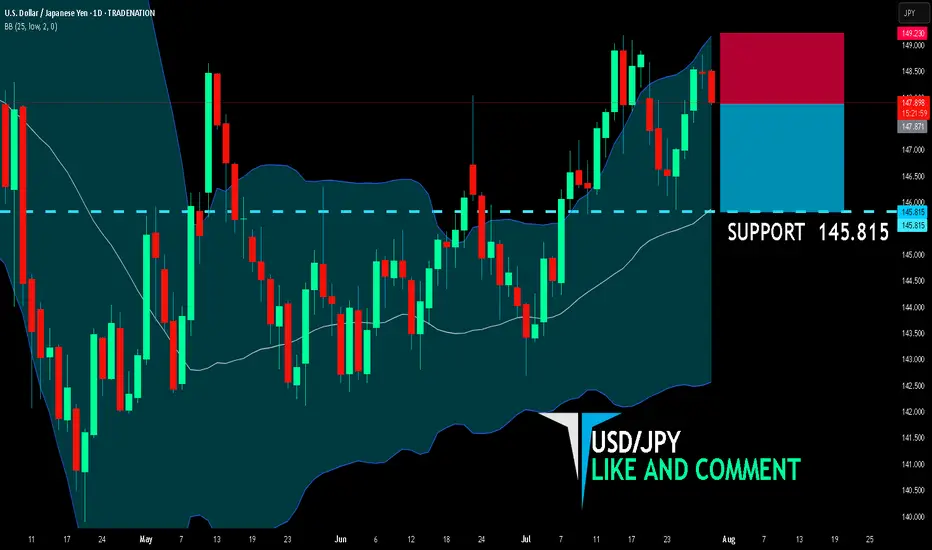
USD/JPY BEARS ARE GAINING STRENGTH|SHORT
USD/JPY SIGNAL
Trade Direction: short
Entry Level: 147.871
Target Level: 145.815
Stop Loss: 149.230
RISK PROFILE
Risk level: medium
Suggested risk: 1%
Timeframe: 1D
Disclosure: I am part of Trade Nation's Influencer program and receive a monthly fee for using their TradingView charts in my analysis.
✅LIKE AND COMMENT MY IDEAS✅
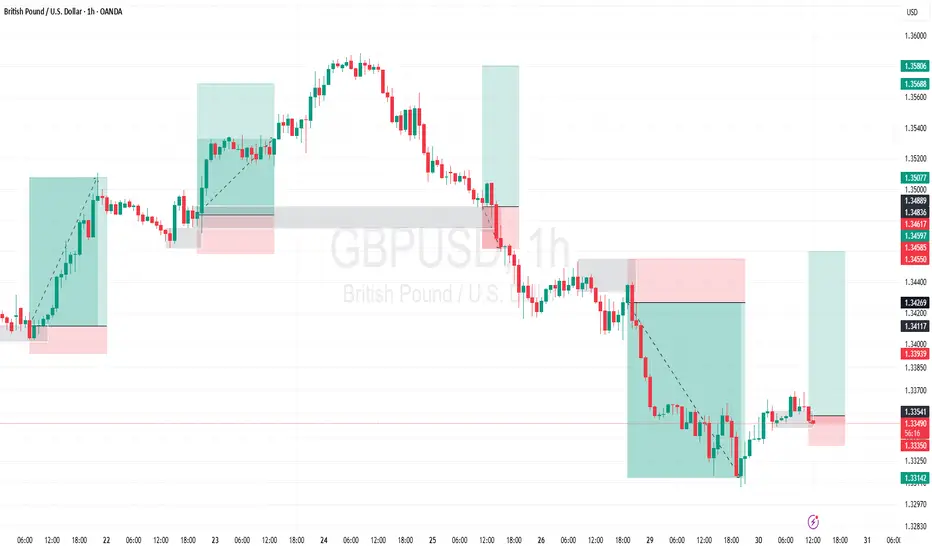
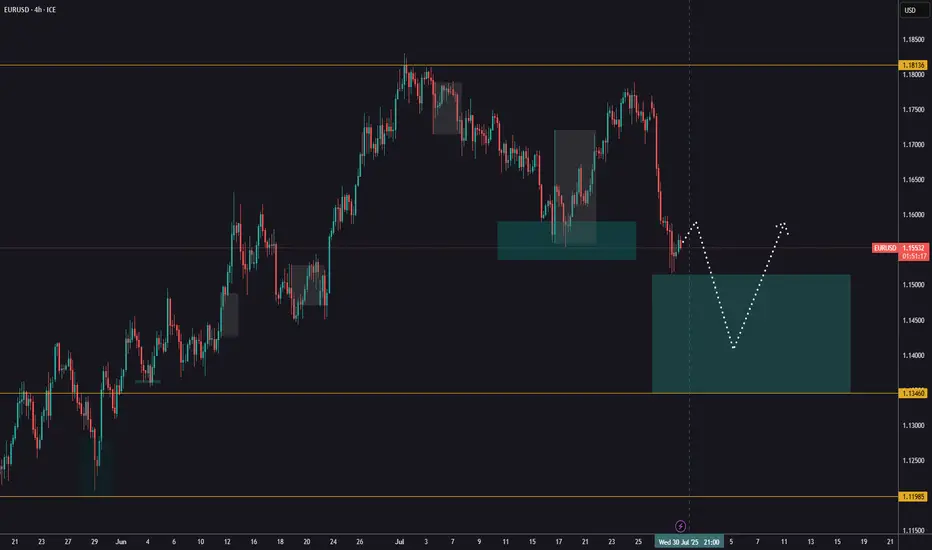
EURUSD analysis - 1H FVG and OB setupsOn the 1H timeframe, price has entered the green demand zone (1H FVG) around 1.1480 – 1.1520 after a strong bearish leg.
We're expecting a bullish retracement from this zone, aiming toward the upper red FVG/OB zone around 1.1690 – 1.1715.
📌 There are two key scenarios:
1️⃣ Scenario 1: Price starts moving up from the green FVG → reaches red FVG zone → short setup after lower timeframe confirmation
2️⃣ Scenario 2: Price makes an initial move to ~1.1620 → pulls back to the green zone → pushes back up into the red OB → short setup on confirmation
🎯 Final target for both scenarios: a break below the green FVG zone and continuation down
✅ Entry only after confirmation from lower timeframes (3M–15M)
❌ No trades without confirmation

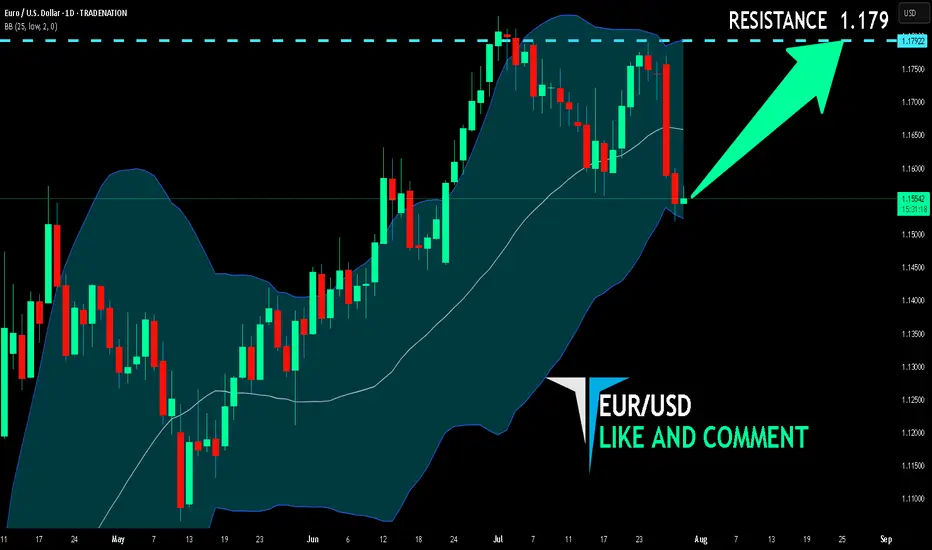
EUR/USD BULLISH BIAS RIGHT NOW| LONG
Hello, Friends!
EUR/USD pair is in the uptrend because previous week’s candle is green, while the price is obviously falling on the 1D timeframe. And after the retest of the support line below I believe we will see a move up towards the target above at 1.179 because the pair is oversold due to its proximity to the lower BB band and a bullish correction is likely.
Disclosure: I am part of Trade Nation's Influencer program and receive a monthly fee for using their TradingView charts in my analysis.
✅LIKE AND COMMENT MY IDEAS✅
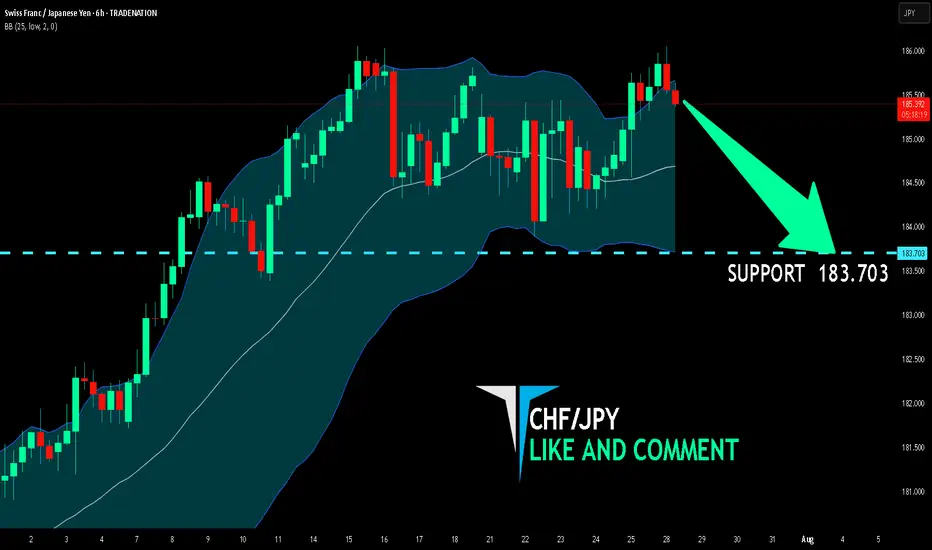
CHF/JPY BEARISH BIAS RIGHT NOW| SHORT
Hello, Friends!
The BB upper band is nearby so CHF-JPY is in the overbought territory. Thus, despite the uptrend on the 1W timeframe I think that we will see a bearish reaction from the resistance line above and a move down towards the target at around 183.703.
Disclosure: I am part of Trade Nation's Influencer program and receive a monthly fee for using their TradingView charts in my analysis.
✅LIKE AND COMMENT MY IDEAS✅
USDJPY PRICE AT RESISTANCE!Price is stuck at a resistance level of 148.198 ahead of US fed interest rate today. I from the higher timeframes (monthly and weekly) the market is still bullish. If we do get a break above the resistance level. More bullish price action will be envisaged.

AUDUSD FORECASTLooking into the AUDUSD today, the market is really looking Nice. Waiting for the market to reach at the area of focus. Looking to take as a sell limit order waiting for the price to Liquidate then taking after gaining volume and power to push to the downside, it gives me the high probability to looking into this pair.

GBPUSD LONG im buying GBPUSD because structure break shows buyer control Imbalance creates a natural magnet Lower timeframe confirms the energy
USDTHB 30 July 2025Despite ongoing geopolitical tensions between Thailand and Cambodia, the recent mild depreciation of the Thai baht is largely attributable to dollar strength. Accordingly, we have revised the USD/THB trading range slightly lower.
Monthly Target: 31.50-33.05 thb/usd

could continue to trendI am still fairly new to trading. It took my quite some time to analyze this chart, it was a trend, then it became a ranged market. I had difficulty finding a support, however, i did find my middle support, it is the black line, it could possible drop there, or, it would stay in my green support

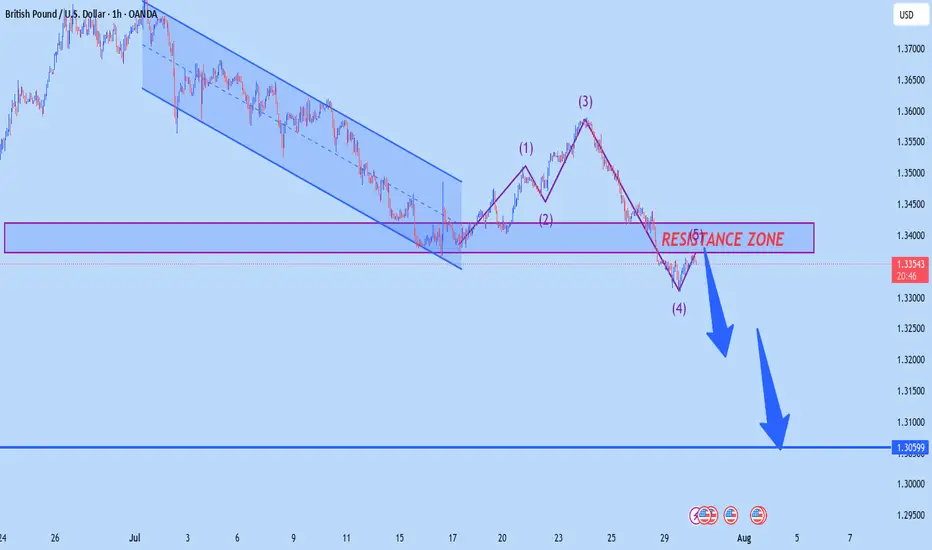
GBPUSD H1 OUTLOOKaccording to H1 analysis GBP market is at RESISTANCE LEVEL so we have great chance to go short from RESISTANCE LEVEL dont be greedy use money management
TRADE AT YOUR OWN RISK
REGARD ALBERT
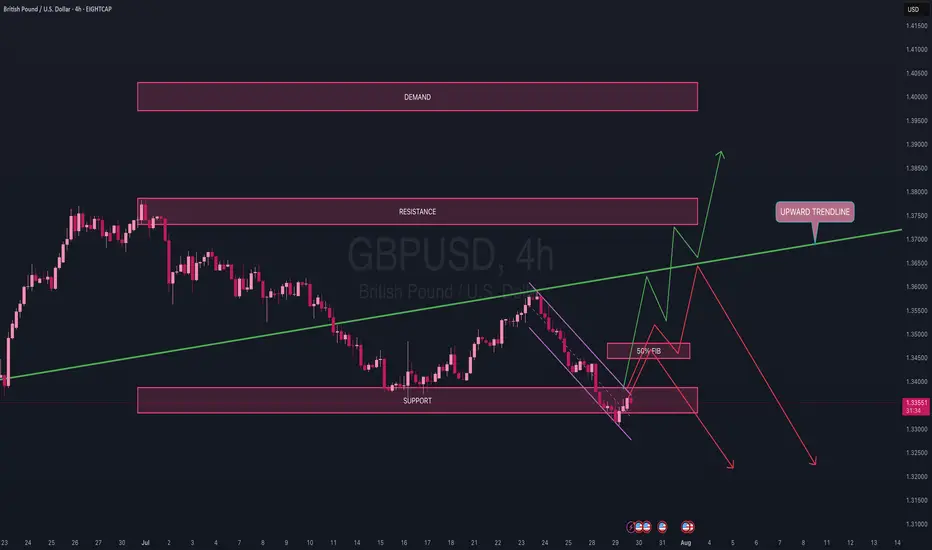
GBP/USD 4H Timeframe AnalysisOn the 4H timeframe, price recently bottomed out at the lower boundary of the channel and has since been hovering within a key support zone for the past couple of days.
My expectation is a potential push back up toward the 50% Fibonacci level of the most recent downward move, before a clearer decision is made. If we reach that level, it would satisfy all the criteria for a bearish flag formation, which could lead to a sudden move to the downside.
Alternatively, price may:
• Retest the ascending trendline before resuming the move down,
• Or break through that trendline, reclaiming bullish momentum back toward the resistance zone, and possibly into the demand area above.
For now, I’m waiting on clear confirmations before committing to a direction.
⚠️ Plenty of USD news on deck tomorrow, so stay patient.
Trade safe — only risk a maximum of 2% of your capital per day and don’t jump in without a solid setup.
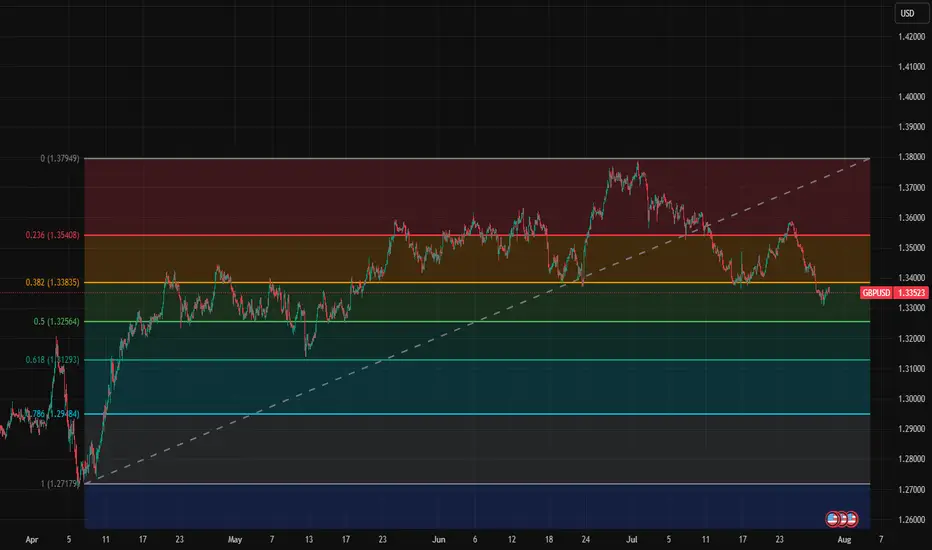
GBPUSD short term key levelsThese are short term key levels for intra day and swing trading on 1h chart.
1.3795
1.3541
1.3384
1.3264
1.3129
1.2948
1.2718
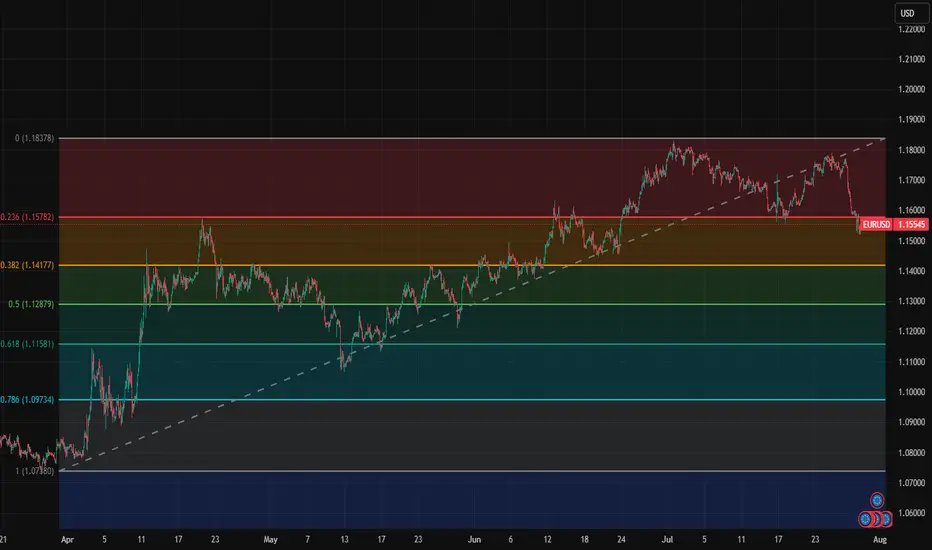
EurUsd short term key levelsThese are short term key levels for intra day and swing trading on 1h chart.
1.0718
1.0973
1.1158
1.1288
1.1418
1.1578
1.1838
USDJPY short term key levelsThese are short term key levels on 1h chart for intra day and swing trading.
139.91
142.33
144.23
145.57
146.91
148.56
151.233

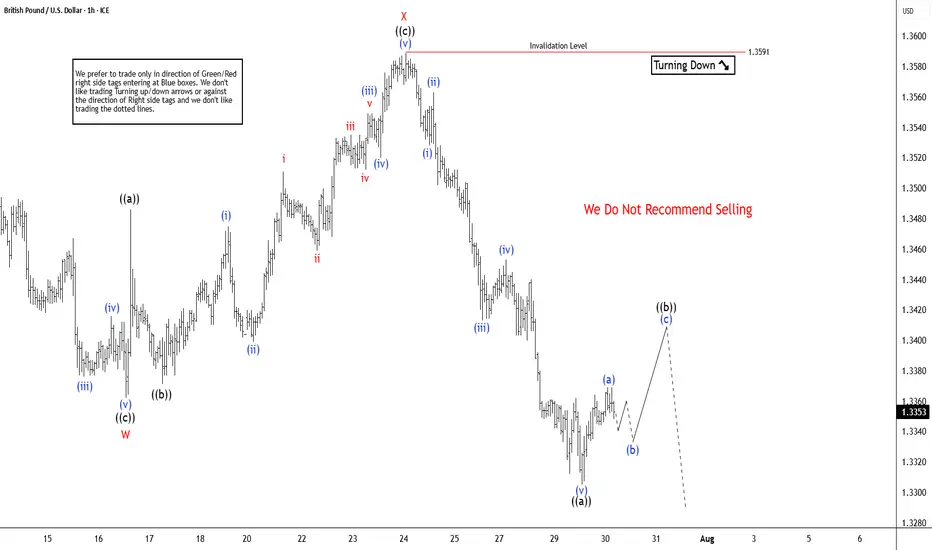
GBPUSD Elliott Wave Insight Bounce Should Fail Into Support ZoneThe GBPUSD is trading in higher high sequence from 9.22.2022 low in weekly. The bounce is corrective Elliott Wave sequence & expect further upside. It favors pullback in proposed 7 swings from 7.01.2025 high & extend into 1.3162 – 1.2898 area, while below 7.23.2025 high. It should find buyers into extreme area for next leg higher in daily or at least 3 swings bounce. In 4-hour, it started correcting lower from 7.01.2025 high. It ended W at 1.3362 low of 7.16.2025 & X at 1.3589 high of 7.23.2025 each in 3 swings. Below X high, it favors downside in Y in 3 swings as it broke below 7.16.2025 low, expecting into extreme area. Within W, it ended ((a)) at 1.3523 low, ((b)) at 1.3620 high & ((c)) at 1.3362 low. Above there, it placed ((a)) at 1.3486 high, ((b)) at 1.3371 low & ((c)) as X connector at 1.3589 high. The double correction unfolds in 3-3-3 structure, which will complete, when current bounce fails below 7.23.2025 high to new low into extreme area. It ended ((a)) of Y into 0.618 – 0.764 Fibonacci extension area of W & expect 3 or 7 swings bounce in ((b)).
Below X high, it placed ((a)) of Y at 1.3305 low & favors bounce in ((b)) in 3 or 7 swings against 7.23.2025 high. Within ((a)), it ended (i) at 1.3528 low, (ii) at 1.3563 high, (iii) at 1.3413 low, (iv) at 1.3543 high & (v) at 1.3305 low. Above there, it favors bounce in (a) of ((b)) and expect small upside before it should pullback in (b). The next pullback in (b) should stay above 1.3305 low choppy price action before continue upside in (c). Ideally, ((b)) can bounce between 1.3413 – 1.3481 area as 0.382 – 0.618 Fibonacci retracement of ((a)) before continuing lower. Wave ((b)) bounce expect to fail below 1.3591 high before extending lower in ((c)) into 1.3162 – 1.2898 to finish double correction. Because of higher high in daily since September-2022 low, it should find buyers in extreme area to resume higher. It expects sideways to higher until FOMC event followed by selloff, while bounce fail below 7.23.2025 high. We like to buy the pullback into extreme area for next leg higher or at least 3 swings reaction.
EURUSD ahead of the FEDEURUSD remains below the 1,1600 level following the trade agreement between the US and the European Union.
Today, all eyes are on the FED’s decision regarding interest rates.
Watch for a reaction around the support zone, as it may present an opportunity for the trend to continue.
However, it's advisable to reduce risk and hold off on new entries until after the news is released.
Sell EURGBP now for a quick scalping Sell EURGBP now for a quick scalping ...... looking for 20 pips plus on profit target here

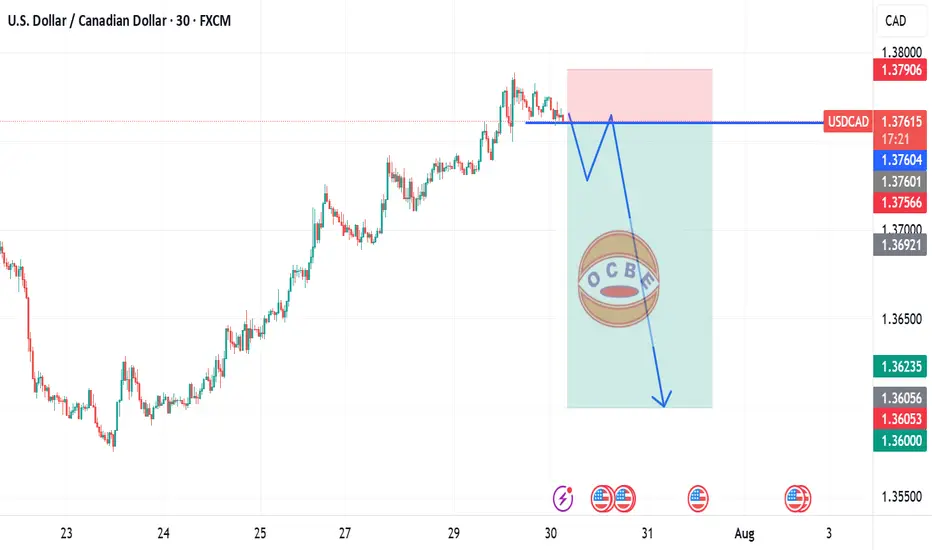
USDCAD short move
Price is currently at a support level and if there should be a break then i will be expecting more downward movement in price.
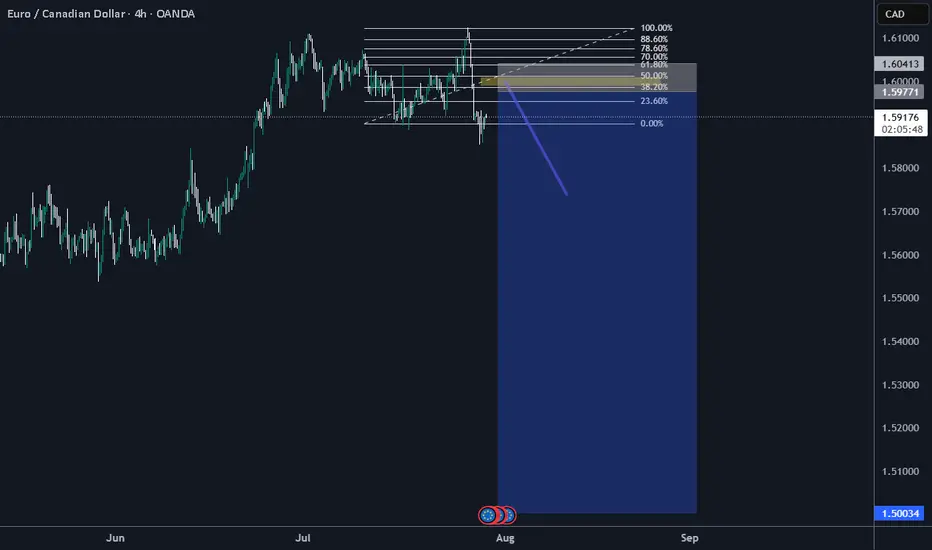
Shorts ConfirmationPrepare to sell! Be Ready! Its preparing a move like eurusd, we try to make a similiar down push, this patern is ready to drain al that liquidity downstairs
A Top Down Approach will help you spot quality tradesAll the information you need to find a high probability trade are in front of you on the charts so build your trading decisions on 'the facts' of the chart NOT what you think or what you want to happen or even what you heard will happen. If you have enough facts telling you to trade in a certain direction and therefore enough confluence to take a trade, then this is how you will gain consistency in you trading and build confidence. Check out my trade idea!!
tradingview.sweetlogin.com
