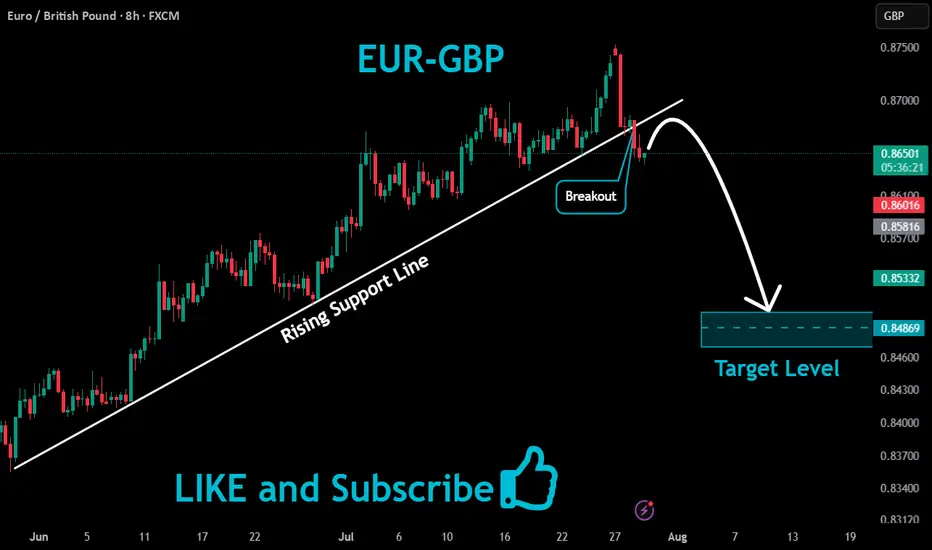
EURGBP Bearish Breakout!
HI,Traders !
#EURGBP broke the rising
Support line and the breakout
Is confirmed so we are
Bearish biased and we
Will be expecting a
Further move down !
Comment and subscribe to help us grow !
Forex market
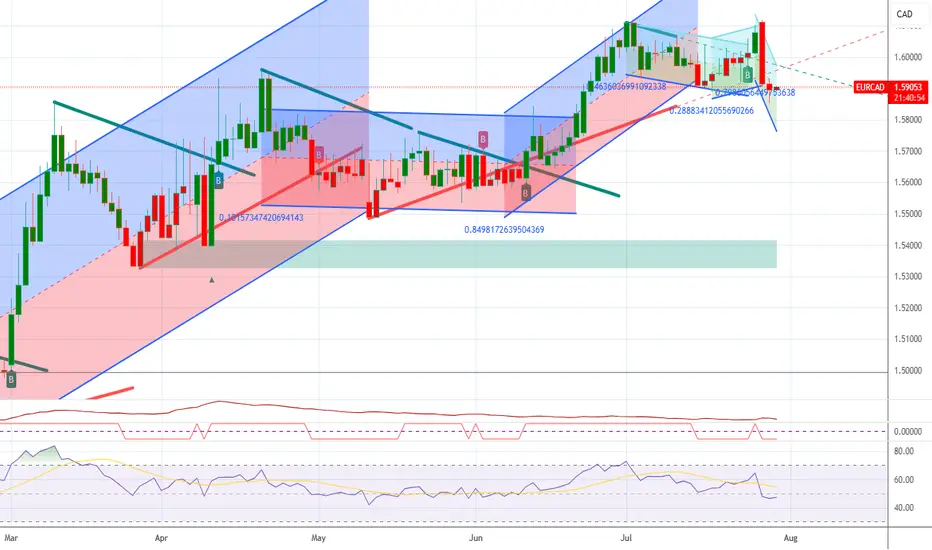
EURCAD ShortEURCAD is now net short on the regression break.
I am considering this trade as oil has move over night.
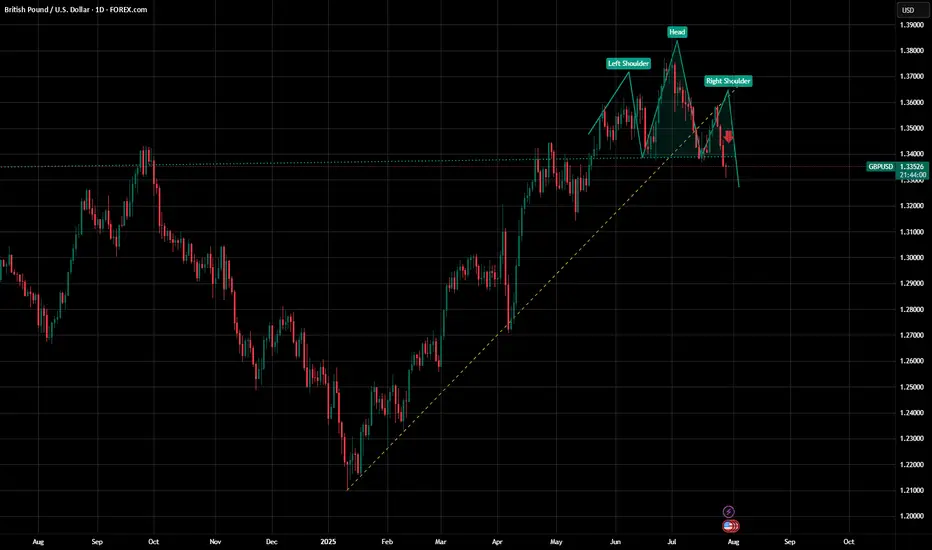
GBPUSD- Daily - H&S PatternReversal Pattern - Bearish Head and Shoulders
Levels - Trendline break and retest - breakdown of the 1.335 level
Price action - 70 day breakout, Strong bearish moves
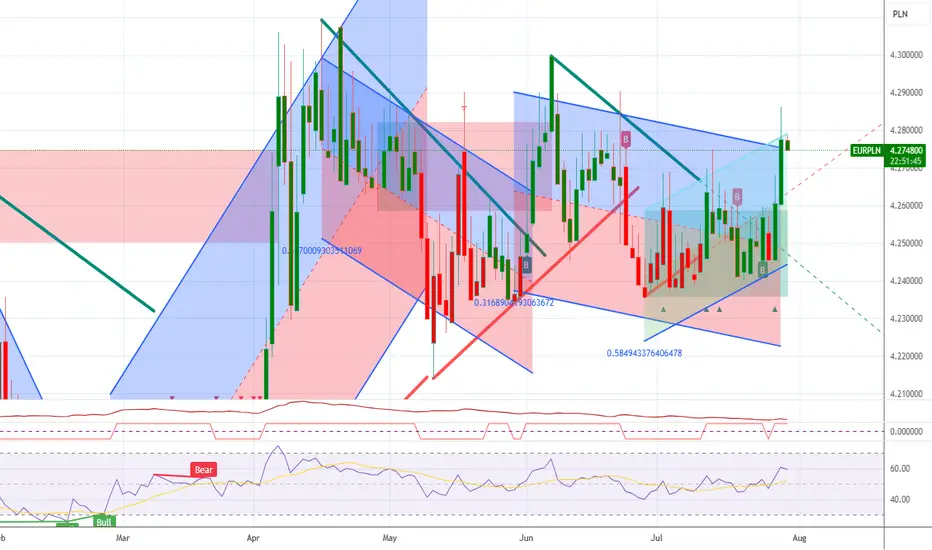
USDPLN LongUSDPLN is now net long on the regression break.
I am considering my options on the PLN crosses.

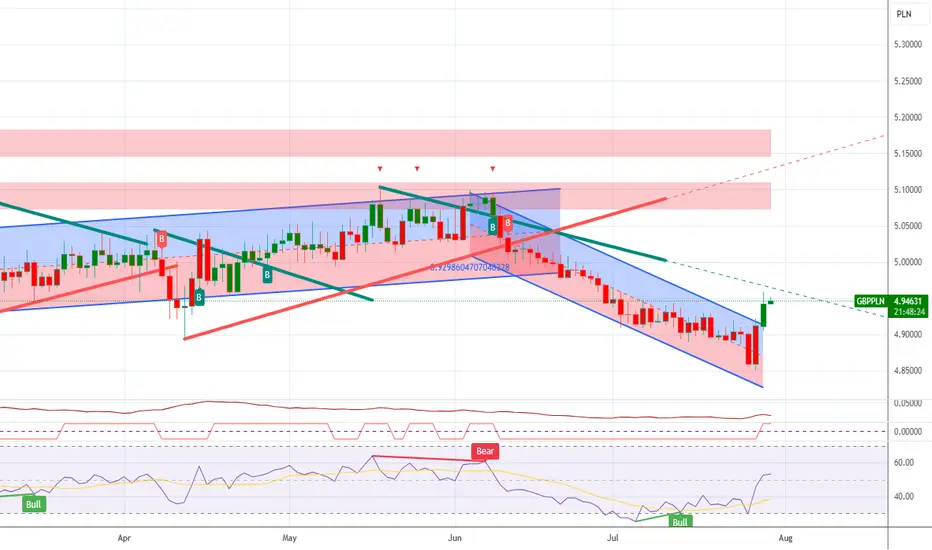
GBPPLN LongGBPPLN is now net long on the regression break.
PLN and HUF have both been hit and it may indicate a new stage in the Ukraine war.
EUR/USD: The Last Bear Standing...As indicated on my previous EUR/USD idea ( that's still currently open ), I remain short EUR/USD given the technical aspect of things are still valid.
Divergences are still in play along with a rising broadening pattern and the fact that we're trading at the yearly R3 level ( which is rare ).
I suspect we will have some volatility with the ECB press conference tomorrow, so that should get things moving hopefully in the bearish direction. If we begin trading aggressively above 1.1800+, that will invalidate the short idea overall.
If we roll over, I'm still looking for 1.13000 - 1.12000 as the target range for Q3 going into Q4.
We'll see how this all develops.
As always, Good Luck & Trade Safe!

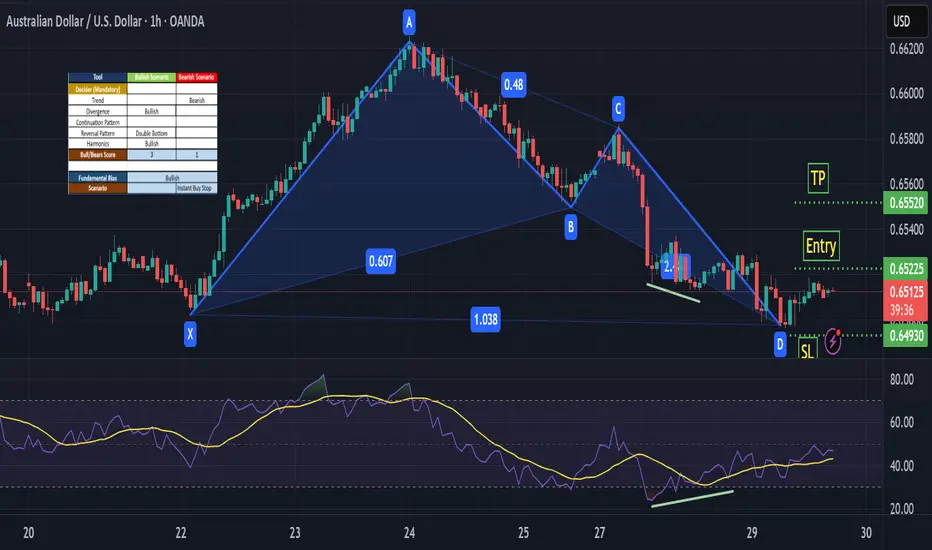
AUDUSD - BullishAUDUSD is Bullish on Fundamental Bias and Seasonal aslo support long position. Divergence can also be observed on RSI. Forming an Harmonic pattern so it looks like buyers are in a strong position
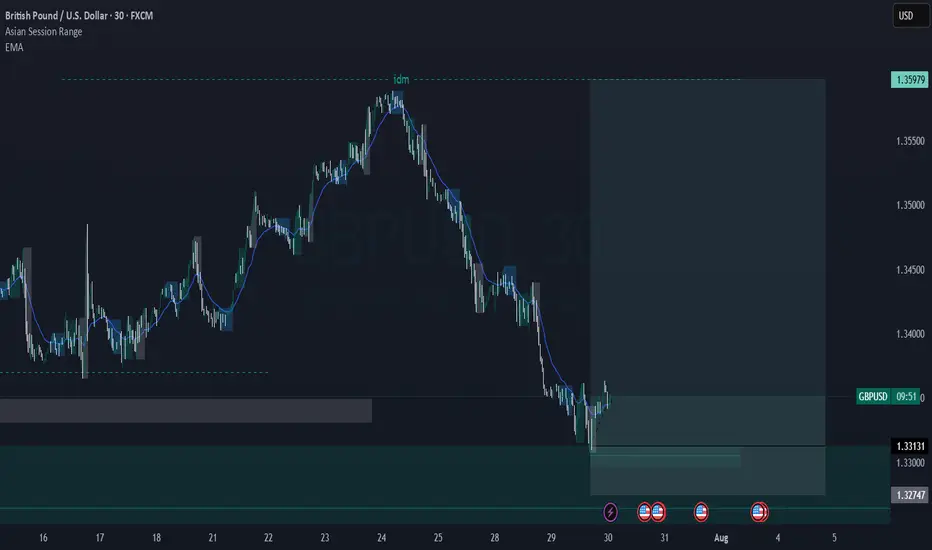
GBPUSD as a planedThe daily structure remains bullish, though price is currently retracing into deeper levels, potentially targeting areas of inefficiency and liquidity.
On the 4H timeframe, price has:
Formed a valid demand zone
Left behind an imbalance
Built liquidity just below the zone, increasing the chance of a sweep before reacting
📍 Plan:
Wait for a mitigation of the 4H demand zone, ideally accompanied by a liquidity sweep
Then, drop to lower timeframes (M5–M15) to look for:
CHoCH
BOS
Bullish structure for entry confirmation
✅ Price is currently executing as planned, respecting the structure and moving toward our zone of interest. Stay ready to act upon confirmation
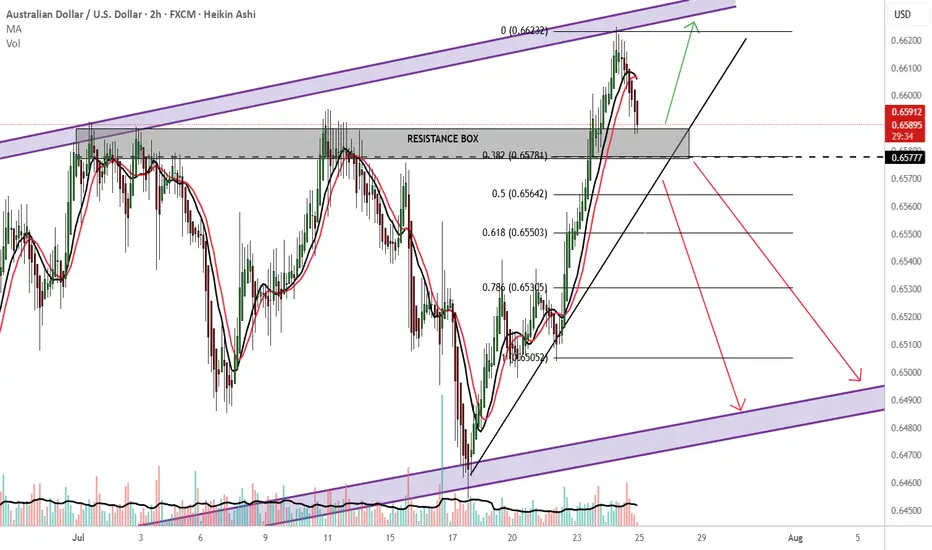
AUDUSD Still early days
20% in me:
Unless strong bullish fundamentals present themselves or the big boys with the big bucks drive a bullish push anywhere from 0.65784 or resistance, I would be looking to sell.
Buy outside the resistance box
TP:0.66600 new immediate high?
Please also consider price action as there are 2 previous rejections in the 0.65784 price area.
80% in me:
-Australia is heavily tied to China via exports
RBA rate cuts?
Falling iron ore prices...
-Perfect price action channel trade. SELL at resistance BUY at support. Bullish long term, bearish short term.
-fib 0.382 downward continuation and close below 0.65784
-Looking for a break below the upward sloping trendline HARD sell
-safer option: wait for a 0.65780 retest, below the upward sloping trendline sells and make bank.
TP: 0.6500
THOUGHTS?
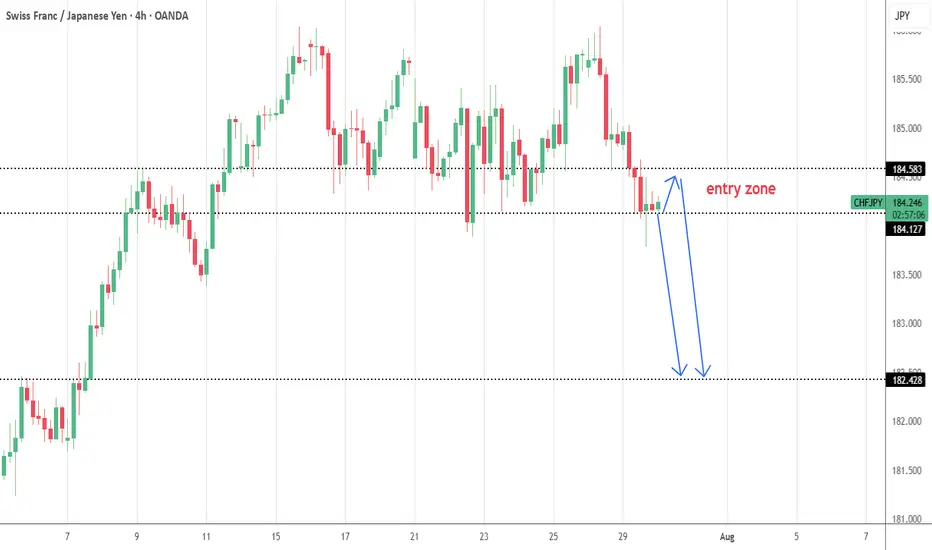
CHFJPY--SHORT--30-07-25--short term short possibility
--entry zone: between 184.186 and 184.583. either price rise up to 184.583 then fall or fall from 184.186
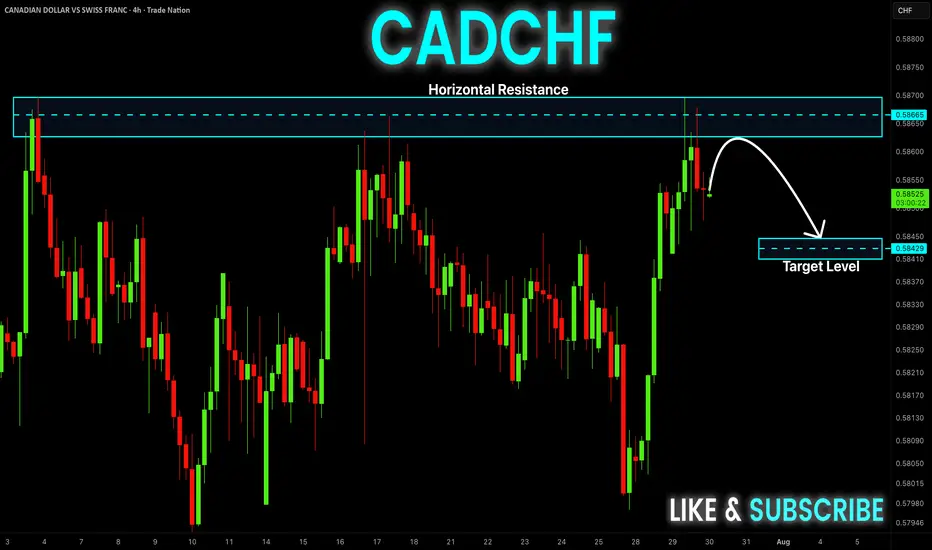
CAD-CHF Local Short! Sell!
Hello,Traders!
CAD-CHF went up and
Made a retest of the
Horizontal resistance
Around 0.5870 and we
Are already seeing a bearish
Pullback so we will be
Expecting a further
Bearish correction
Sell!
Comment and subscribe to help us grow!
Check out other forecasts below too!
Disclosure: I am part of Trade Nation's Influencer program and receive a monthly fee for using their TradingView charts in my analysis.
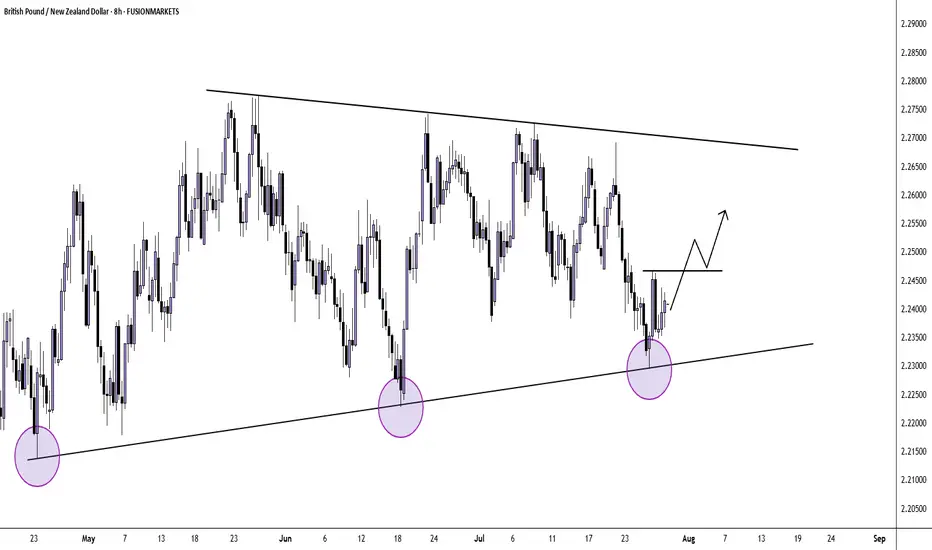
GBP/NZD H8 AnalysisPrice has rejected the support trendline for a third time.
It's possible that we will now see buyers step in but we need to see higher highs and lows form to confirm.
Look for a trade that meets your strategy rules if you agree.
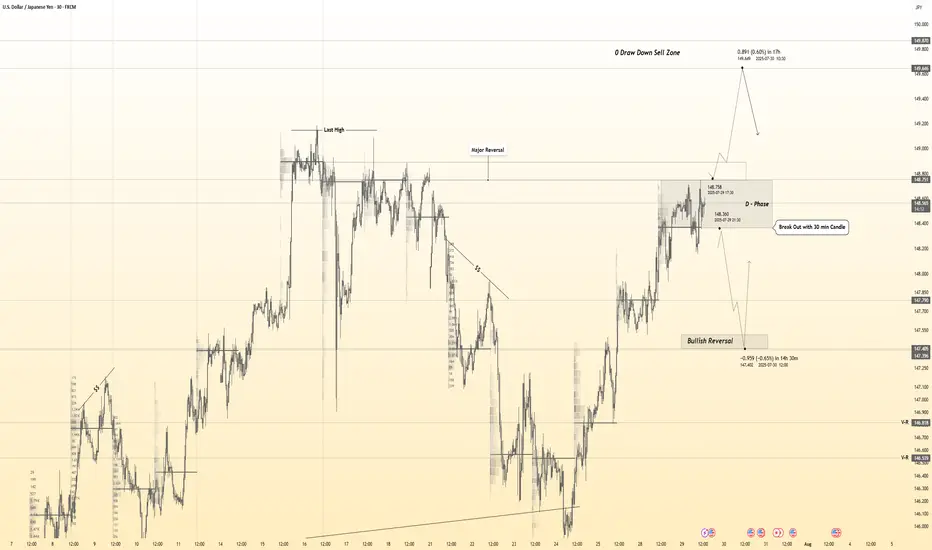
USDJPY 30Min Engaged ( BULLISH & Bearish Break Entry Detected )Time Frame: 30-Minute Warfare
Entry Protocol: Only after volume-verified breakout
🩸Bullish Break- 148.750
🩸Bearish Break- 148.370
➗ Hanzo Protocol: Volume-Tiered Entry Authority
➕ Zone Activated: Dynamic market pressure detected.
The level isn’t just price — it’s a memory of where they moved size.
Volume is rising beneath the surface — not noise, but preparation.
🔥 Tactical Note:
We wait for the energy signature — when volume betrays intention.
The trap gets set. The weak follow. We execute.
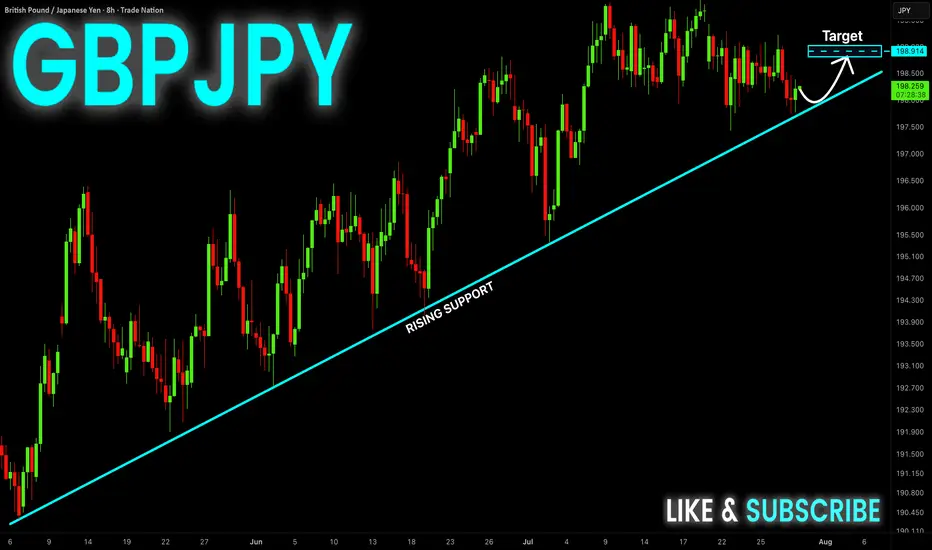
GBP-JPY Rising Support! Buy!
Hello,Traders!
GBP-JPY is trading in an
Uptrend and the pair made
A retest of the rising support
And we are seeing a local
Bullish rebound and we will
Be expecting a further
Local move up
Buy!
Comment and subscribe to help us grow!
Check out other forecasts below too!
Disclosure: I am part of Trade Nation's Influencer program and receive a monthly fee for using their TradingView charts in my analysis.
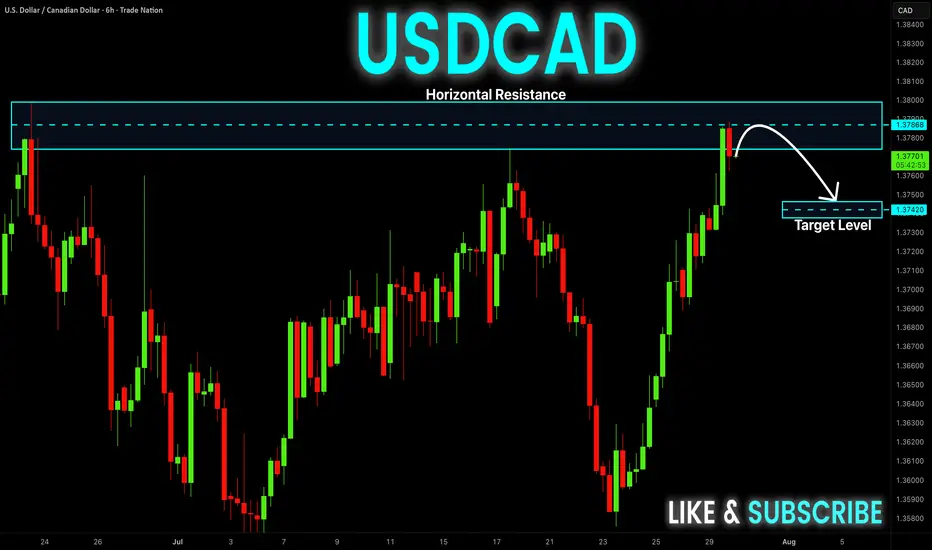
USD-CAD Short From Resistance! Sell!
Hello,Traders!
USD-CAD went up and
Retested a horizontal
Resistance of 1.3800
From where we are
Already seeing a local
Bearish pullback and
As we are locally bearish
Biased so we will be
Expecting a local move down
Sell!
Comment and subscribe to help us grow!
Check out other forecasts below too!
Disclosure: I am part of Trade Nation's Influencer program and receive a monthly fee for using their TradingView charts in my analysis.
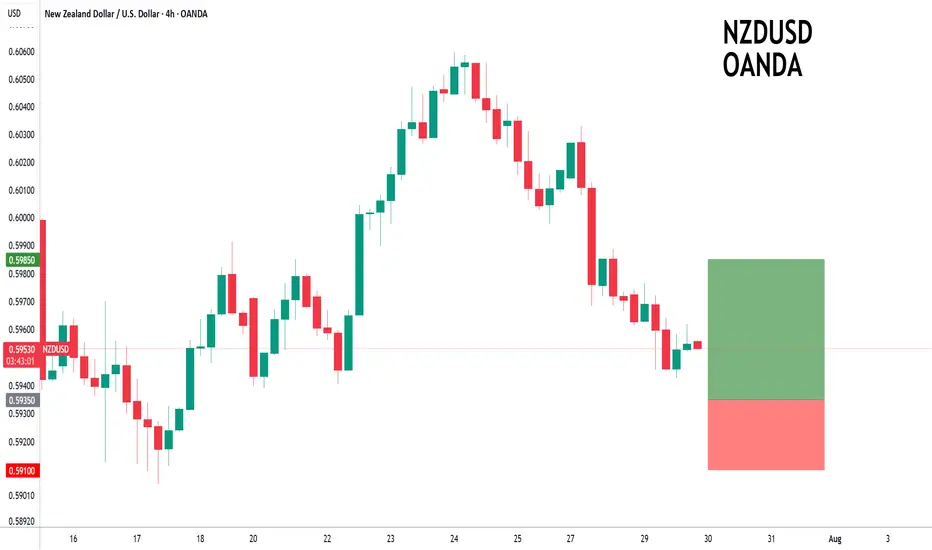
NZDUSD to form a higher low?NZDUSD - 24h expiry
Pivot support is at 0.5935.
We expect a reversal in this move.
Risk/Reward would be poor to call a buy from current levels.
A move through 0.5975 will confirm the bullish momentum.
The measured move target is 0.6000.
We look to Buy at 0.5935 (stop at 0.5910)
Our profit targets will be 0.5985 and 0.6000
Resistance: 0.5975 / 0.5985 / 0.6000
Support: 0.5935 / 0.5925 / 0.5910
Risk Disclaimer
The trade ideas beyond this page are for informational purposes only and do not constitute investment advice or a solicitation to trade. This information is provided by Signal Centre, a third-party unaffiliated with OANDA, and is intended for general circulation only. OANDA does not guarantee the accuracy of this information and assumes no responsibilities for the information provided by the third party. The information does not take into account the specific investment objectives, financial situation, or particular needs of any particular person. You should take into account your specific investment objectives, financial situation, and particular needs before making a commitment to trade, including seeking, under a separate engagement, as you deem fit.
You accept that you assume all risks in independently viewing the contents and selecting a chosen strategy.
Where the research is distributed in Singapore to a person who is not an Accredited Investor, Expert Investor or an Institutional Investor, Oanda Asia Pacific Pte Ltd (“OAP“) accepts legal responsibility for the contents of the report to such persons only to the extent required by law. Singapore customers should contact OAP at 6579 8289 for matters arising from, or in connection with, the information/research distributed.
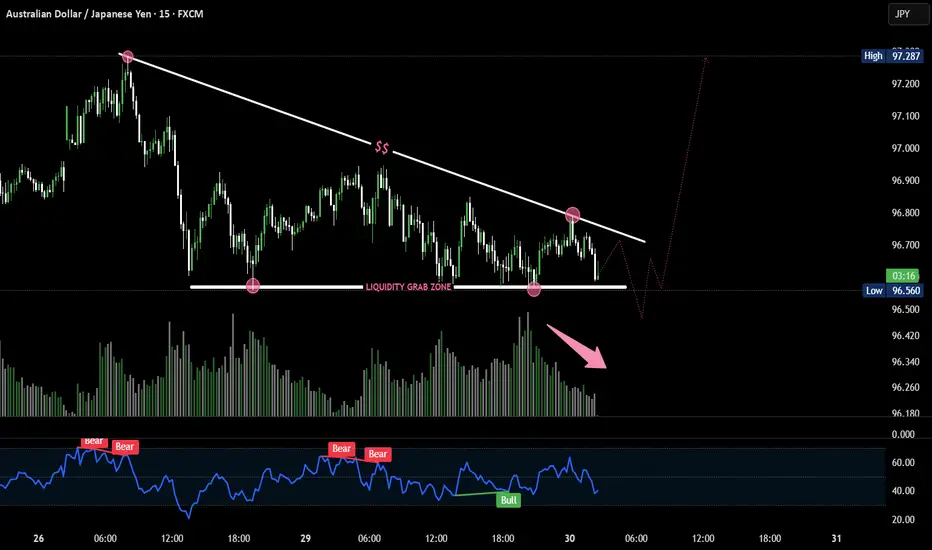
AUD/JPY Poised for Breakout After Liquidity Trap? 🔍 Key Observations:
🔻 Trendline resistance holding strong, forming lower highs.
📉 Sell-side liquidity resting just below horizontal support (marked zone).
💧 Price dipped into liquidity grab zone twice — sign of stop hunt.
🔁 Classic accumulation schematic forming — repeated sweeps before potential breakout.
📊 Volume divergence: Selling pressure weakening while liquidity is swept.
📉 RSI shows bullish divergence (price making lower lows, RSI making higher lows).
🔁 Rejection at RSI 40-level could indicate a bounce.
📈 Expectation:
One more fake breakdown below 96.500 could trigger aggressive buying — setting up a potential parabolic move toward 97.200+ if breakout occurs.
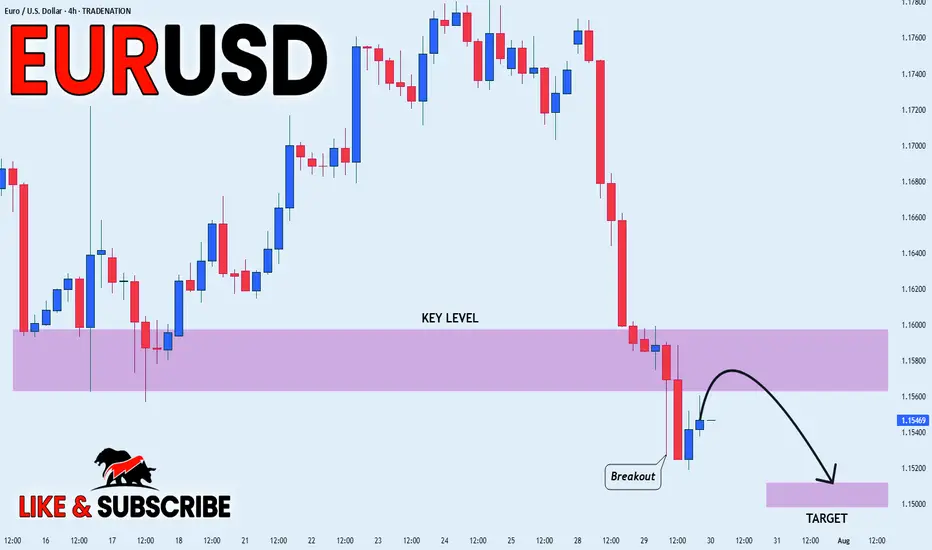
EUR_USD BEARISH BREAKOUT|SHORT|
✅EUR_USD broke the key
Structure level of 1.1580
While trading in an local downtrend
Which makes me bearish
And I think that after the retest of
The broken level is complete
A bearish continuation will follow
SHORT🔥
✅Like and subscribe to never miss a new idea!✅
Disclosure: I am part of Trade Nation's Influencer program and receive a monthly fee for using their TradingView charts in my analysis.
$GBPCAD: Overall Bearish, Short Term Upside
➡️ Downside motive wave: We are finishing 5 waves at strong blue support zone. I don´t see enough momentum to break this zone at the moment.
➡️ Expect a recovery: Price will probably make a short-term recovery, with a high probability of reaching the middle of the range at 1.85-1.86.
➡️ After this recovery (wave 2 or B), expect further downside, potentially breaking blue support.

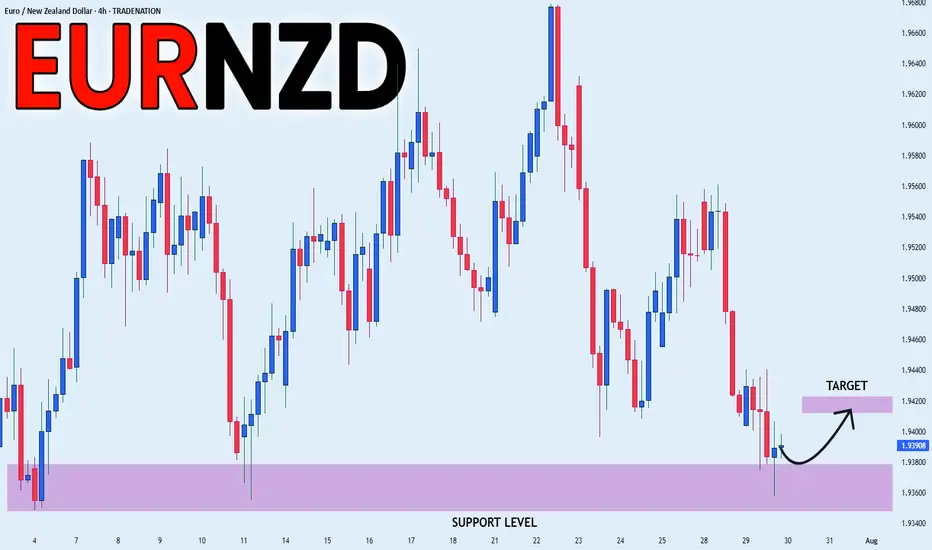
EUR_NZD REBOUND AHEAD|LONG|
✅EUR_NZD fell again to retest the support of 1.9380
But it is a strong key level
So I think that there is a high chance
That we will see a bullish rebound and a move up
LONG🚀
✅Like and subscribe to never miss a new idea!✅
Disclosure: I am part of Trade Nation's Influencer program and receive a monthly fee for using their TradingView charts in my analysis.
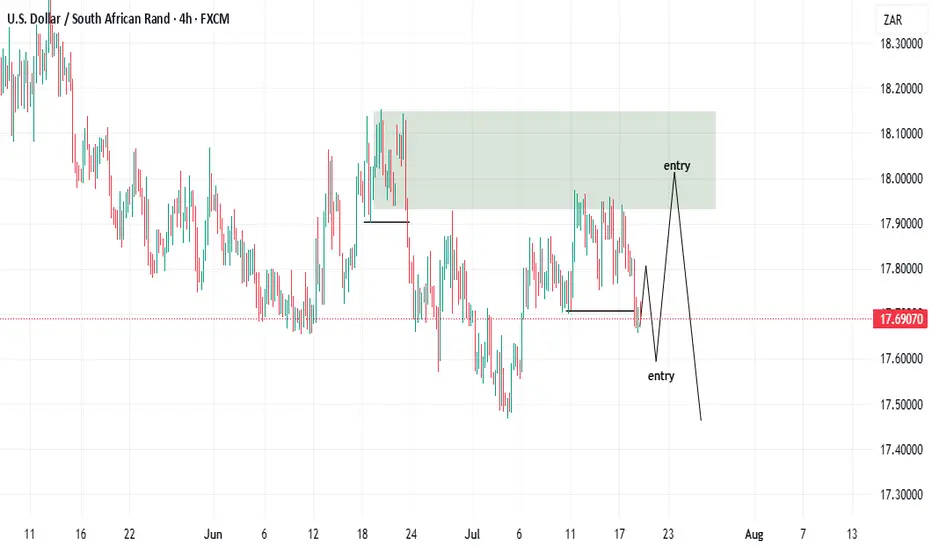
buy then sell!Hello all. I had a time to check some other pairs as USDZAR. I don't trade this pair but for who wants to trade, I think there is a very good OPP. to go buy and sell one after another. be happy(wink)
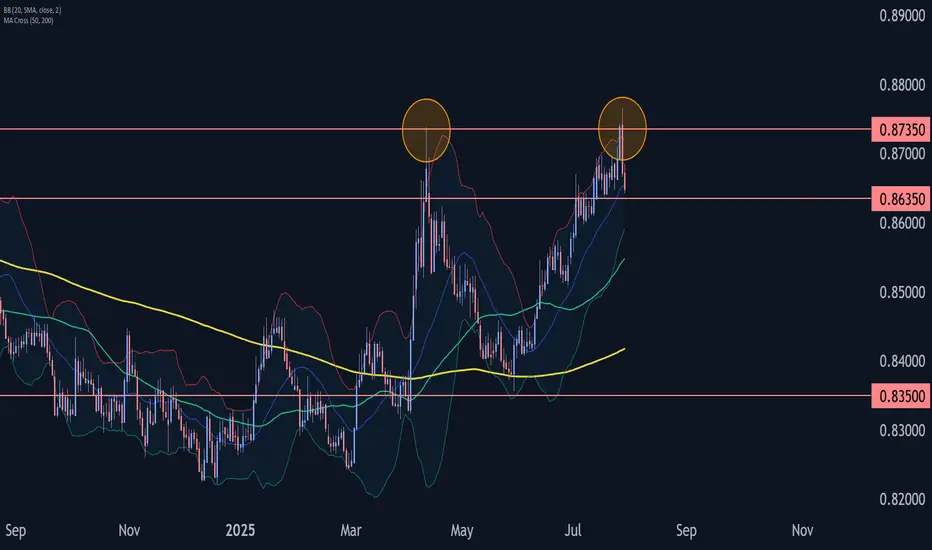
EURGBP Wave Analysis – 29 July 2025- EURGBP reversed from the resistance zone
- Likely fall to support level 0.8635
EURGBP currency pair recently reversed down from the resistance zone between the multi-month resistance level 0.8735 (which stopped sharp wave (A) in April) and the upper daily Bollinger Band.
The downward reversal from this resistance zone created the daily Japanese candlesticks reversal pattern Dark Cloud Cover.
Given the strength of the resistance level 0.8735, EURGBP currency pair can be expected to fall to the next support level 0.8635 (low of the previous minor correction ii).