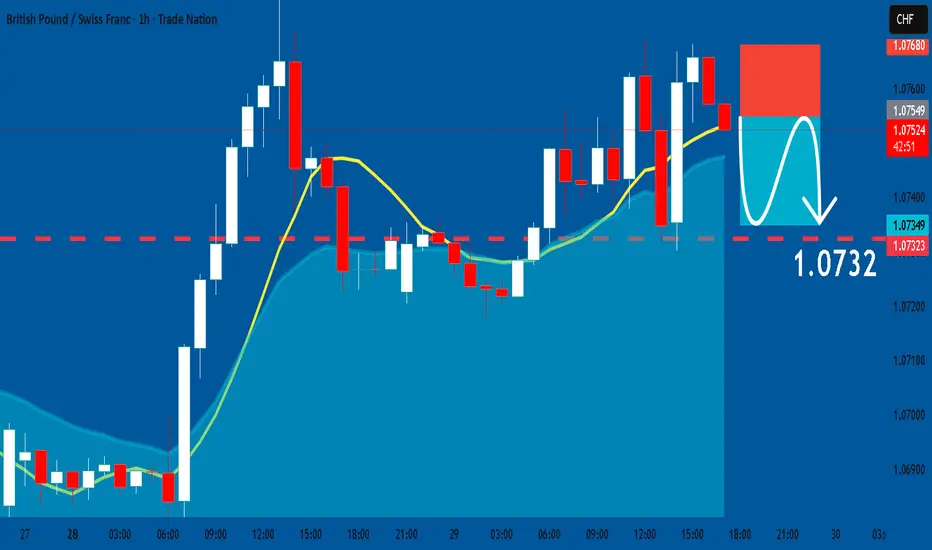
GBPCHF: Short Signal with Entry/SL/TP
GBPCHF
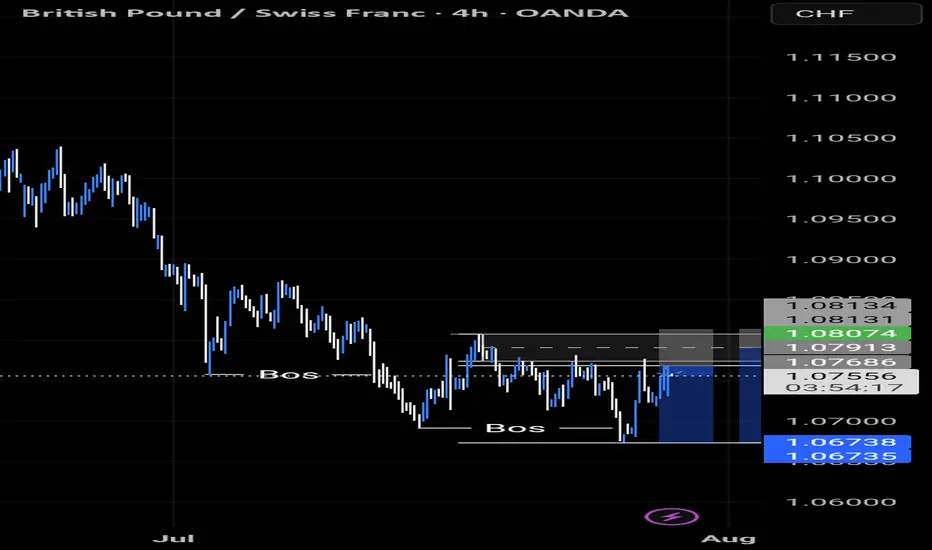
- Classic bearish setup
- Our team expects bearish continuation
SUGGESTED TRADE:
Swing Trade
Short GBPCHF
Entry Point - 1.0754
Stop Loss - 1.0768
Take Profit - 1.0732
Our Risk - 1%
Start protection of your profits from lower levels
Disclosure: I am part of Trade Nation's Influencer program and receive a monthly fee for using their TradingView charts in my analysis.
❤️ Please, support our work with like & comment! ❤️
Forex market
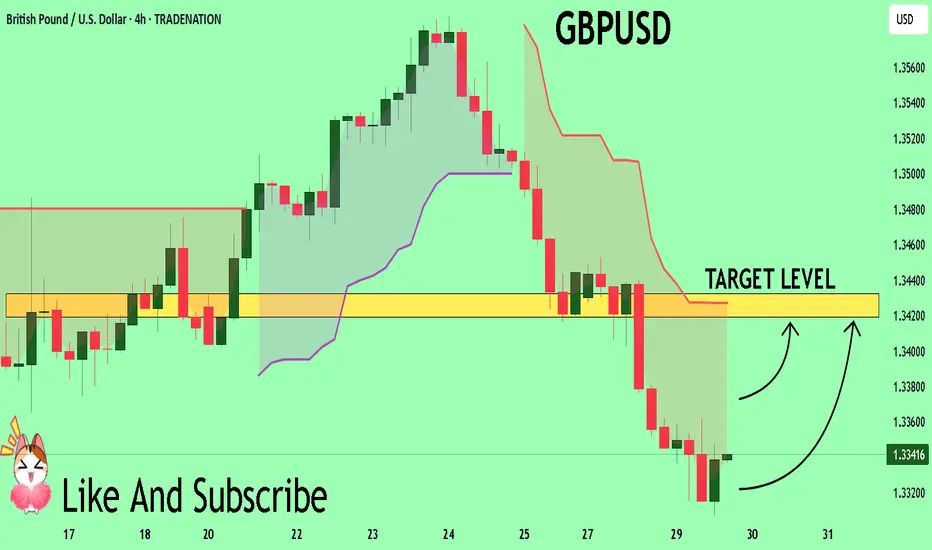
GBPUSD Will Explode! BUY!
My dear friends,
Please, find my technical outlook for GBPUSD below:
The instrument tests an important psychological level 1.3339
Bias - Bullish
Technical Indicators: Supper Trend gives a precise Bullish signal, while Pivot Point HL predicts price changes and potential reversals in the market.
Target - 1.3419
About Used Indicators:
Super-trend indicator is more useful in trending markets where there are clear uptrends and downtrends in price.
Disclosure: I am part of Trade Nation's Influencer program and receive a monthly fee for using their TradingView charts in my analysis.
———————————
WISH YOU ALL LUCK
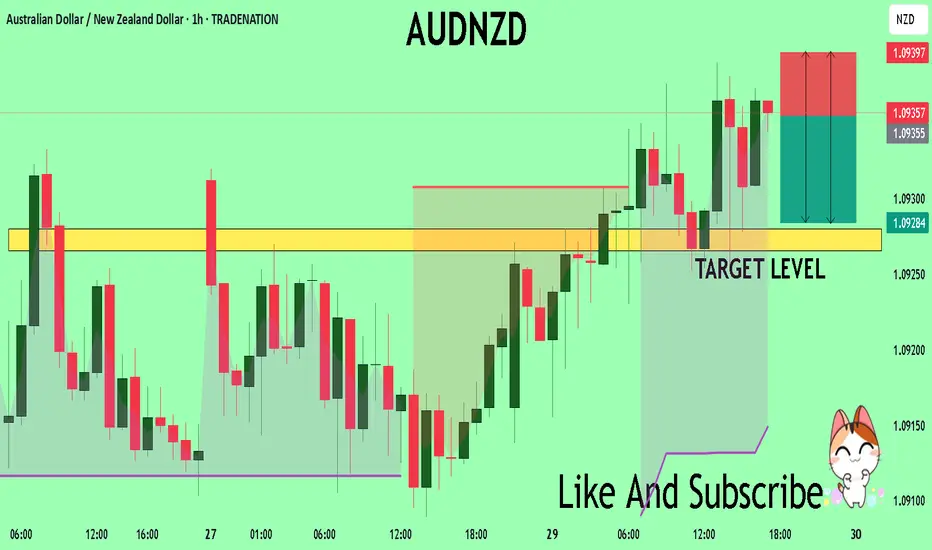
AUDNZD Technical Analysis! SELL!
My dear friends,
AUDNZD looks like it will make a good move, and here are the details:
The market is trading on 1.0935 pivot level.
Bias - Bearish
Technical Indicators: Supper Trend generates a clear short signal while Pivot Point HL is currently determining the overall Bearish trend of the market.
Goal - 1.0928
Recommended Stop Loss - 1.0939
About Used Indicators:
Pivot points are a great way to identify areas of support and resistance, but they work best when combined with other kinds of technical analysis
Disclosure: I am part of Trade Nation's Influencer program and receive a monthly fee for using their TradingView charts in my analysis.
———————————
WISH YOU ALL LUCK
GBPCHF TRADE IDEA We're in on a downside movement on GBPCHF.
We had a pullback to our Fibonacci level and the market seems to be making a move to the downside
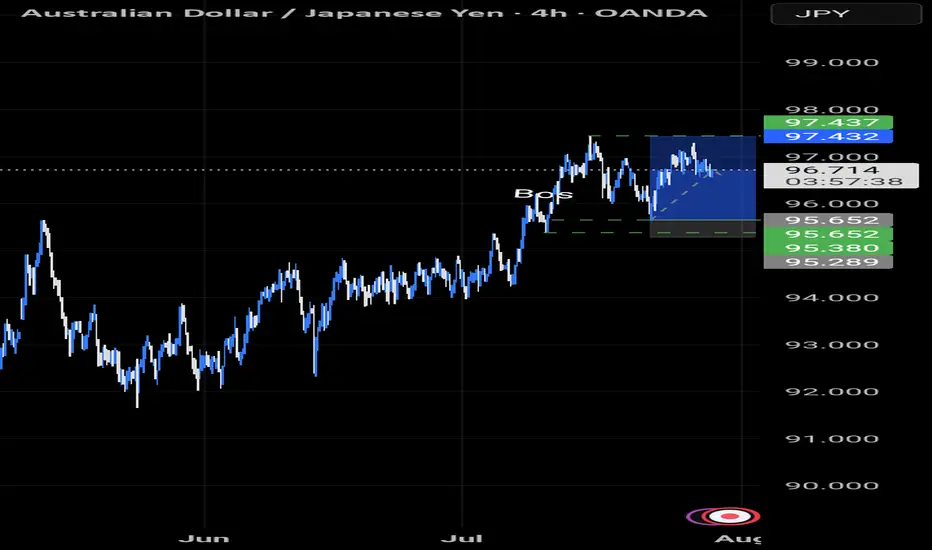
AUDJPY TRADE IDEA UPDATE AUDJPY also made a pullback to our Fibonacci level and has made a move to the upside.
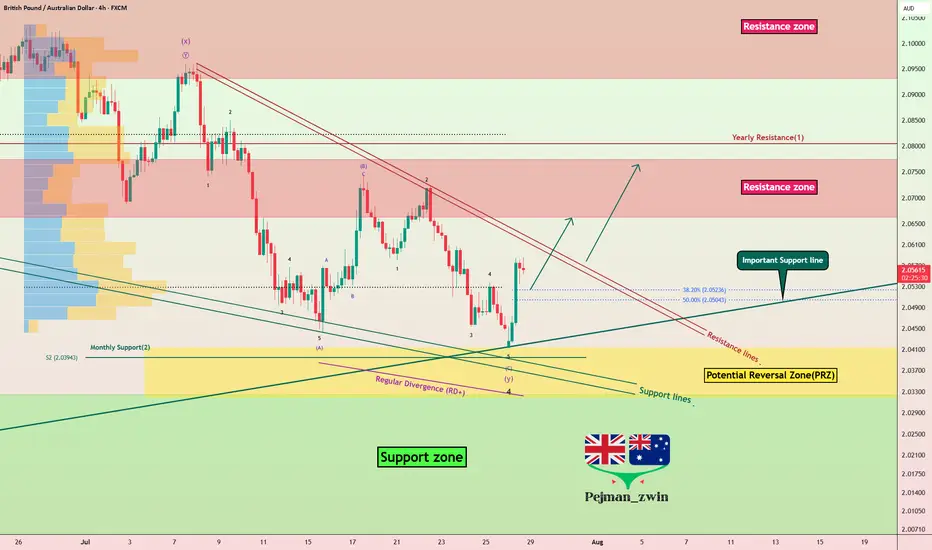
GBPAUD Reverses from Key Zone – Long Setup in Play!Today I want to share with you a Long position on GBPAUD ( OANDA:GBPAUD ).
GBPAUD started to rise well from the Important Support line , Support zone(2.032 AUD-1.987 AUD) , and Potential Reversal Zone(PRZ) and managed to close the 4-hour candle above 2.053 AUD (important) .
In terms of Elliott wave theory , GBPAUD seems to have completed the main wave 4 . The main wave 4 structure was a Double Three Correction(WXY) .
Also, along the way, we can see a Bullish Marubozu candle , which could indicate a continuation of the uptrend .
I expect GBPAUD to break the Resistance lines soon and attack the Resistance zone(2.078 AUD-2.066 AUD) .
First Target: 2.065 AUD
Second Target: 2.076 AUD
Note: Stop Loss(SL): 2.040 =Worst SL
Please respect each other's ideas and express them politely if you agree or disagree.
British Pound/ Australian Dollar Analyze (GBPAUD), 4-hour time frame.
Be sure to follow the updated ideas.
Do not forget to put a Stop loss for your positions (For every position you want to open).
Please follow your strategy and updates; this is just my Idea, and I will gladly see your ideas in this post.
Please do not forget the ✅' like '✅ button 🙏😊 & Share it with your friends; thanks, and Trade safe.
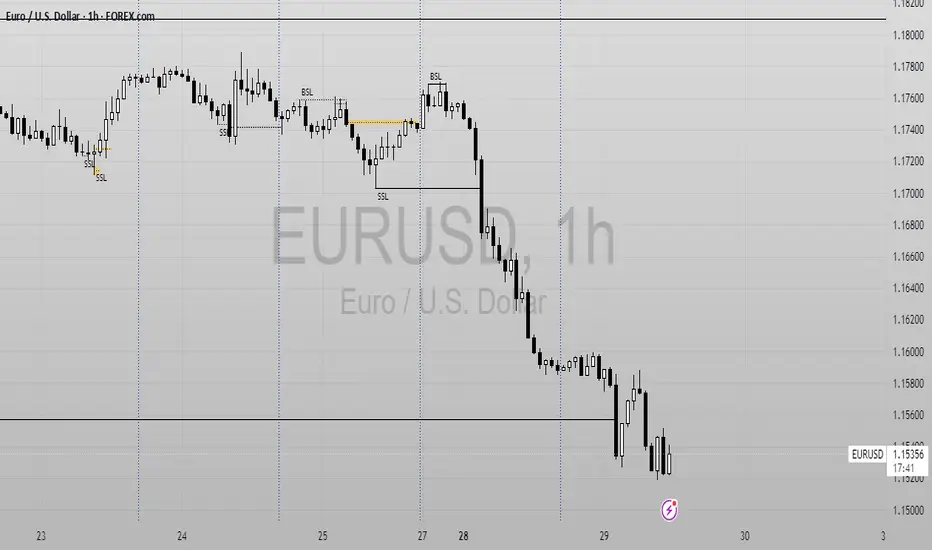
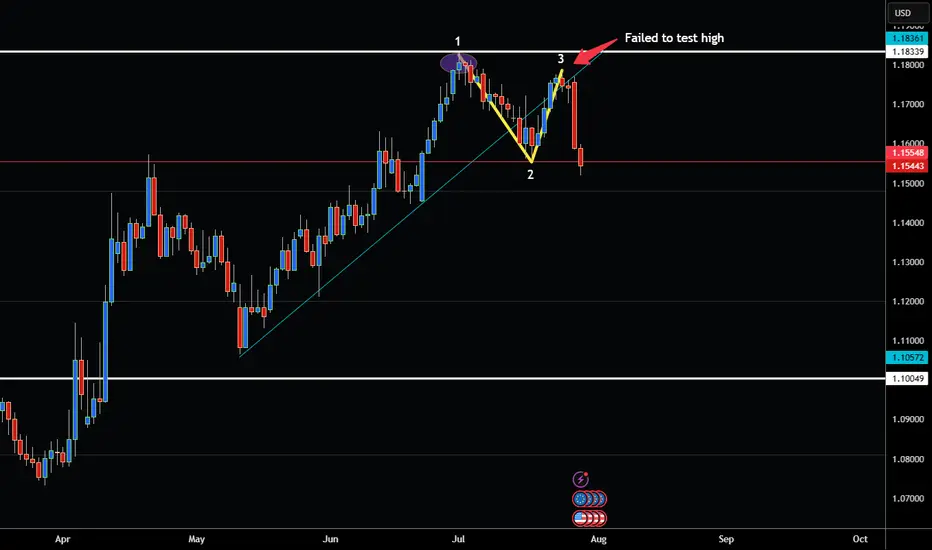
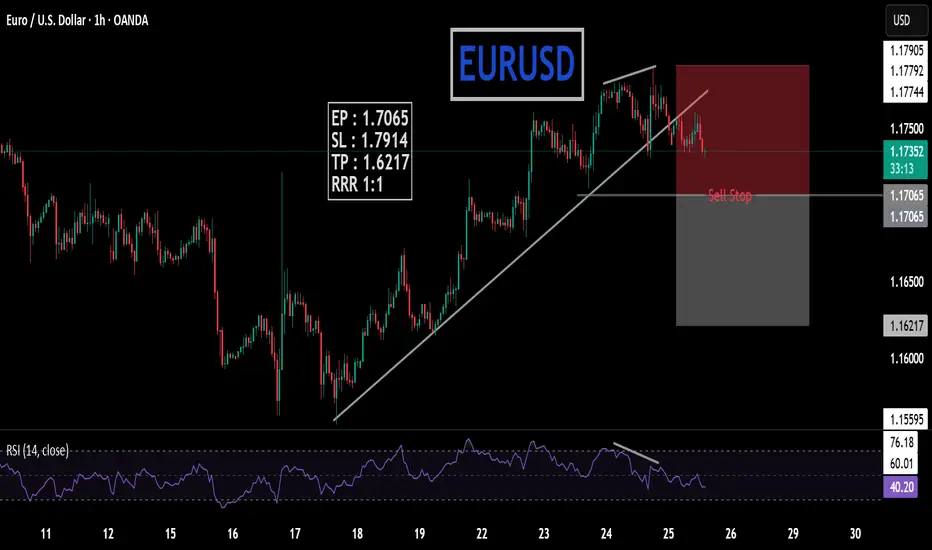
EUR/USD SHOWING SIGNS OF WEAKNESS AND NEW TOP FORMATION!Hey traders so looking at the EUR/USD today and wow what a difference a day makes!
Just the other day I was Bullish this pair and was reccommending buying on pullback. All of sudden in the blink of an eye market completely flips over on a dime due to tariffs. Thats life in the big city of trading. 😁
If you are new to trading remember this you can't ever lose by taking profits. No matter how large or how small which is why in the last post I reccommended moving that stop up to 3 days behind the market because as you can see the market is unpredictable.
Ok so where does that leave us now well as a technical analyst I look for trading the trend or changes in the trend and now that I see what is a completed 123 top formation on the Euro. That is a significant sign that the market has almost changed from uptrend to downtrend imo. Look at the resistance 1.1833 then look at the failed rally that only made it to 1.1783 that is a sign that a top has now formed.
Therefore if the US Dollar is bottoming I would not reccommend EUR/USD longs anymore. So I am watching for a break below support at 1.1500. If market can close below that level on a daily close. Then I would look to sell the a rally back to resistance.
However if bullish would not consider buying unless market breaks above resistance at 1.1833 that way you know for sure the trend has resumed!
Good Luck & Always use Risk Management!
(Just in we are wrong in our analysis most experts recommend never to risk more than 2% of your account equity on any given trade.)
Hope This Helps Your Trading 😃
Clifford
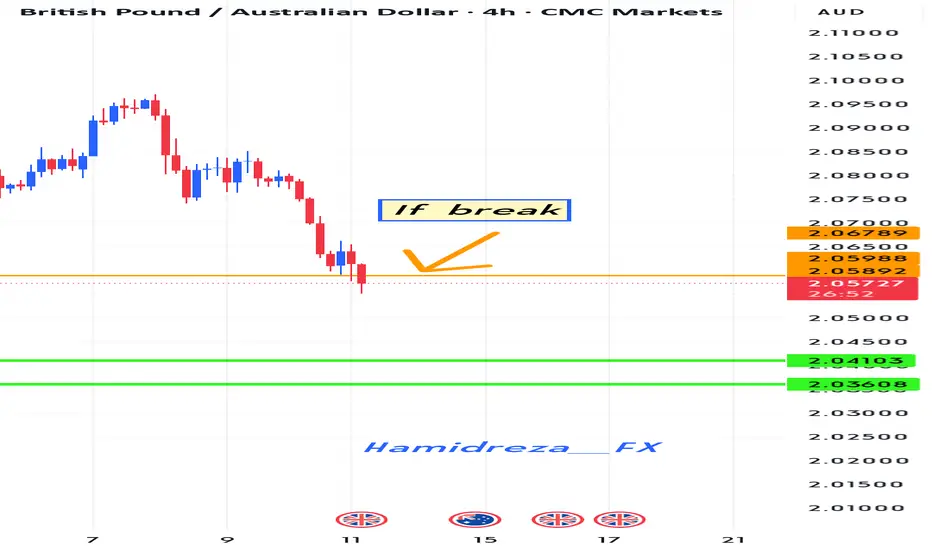
Is the currency GBPAUD depreciating?
Hi dears
I think that if the colored trend line is broken, the downtrend will probably continue until it reaches the target.
Thank you for supporting me by liking, commenting, and subscribing.
USDCHF Signals Wave 3 With Double Bottom!OANDA:USDCHF has not only formed a Double Bottom Pattern but also may be generating a potential Elliot Impulse Wave!
Bulls are giving the April & June Lows of .8038 - .8088, another go for a second time today after surpassing the first attempted High created July 17th to break above the level.
So far Price today has broken above July 17th Highs and if Bulls are able to hold this level, this would Confirm:
1) A Breakout of the Double Bottom
2) Wave 3 continuing the Impulse Wave in the Elliot Wave Theory!
The Higher Low @ .79106 created on July 25th, broke the downtrend structure as a 78.6% retracement of the Lower Low @ .78719 created July 1st which was a new 14 Year Low, finishing Wave 2 and initiating Wave 3 of the Impulse Wave.
The Extension of Wave 3 typically will end at the 1.236% or 1.618% level which gives us 2 potential Price Targets to start:
Price Target 1) .81479 - 1.236%
Price Target 2) .82213 - 1.618%
Once Wave 3 has ended, we will look for opportunities at the Wave 4 - Wave 5 juncture!

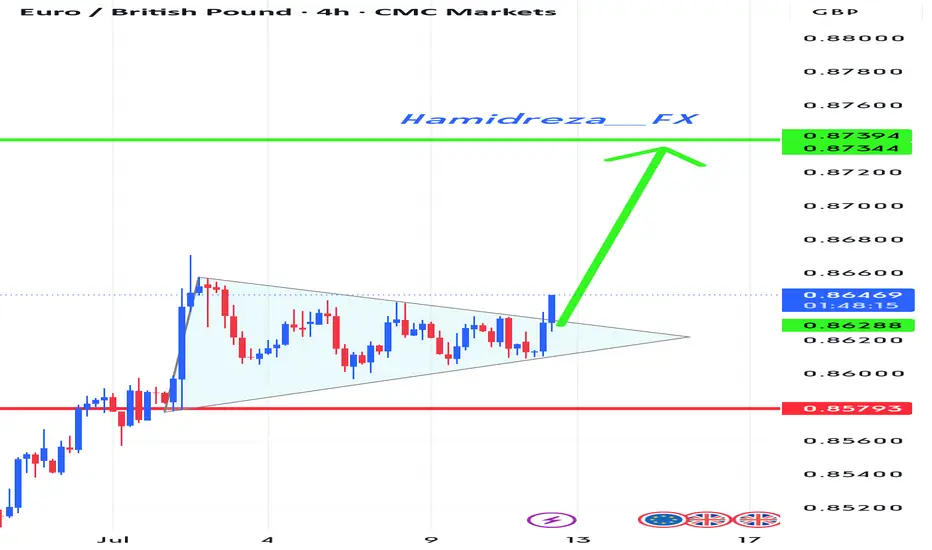
Do you agree with a big profit in EURGBP?Hi my dears
The pattern seems to be broken, so let's go up.
Join me with a guaranteed profit.
If you liked my analysis, please support my page.
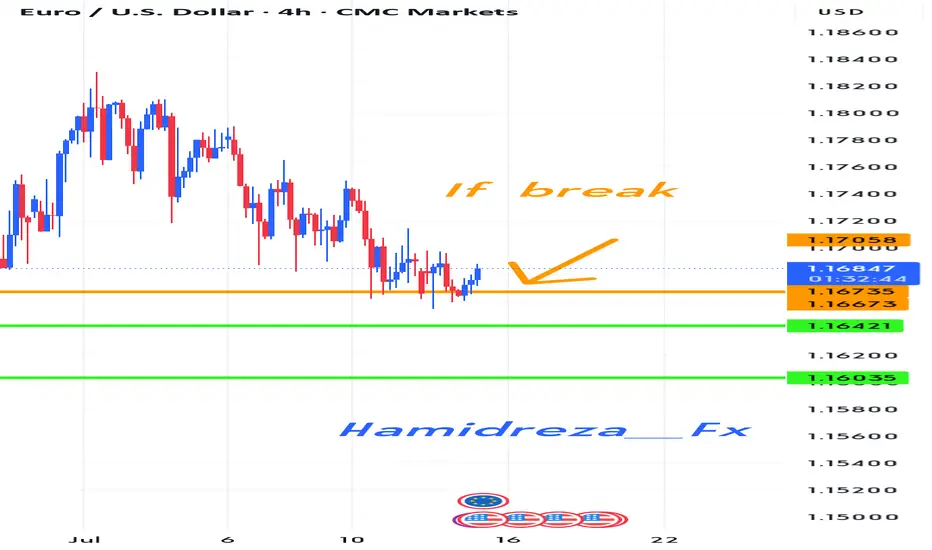
Could something similar happen to the EURUSD?
Hi everyone
We are in a state of downward suffering
This state of suffering seems to continue
Of course, there is a condition that if the condition is met, we will probably see the first and second goals.
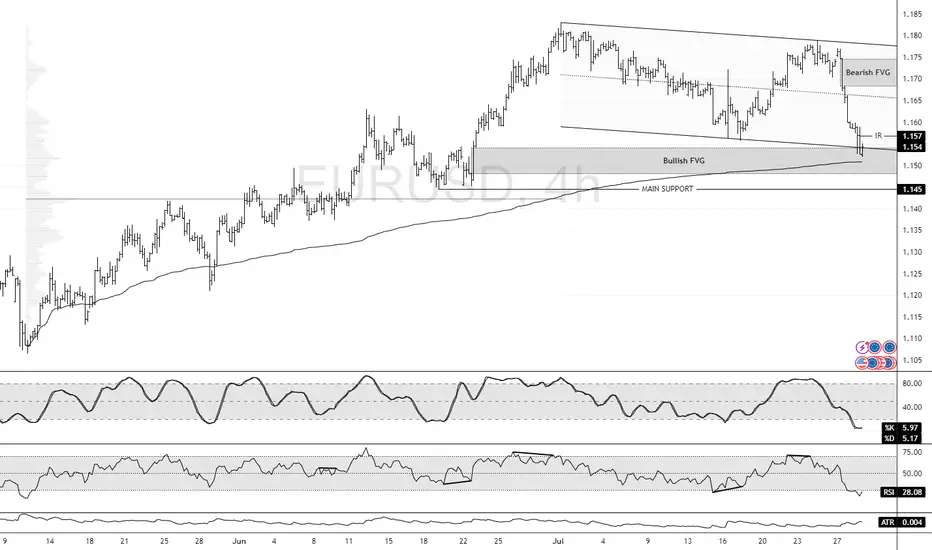
EUR/USD at Discount Level: Bullish Setup in FocusFenzoFx—EUR/USD bearish momentum extended to $1.154, the lower line of the flag. This is a support area backed by the Bullish FVG.
The immediate resistance is at $1.157. From a technical perspective, a close above this level can trigger an uptrend, targeting the bearish FVG at approximately $1.170 to $1.175.
Please note that the bullish outlook should be invalidated if EUR/USD falls below the main support level at $1.145.
GBPCADI’m anticipating a price bounce on the daily level (higher timeframe), which looks like a solid buy opportunity to the upside.

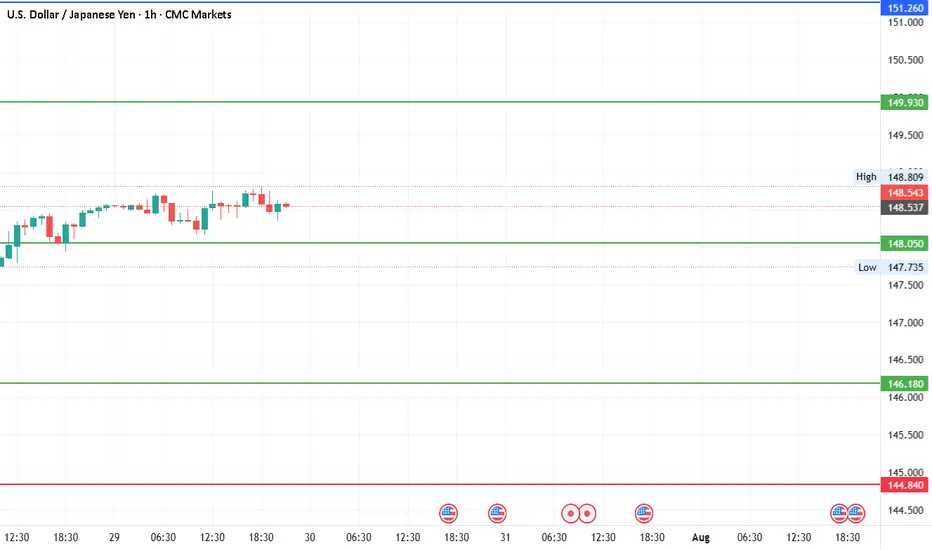
#USDJPYDate: 29-07-2025
#USDJPY Current Price: 148.53
Pivot Point: 148.049 Support: 146.177 Resistance: 149.932
Upside Targets:
Target 1: 151.264
Target 2: 152.597
Target 3: 154.303
Target 4: 156.008
Downside Targets:
Target 1: 144.839
Target 2: 143.501
Target 3: 141.796
Target 4: 140.090
#TradingView #Stocks #Equities #StockMarket #Investing #Trading #Forex
#TechnicalAnalysis #StockCharts #Currency
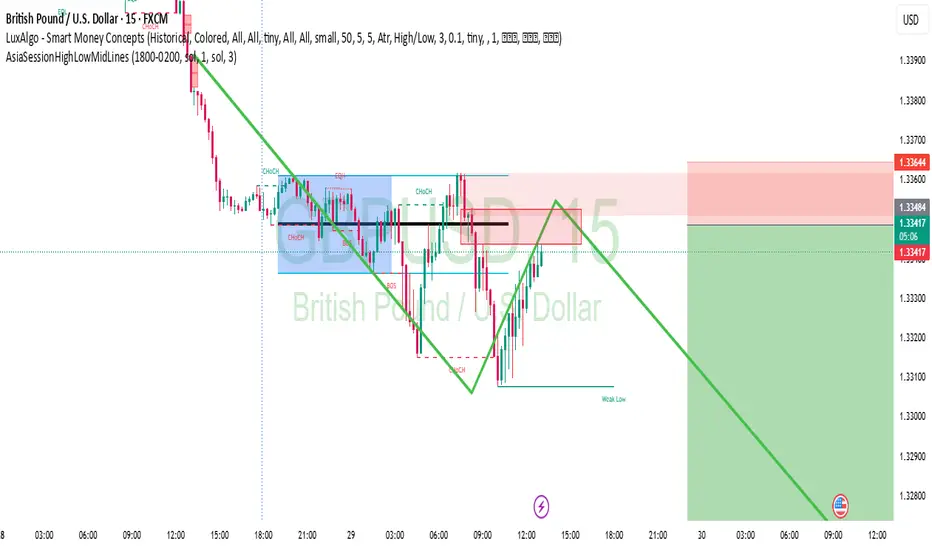
we have control in new area short GBPUSDwe have control in new area short GBPUSD, for retest to Asian low, and maybe take control liquidity.
Thanks un advance for keep positions
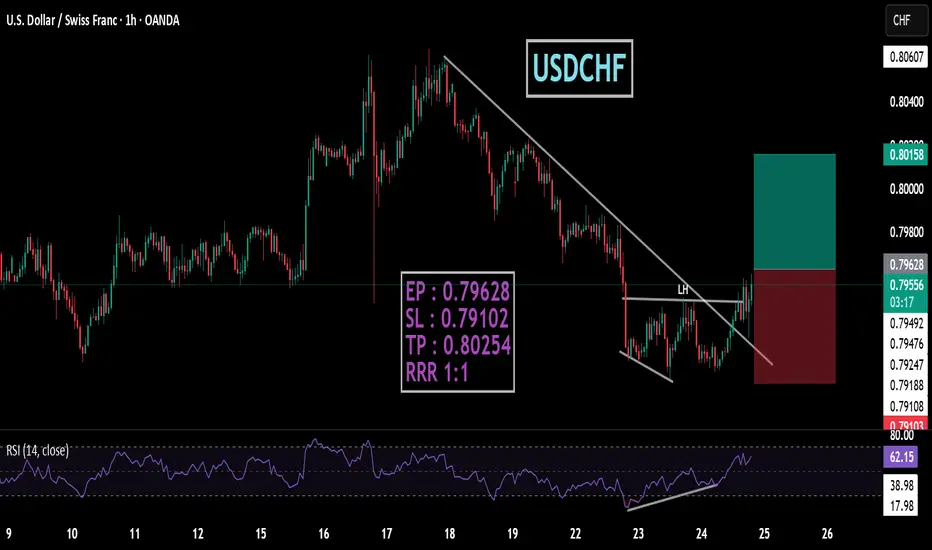
USDCHFtrendline breakout also divergence break last LH
EP : 0.79628
SL : 0.79102
TP : 0.80254
RRR 1:1
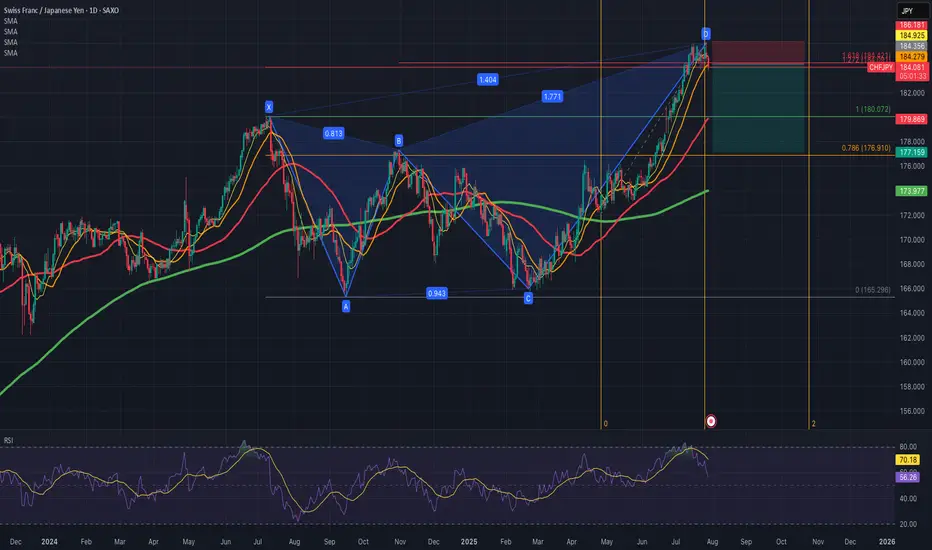
CHFJPY - Bearish Butterfly Pattern - Price got to the D point of the Bearish Butterfly Pattern
- Price crossed SMA10 and and is now testing SMA20
- JP10Y-CH10Y spread keeps going up and reached 1.2% now
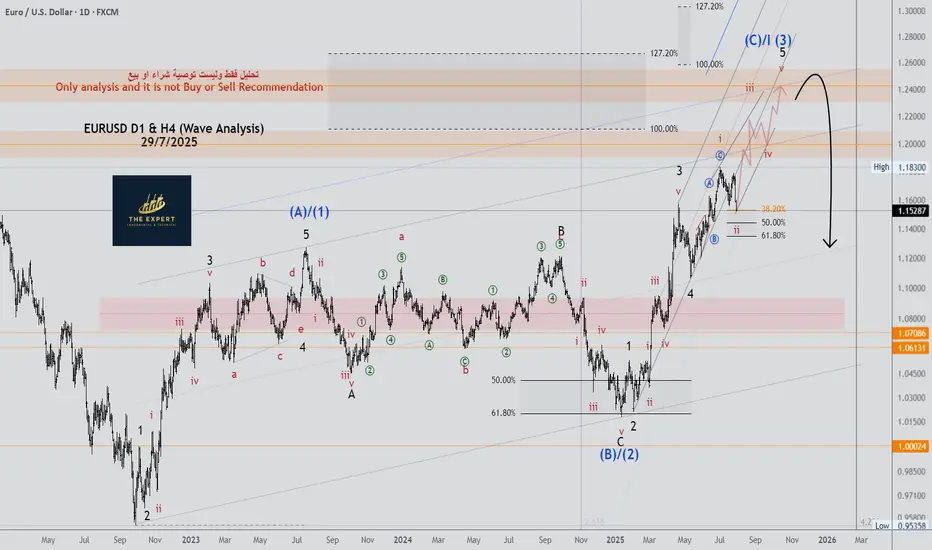
EURUSD D1 & H4 (Wave Analysis) - 29/7/2025EURUSD D1 & H4 (Wave Analysis) - 29/7/2025
please see the chart
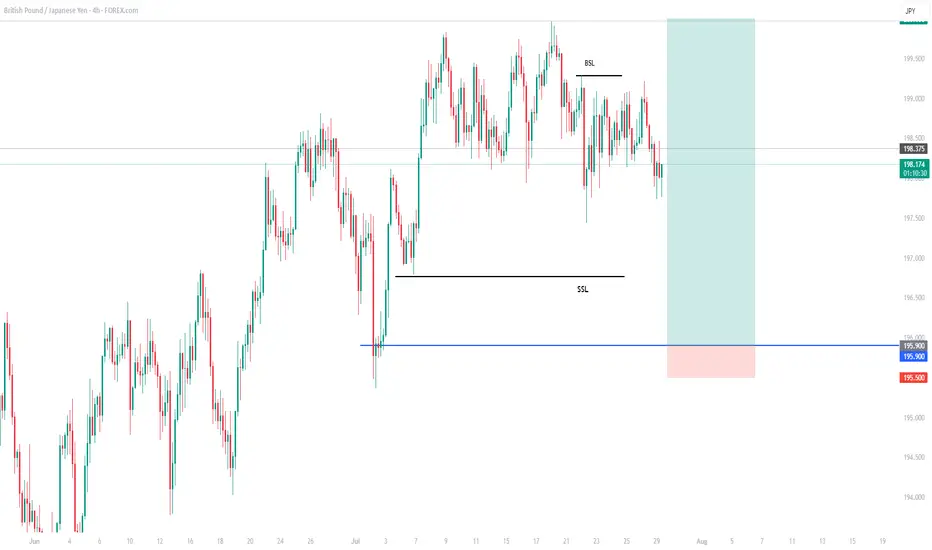
GBPJPY BUY SETUPGBPJPY is bullish on the daily timeframe and is currently retracing to continue buying. I want to see structural liquidity taken and tap my entry before continuing to the upside.
About to Buy AUDUSD waiting for retracementAfter retracing, put stop below wick and only buy if the candle closes
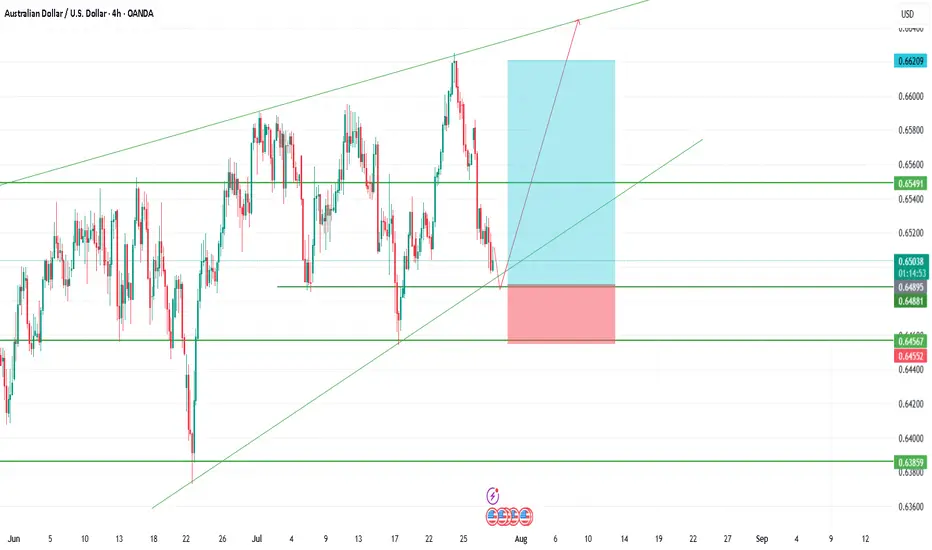
Where to next for EURUSD? With Monday's opening, we saw price sell off at a great force and attacked the previous week's low, taking it out, with short term liquidity taken, will price reverse and start moving up or is there no end in sight for this bearishness?