Forex market
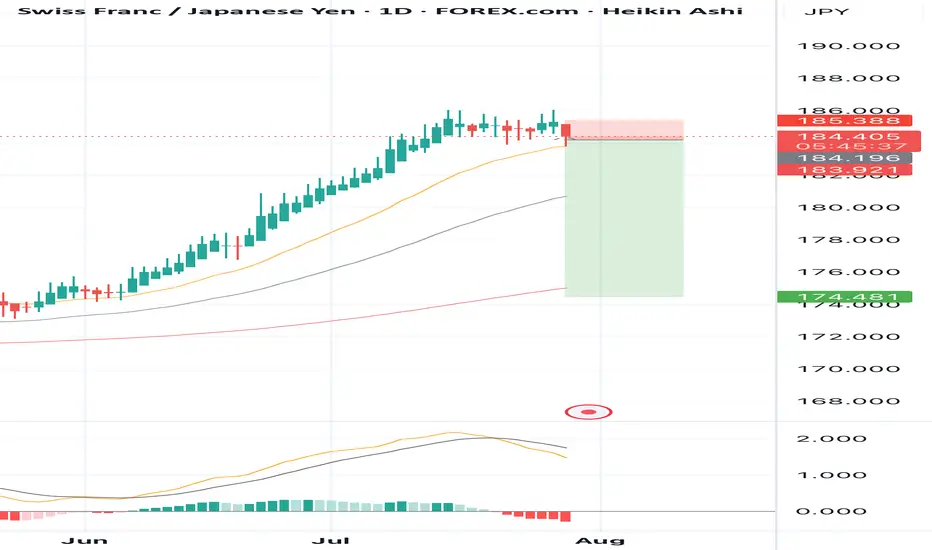
SELL CHFJPY for bullish trend reversal SELL CHFJPY for bullish trend reversal
STOP LOSS : 185.38
Trade trade is based on false breakout and divergence.....
First what is false breakout, A false breakout in Forex occurs when the price breaks through a key level (like support or resistance) but quickly reverses and returns to its original range, often trapping traders who were expecting a continuation of the breakout. It's essentially a false signal, indicating a potential trend reversal or continuation, but the price doesn't follow through....
Secondly what is divergence ,In forex trading, divergence occurs when the price of a currency pair moves in one direction, while a technical indicator (like an oscillator) moves in the opposite direction. This mismatch can signal a potential trend reversal or weakening trend. There are two main types: bullish and bearish divergence.
On this trade we are taking it because we saw regular bearish divergence
Regular Bearish Divergence
In case of Regular Bearish Divergence:
* The Indicator shows Lower Highs
* Actual Market Price shows Higher Highs
We can see a strong divergence on the RSI already and There is a strong trend reversal on the daily time frame chart.....
The daily time frame is showing strength of trend reversal from this level resistance so we are looking for the trend reversal and correction push from here .....
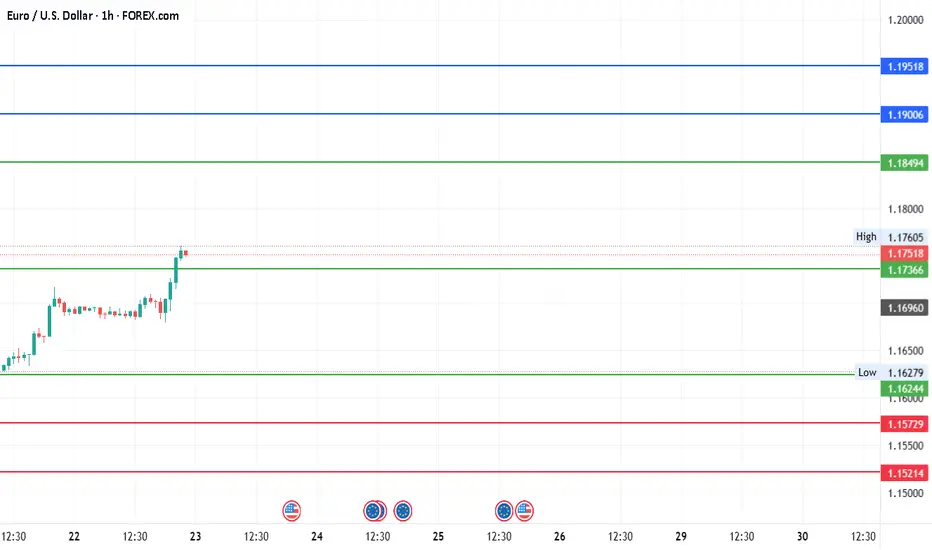
#EURUSD - Pivot Point is 1.174Date: 22-07-2025
#EURUSD - Current Price: 1.175
Pivot Point: 1.174 Support: 1.162 Resistance: 1.185
Upside Targets:
Target 1: 1.190
Target 2: 1.195
Target 3: 1.203
Target 4: 1.211
Downside Targets:
Target 1: 1.157
Target 2: 1.152
Target 3: 1.144
Target 4: 1.136
#TradingView #Forex #Currency #StockMarket #Investing #Trading #EURUSD
#TechnicalAnalysis #SotockCharts #Finance
#PivotPoints #SupportResistance
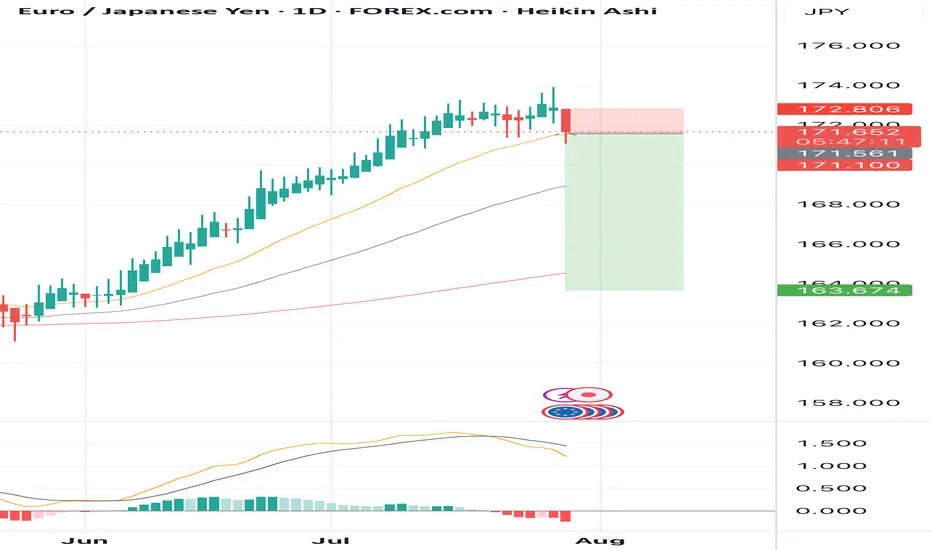
SELL EURJPY for bullish trend reversal SELL EURJPY for bullish trend reversal
STOP LOSS : 172.80
Trade trade is based on false breakout and divergence.....
First what is false breakout, A false breakout in Forex occurs when the price breaks through a key level (like support or resistance) but quickly reverses and returns to its original range, often trapping traders who were expecting a continuation of the breakout. It's essentially a false signal, indicating a potential trend reversal or continuation, but the price doesn't follow through....
Secondly what is divergence ,In forex trading, divergence occurs when the price of a currency pair moves in one direction, while a technical indicator (like an oscillator) moves in the opposite direction. This mismatch can signal a potential trend reversal or weakening trend. There are two main types: bullish and bearish divergence.
On this trade we are taking it because we saw regular bearish divergence
Regular Bearish Divergence
In case of Regular Bearish Divergence:
* The Indicator shows Lower Highs
* Actual Market Price shows Higher Highs
We can see a strong divergence on the RSI already and There is a strong trend reversal on the daily time frame chart.....
The daily time frame is showing strength of trend reversal from this level resistance so we are looking for the trend reversal and correction push from here .....
EURNZD Update: This short trigger could spark a waterfall dropYo traders, Skeptic from Skeptic Lab! 🩵 EURNZD just broke its daily upward trendline, setting up a sharp drop. Weekly shows a fading uptrend. Daily’s got a strong bearish candle, full body, no buyer fight. 4H trendline broke and... more on this video:)
👀Beware of fakeouts this week—volatility’s high! Trade smart, keep risk tight, and don’t FOMO. Share your thoughts in the comments, boost if it helps <3

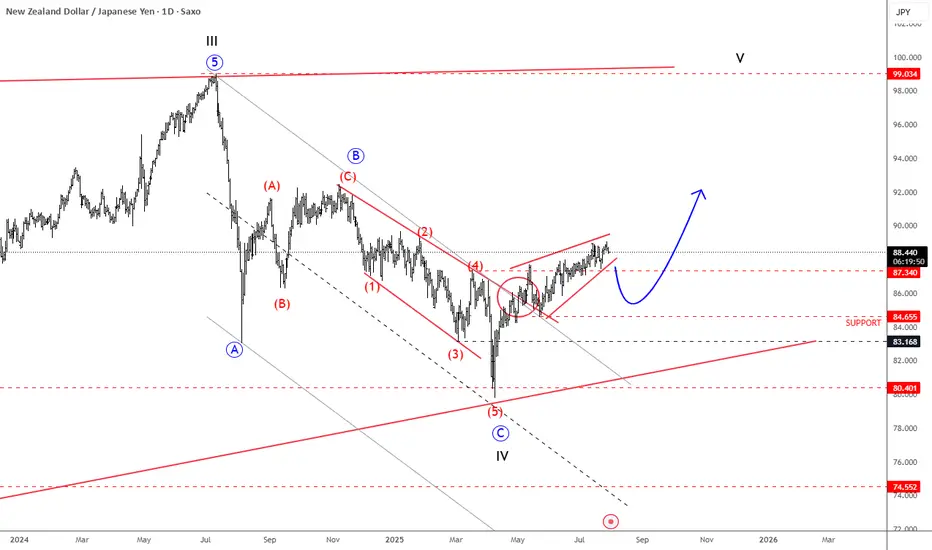
NZDJPY Is Back To Bullish ModeNZDJPY Is Back To Bullish Mode from technical and Elliott wave perspective, as we see it breaking back above trendline after a corrective decline.
NZDJPY is nicely recovering over the last few weeks after a strong rebound from 80.40 support, a key level going back to March 2023. Notice that it’s recovering after a three-wave ABC corrective decline that belongs to a higher degree wave IV correction. Current recovery looks to be in five waves, as a leading diagonal; so its a motive wave structure that already pushed above the 87.34 resistance, which is a strong bullish signal, suggesting more upside ahead. Of course, short-term pullbacks are always possible and welcome, and in that case, the 86 – 84 area could act as a nice support. But overall, we think that sooner or later the pair will target the 90 or even 92 levels, which are still possible this year. Wave V is eyeing even 100 area.
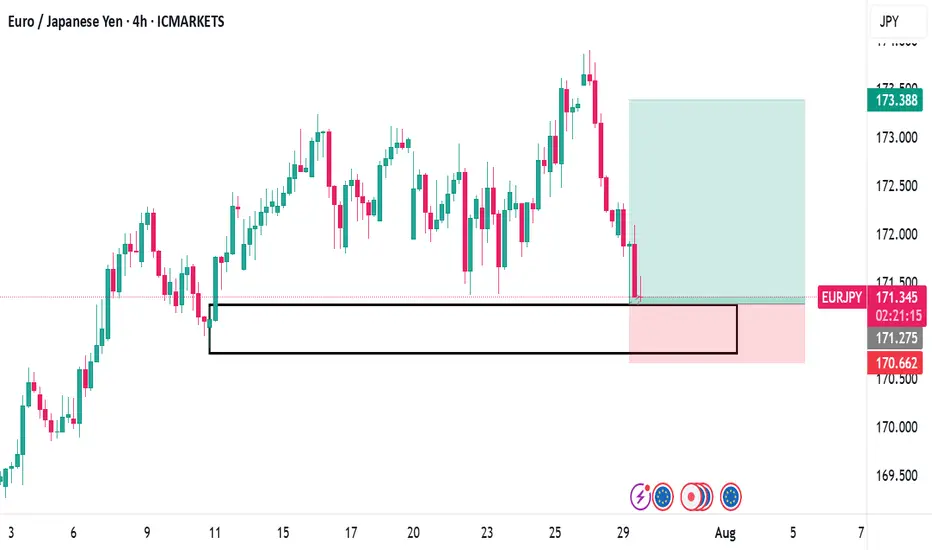
demand zone spottedEUR/JPY – Bullish Rejection from Demand Zone | 4H Smart Money Setup
Pair: EUR/JPY
Timeframe: 4H (4-Hour)
Bias: Bullish
Status: Trade Active
Strategy: Demand Zone Rejection / Smart Money Concepts (SMC)
Market Context
EUR/JPY has been in a broader uptrend with higher highs and higher lows throughout July. Recently, the market retraced and tapped into a clearly defined demand zone, showing bullish rejection—a potential opportunity for long entries.
Key Technical Highlights
• Demand Zone marked around 170.65 – 171.30
o Formed by previous accumulation before the last strong impulsive bullish leg.
o This zone acts as institutional support, where large buy orders may reside.
o Price wicked into the zone and printed a bullish candle, suggesting buyer interest.
• Risk-Reward Structure
o Entry: ~171.33 (current price action after bounce)
o Stop Loss: Below demand zone (~170.66)
o Take Profit: 173.38 (previous high / clean traffic zone)
• The position is marked on chart with a clear long setup:
o Green zone = Target
o Red zone = Risk
o Trade offers a favorable Risk:Reward > 2:1
Scenarios
Bullish Continuation
• Price continues upward respecting demand zone.
• Confirmation from bullish price action or break of lower highs (structure shift).
• Clean targets above at 173.00 – 173.40.
•
Bearish Invalidity
• Price closes below 170.65 on a 4H candle.
• Break of demand invalidates the setup.
• Next potential support lies lower near 169.80.
Trade Plan Summary
Component Value
Entry 171.33
Stop Loss 170.66
Take Profit 173.38
R:R Ratio ~2.5:1
Status Active, Waiting for Follow-through
Conclusion
EUR/JPY is showing a clean rejection from a strong 4H demand zone after a healthy pullback. Structure still supports a bullish continuation, and the trade is positioned with tight risk and strong upside potential. Monitoring for confirmation via momentum and market structure.
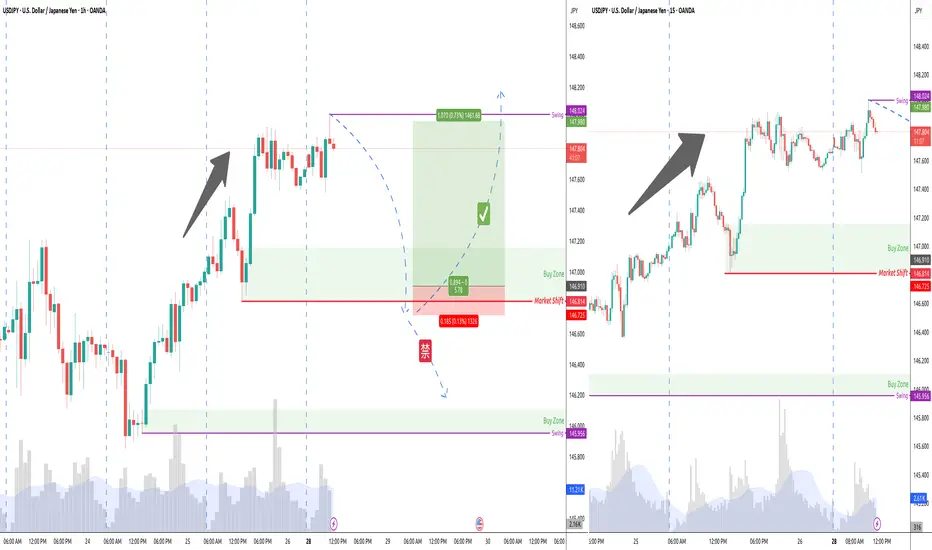
USDJPY 60/15 Pullback LongOverall bull trend. Waiting for pullback. If it pass the market shift and stay below, no go. Else will wait for long singal to go long.
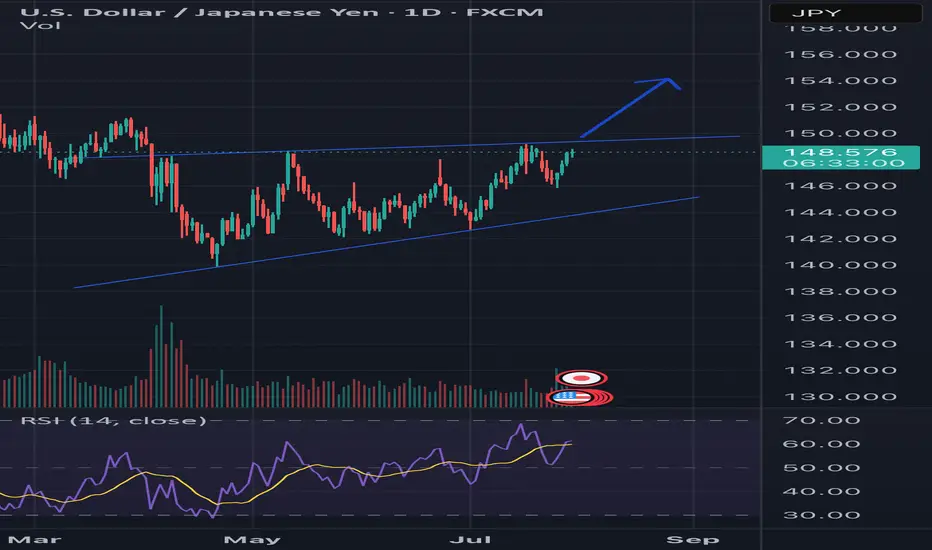
USDJPY Rising wedge on FX:USDJPY pair
Key level to watch is 150 where multiple failed breakout attempts were recorded.
Confirmed breakout will push price to 152-156
EURUSD BUYEUR/USD retreats below 1.1550 ahead of US data
EUR/USD finds it difficult to stage a rebound following Monday's sharp decline and trades in negative territory below 1.1550 on Tuesday. The US Dollar (USD) preserves its strength ahead of consumer sentiment and employment-related data releases, weighing on the pair.
From a technical point of view, the EUR/USD pair is poised to extend its slump. It keeps falling below a mildly bearish 20 Simple Moving Average (SMA), which provides dynamic resistance at around 1.1690. The 100 SMA, in the meantime, maintains its bullish slope, albeit partially losing its upward strength at around 1.1340. Finally, technical indicators keep heading south well below their midlines, and at multi-week lows, in line with a bearish extension ahead.
The near-term picture shows EUR/USD is oversold and may bounce or consolidate before the next directional move. In the 4-hour chart, technical indicators turned flat at extreme levels, yet it keeps developing below all its moving averages, which skews the risk to the downside. A firmly bearish 20 SMA is crossing below the 100 SMA and aims to extend its slide below a directionless 200 SMA, usually a sign of prevalent selling interest.
SUPPORT 1.15566
SUPPORT 1.15819
SUPPORT 1.15566
RESISTANCE 1.15114

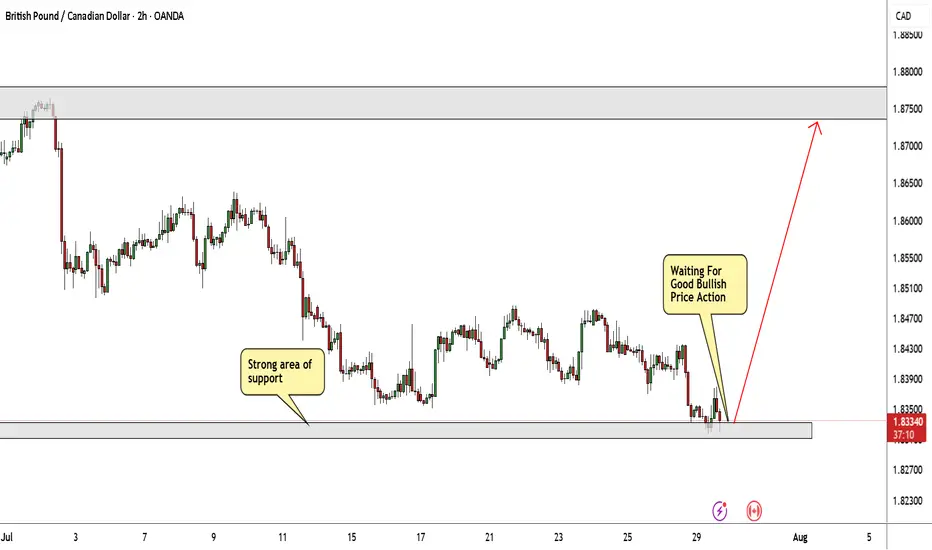
GBP/CAD Possible Buy Trade With Great Pips!The price is standing at a strong area of support that is a historical area of support and pushed the price multiple. I think it can be a great area to enter a buy trade but I have 2 conditions to enter this trade:
1- great bullish price action above an area of support.
2- if we have a daily closure below this area of support this trade will be canceled.
I will commit to these conditions and see what will happen.
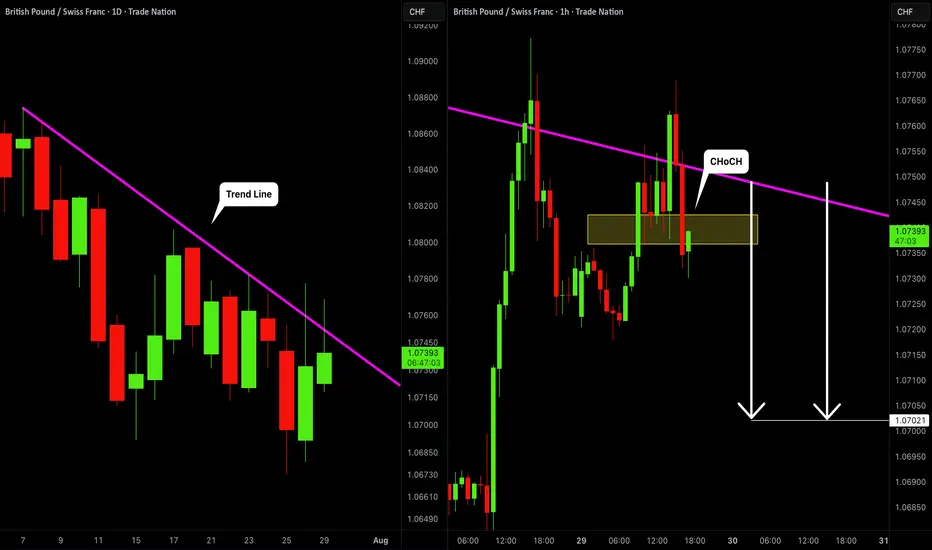
GBPCHF: Bearish Movement Confirmed 🇬🇧🇨🇭
GBPCHF looks bearish after the news today.
The price tested a solid rising trend line on a daily
and formed a confirmed bearish Change of Character
on an hourly time frame.
I think that the price will continue falling and reach 1.0702 level.
❤️Please, support my work with like, thank you!❤️
I am part of Trade Nation's Influencer program and receive a monthly fee for using their TradingView charts in my analysis.
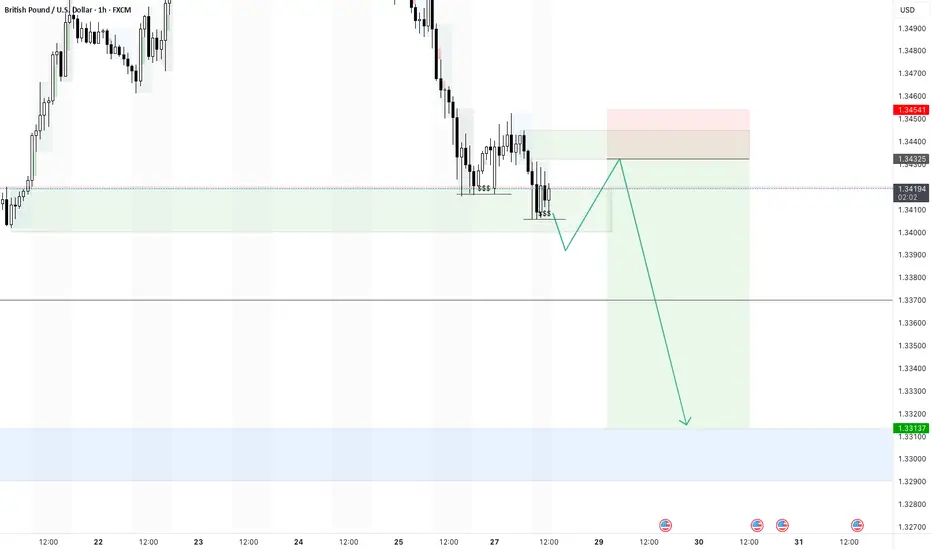
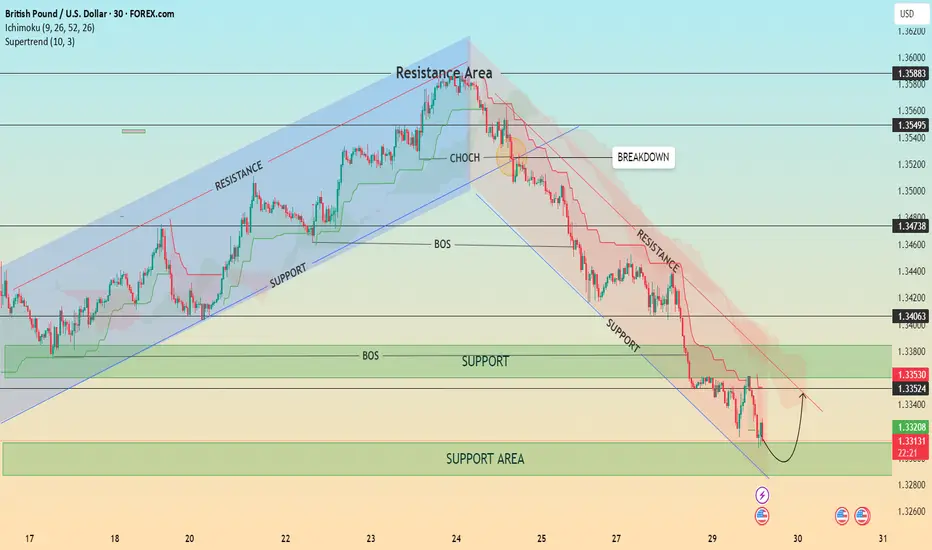
GBP/USD – Bearish Structure with Possible Short-Term Pullback📊 GBP/USD – Bearish Structure with Possible Short-Term Pullback
Timeframe: 30-Minute | Date: July 29, 2025
Price action recently broke down from a well-respected ascending channel, confirming a shift in market structure with a Change of Character (CHOCH) followed by a Break of Structure (BOS). Since then, GBP/USD has been respecting a descending trend channel, forming consistent lower highs and lower lows.
🔍 Current Setup:
Price is testing a major support area around 1.3300–1.3320.
A minor pullback is expected as indicated by the bullish wick rejections.
However, the overall bias remains bearish unless we break and hold above the 1.3353–1.3406 resistance zone and the descending trendline.
The Ichimoku Cloud and Supertrend both show bearish momentum.
📈 Potential Scenario:
Price may bounce from the support area and retest the upper boundary of the descending channel before resuming the bearish trend.
⚠️ Key Levels to Watch:
Resistance: 1.33530 / 1.34063 / 1.34738
Support: 1.33200 / 1.33000
💡 Structure Notes:
CHOCH = Trend Reversal Signal
BOS = Confirmation of Downtrend
Cloud = Dynamic Resistance
Sells for the week
***Confluences-(Waiting for the restest)***
Head and Shoulders Broken at Higher Time Frame
Weekly, Daily, 4Hr all bearish
Broke a Key Weekly Level at 1.43000
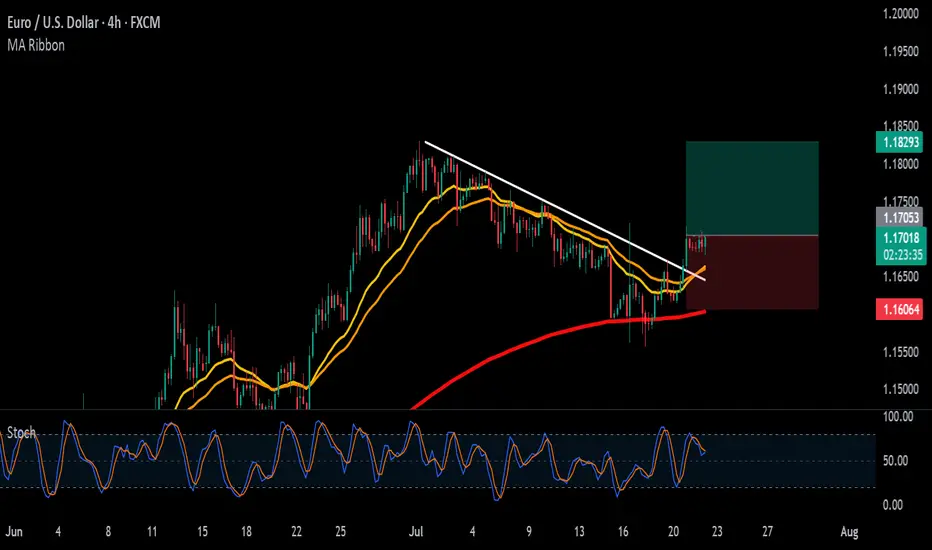
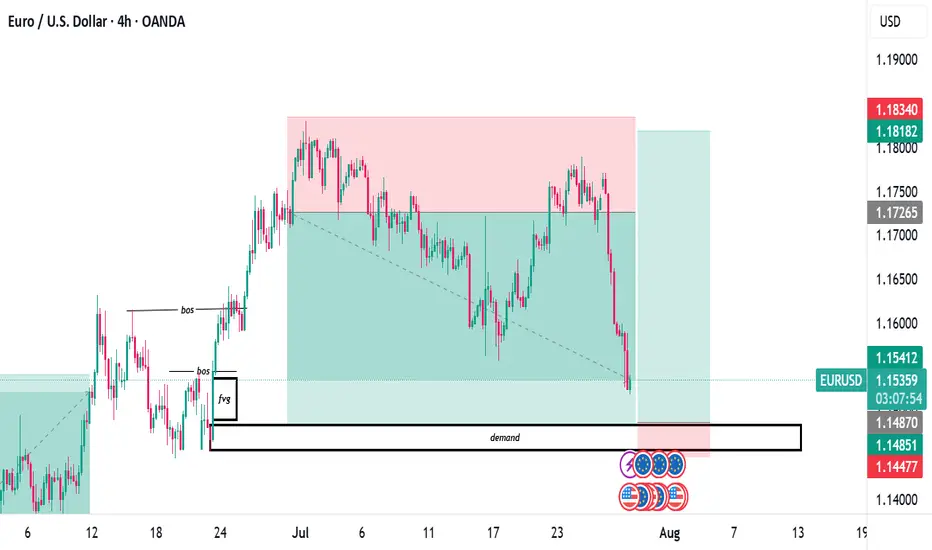
long position sighted on EURUSDEUR/USD – Price Approaching Key Demand Zone | 4H SMC Analysis
Pair: EUR/USD
Timeframe: 4H (4Hour)
Bias: Bullish Reversal Watch at Demand
Strategy: Smart Money Concepts (SMC)
Status: Monitoring price action at demand for possible long setup.
Market Structure Overview
The EUR/USD pair recently showed a bearish shift in structure after failing to hold the bullish trend that began mid-June.
* Initial bullish structure is visible with a clear Break of Structure (BOS) to the upside.
* The rally created a Fair Value Gap (FVG) and left behind a well-defined Demand Zone.
* After the BOS, price retraced and respected the demand before making new highs.
* Eventually, price failed to make a new high and started forming lower highs and lower lows, shifting momentum bearish.
Current Price Action
* Price has aggressively dropped from the previous supply area (highlighted in red) and is now approaching a key demand zone around 1.1485–1.1447.
* This zone coincides with:
* A previous FVG fill area.
* The base of the last strong impulsive move up.
* Consolidation and accumulation structure before the bullish breakout.
Key Zones
* Demand Zone: 1.1485 – 1.1447
* This zone represents an institutional buying area.
* Looking for potential bullish reaction from here.
* Supply Zone: Around 1.1818 – 1.1834
* Last zone of distribution before price dropped.
Possible Scenarios
Bullish Reversal
* Price shows rejection candles, internal bullish BOS, or engulfing pattern within demand.
* A long entry could be considered with:
* Stop Loss just below demand zone.
* Targets: Previous highs at 1.1726 and 1.1818.
Bearish Continuation
* If price breaks and closes below the demand, it invalidates the bullish idea.
* Expect continued bearish pressure toward 1.1400 or lower.
* Look for a potential retest of broken demand as new supply.
SMC Concepts in Use
* BOS (Break of Structure): Used to identify market shifts.
* FVG (Fair Value Gap): Spotting inefficiencies to anticipate retracements.
* Demand Zone: Watching for institutional buying and smart money footprints.
Trade Plan Summary
| Element | Value |
| Entry | Upon bullish confirmation in demand |
| Stop Loss | Below 1.1447 (zone invalidation) |
| Target 1 | 1.17265 |
| Target 2 | 1.18182 |
| Invalidated if | Price closes below demand zone |
Conclusion
We’re at a make or break level for EUR/USD. Price is testing a major demand zone with confluence from structure, FVG, and past bullish movement. Watching for reaction before taking action. Risk managed entries only.
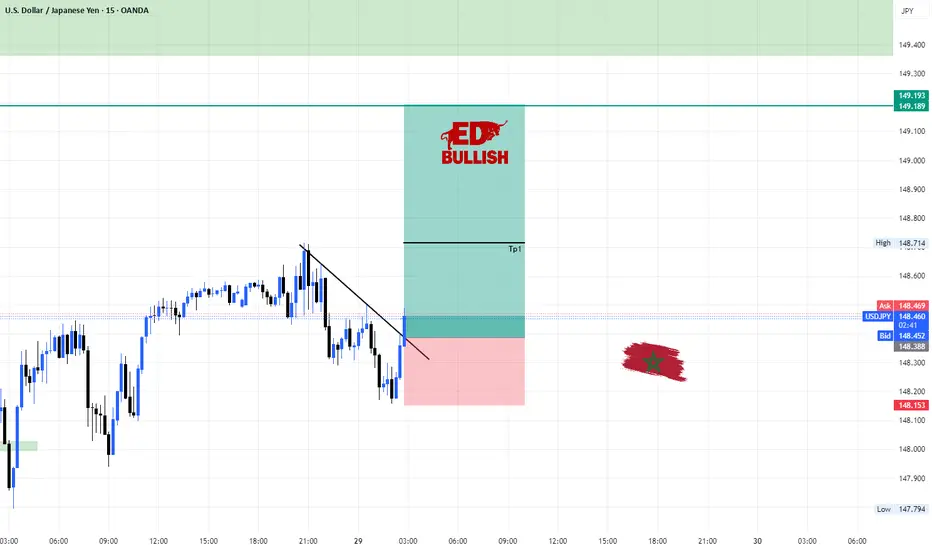
USDJPY long position 29/07/2025English : According to our analysis, we anticipate a bearish scenario.
Morocan Darija : kanchofo d'apres l'analyse dyalna antsanaw hboot
ATENTION : I only share my ideas, not signals
if TP1 hit i will move SL to BE
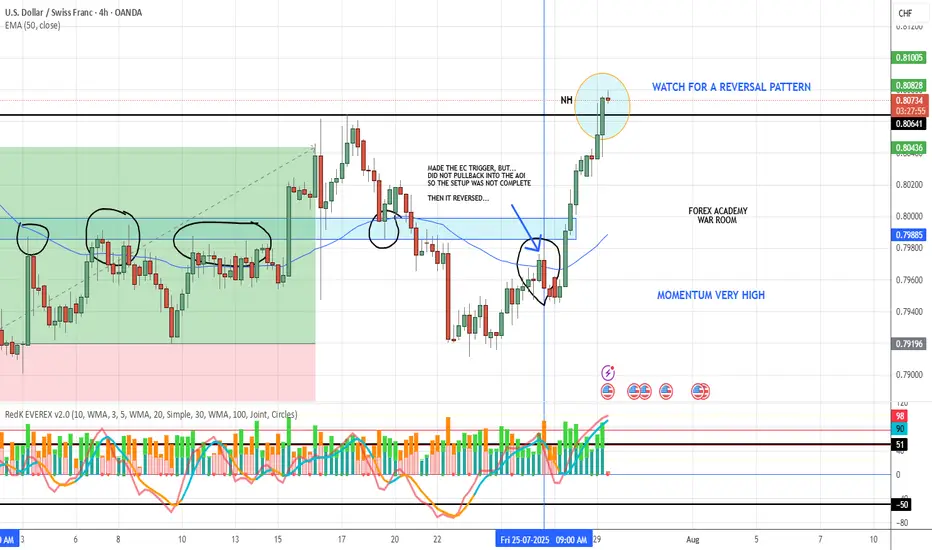
USD/CHF ADDED TO WATCHLISTWe are watching for a possible reversal setup to form because momentum is very high and might help price action make a correction. Using the VMS reversal strategy we will wait for a shooting star with an engulfing candle down confirmation, volume will need to be strong and momentum needs to be hooking down....all of this before we consider it as a trade. It looks promising. We will keep watching.
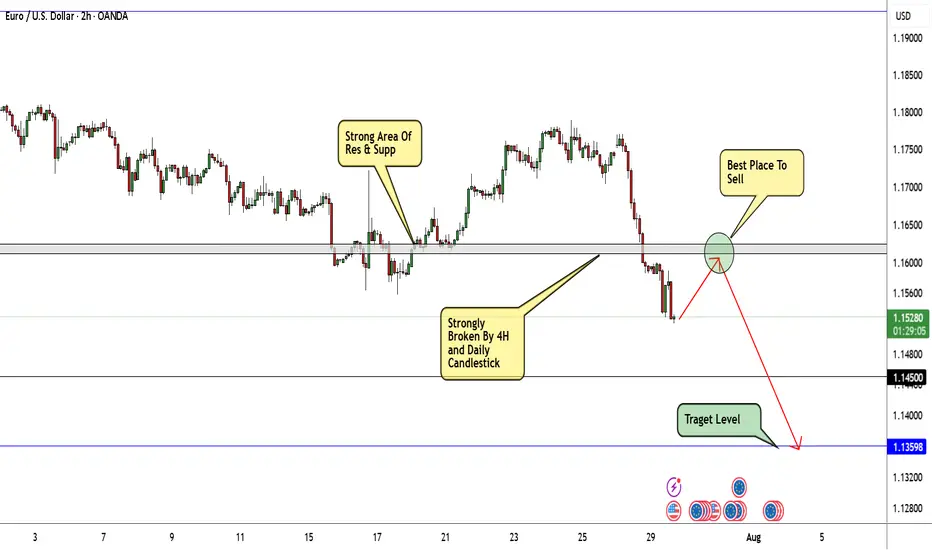
EUR/USD Will Continue Melting Be Sure To Be Part Of That!Here is my thought of EURUSD chart today. I think that this pair can go down further more specially after breaking this strong area of support and old resistance. as shown on the chart we can wait for the price to come back again and retest this area once and then this will be the best place to enter a sell trade. I am targeting around 250n pips in this trade. as I said I will wait for a retest and a good bearish price action and from there I will enter a sell trade.
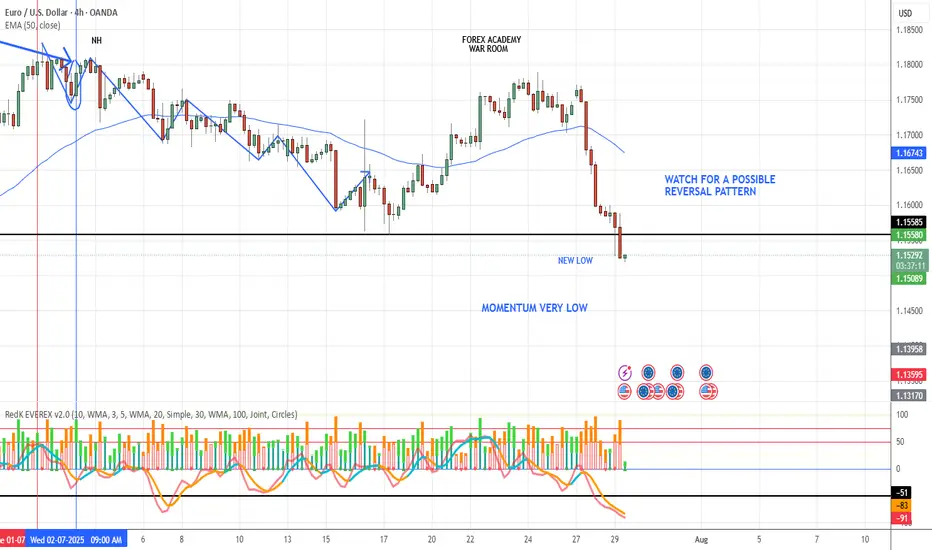
EUR/USD ADDED TO THE WATCHLISTPrice has fallen dramatically so we are on watch for a possible reversal (maybe short term) pattern to appear. Momentum is very low and looks prime to go up. We will need a hammer candle, with an engulfing confirmation candle, strong volume and in a best case scenario strong support to come off of. We will keep watching this one.
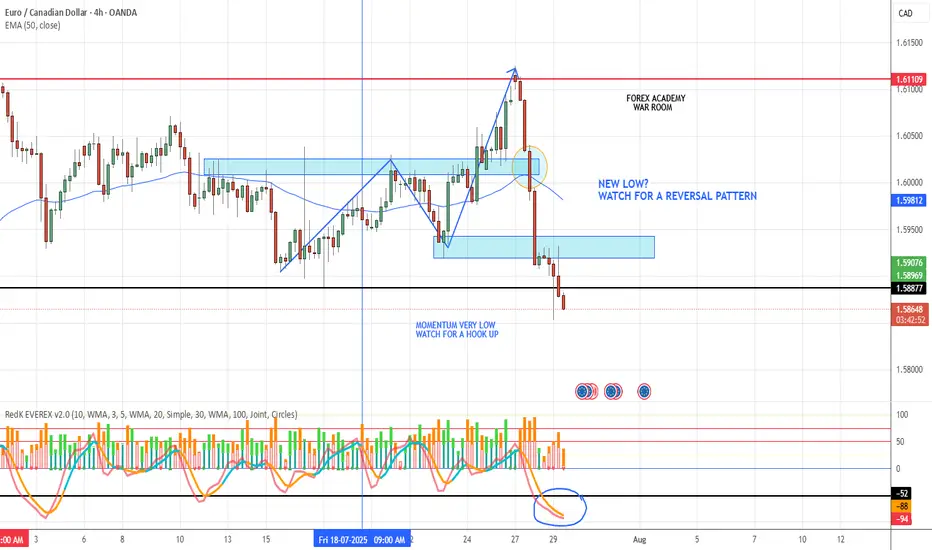
EUR/CAD ADDED TO WATCHLISTLike the other Euro markets this one is falling hard, we are watching for a possible reversal pattern to show up. Momentum is very low so we could see a rubber band effect here. Keep watching.
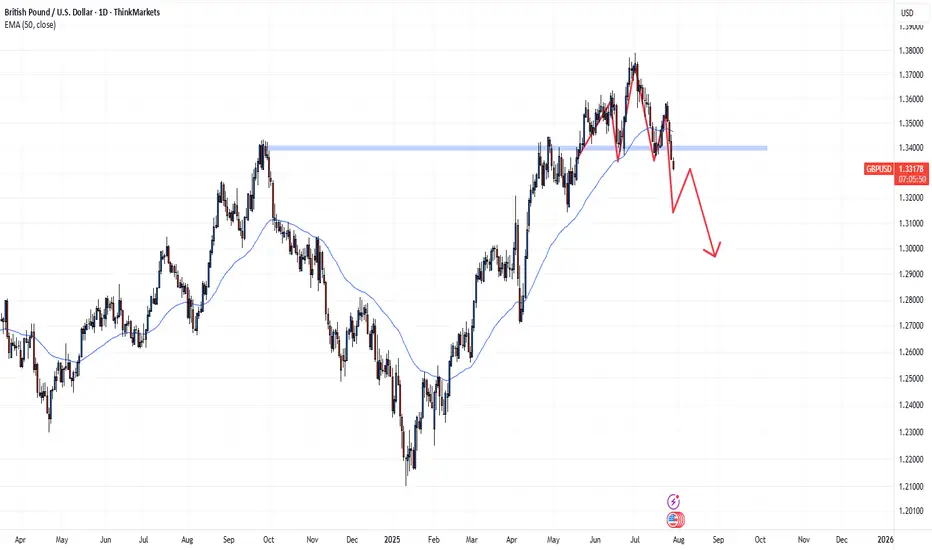
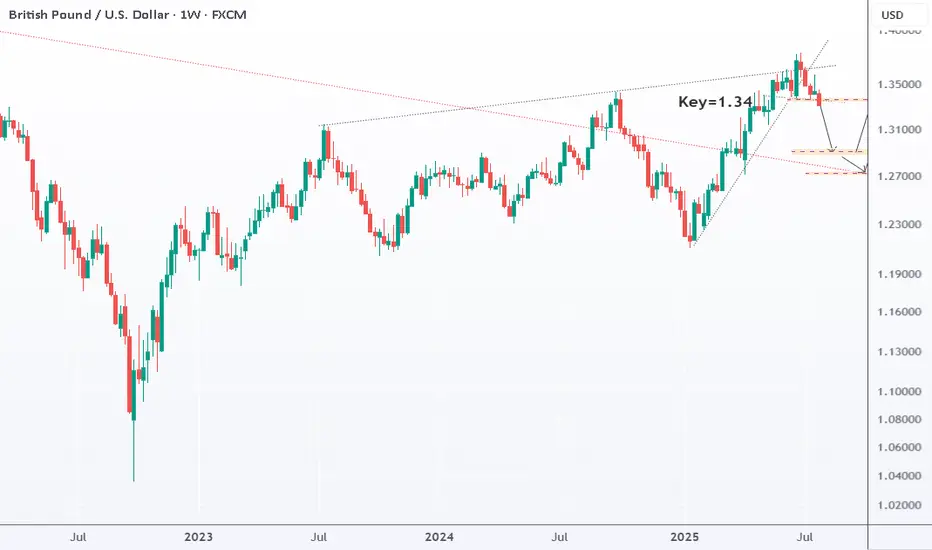
GBPUSD: Bearish toward 1.29 GBPUSD has broken below its recent uptrend and top structure. It’s now heading toward 1.29 and could drop as low as 1.273. That 1.273–1.29 zone is key — if it holds, we could see a new strong uptrend toward 1.40 and above. The bearish move stays in play as long as price remains below 1.34. But the bullish case also stays valid if price holds above 1.273.
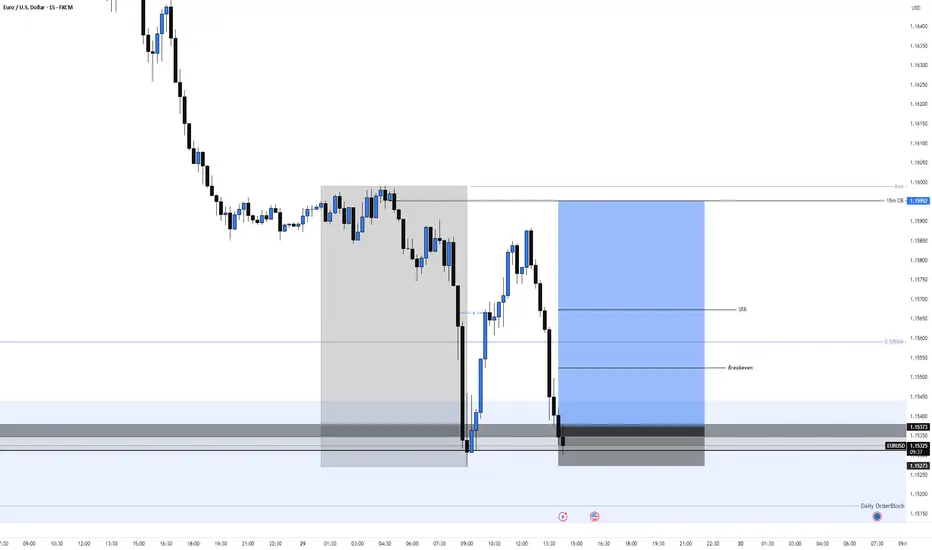
EURUSD Long, 29 JulyReversal Setup from Daily OB + LTF Confluence
Price tapped into a Daily Bullish OB with 50EMA support, signaling potential for a bullish reaction. While structure isn’t perfect, the overextension and DXY correlation offer strong intraday confluence.
📈 HTF Confluence:
✅ Sitting inside a Daily Bullish Orderblock
📍 50EMA in the same area → added support
🟢 Expecting a bounce from this zone, even if HTF trend isn’t clearly bullish yet
📉 LTF Context:
💤 Asia range formed, still unfilled → clean liquidity target
📉 Overextended bearish move into 15m POI
🪞 DXY at its own 15m POI + Asia range to complete → supports EU upside
🎯 Entry Plan:
✅ Clear 1m BOS after reacting from 15m Decisional OB
🎯 Entry taken at 5m OB inside that 15m POI zone
⚠️ Decisional OB isn’t ideal, but stacked confluences justify the risk
🛡 SL: Below 5m OB
📌 TP: Asia high + potential continuation if DXY breaks lower
GBPUSD - 28/7/25 - Bearish continuationI do have a bullish trade open current from this zone, but will move the SL to breakeven or take a small loss.
The new idea if the equal low liquidity is swept is to take a bearish trade as shown.