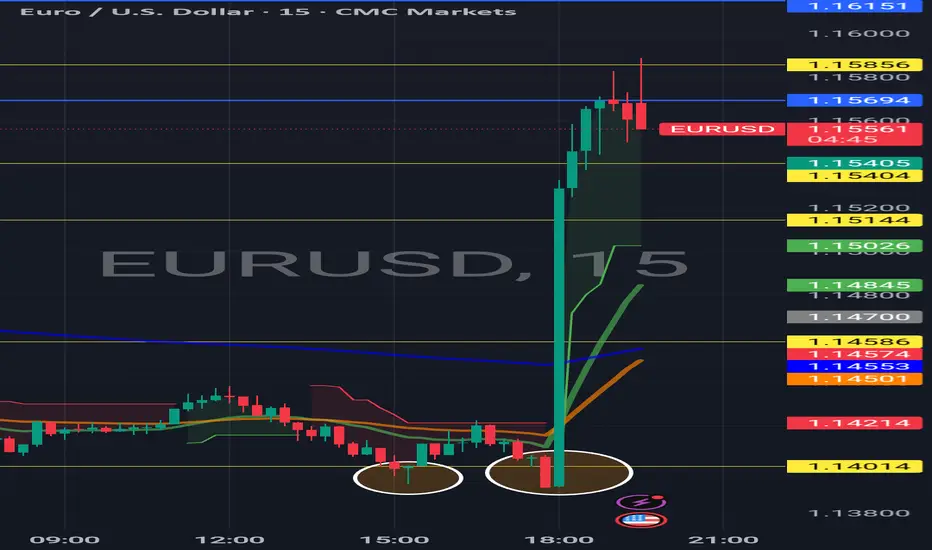
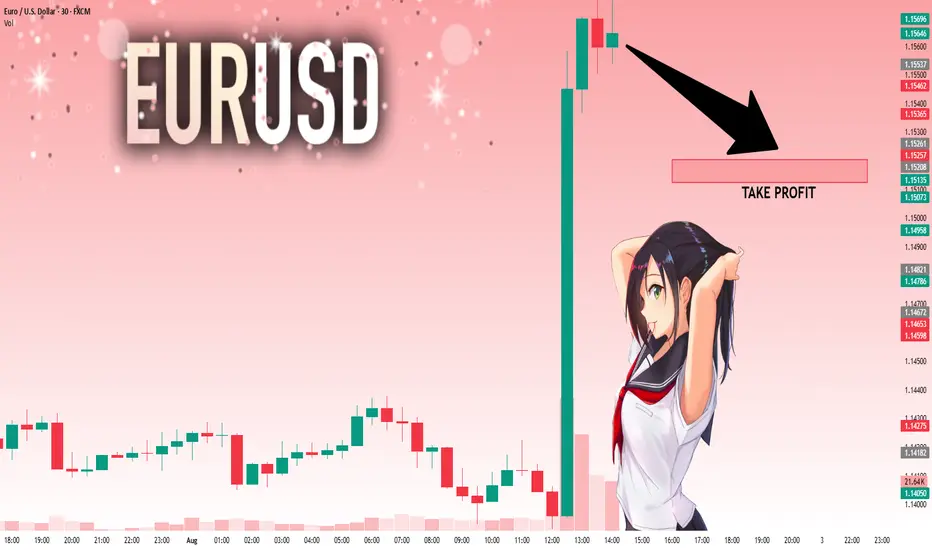
Fakeout before huge breakout in EURUSD#EURUSD Fakeout before huge candle breakout.
Just a learning experience how fakeouts are very frequent on forex and crypto market
Forex market
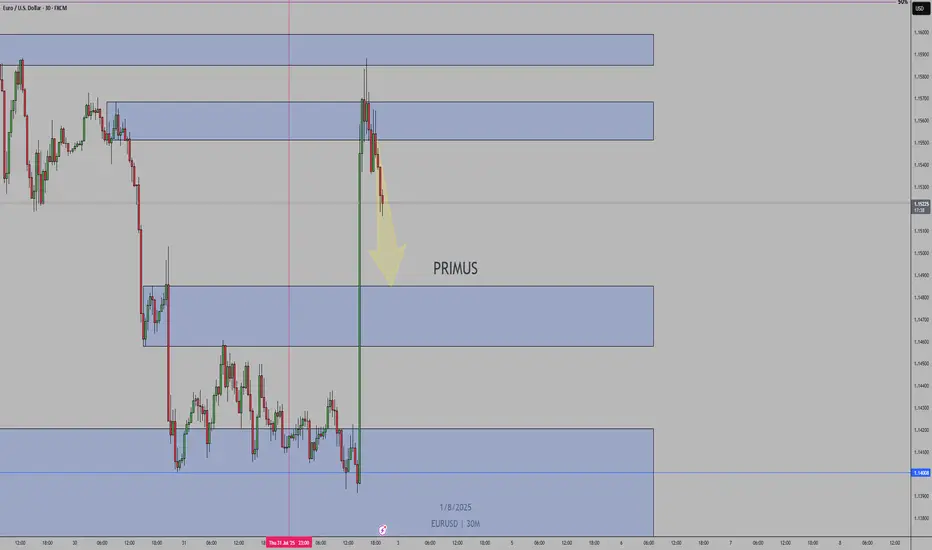
My Trading Journal on EU 01.08.2025On the first day of August 2025, I am entering a new month filled with opportunities. I am eager to see how the EU performs today, as it has influenced my last two trades. I hope that today marks either a strong or weak start to the month. Let's see how the market reacts in New York.
Be cautious with your trades and remember to pay attention to the high-impact news today: the Non-Farm Payrolls (NFP) and Employment Change reports.

EURJPY SHORTWe have a break of Market structure. The pair rose to the daily fair value gap hoping the pair will drop to the 169.800 level

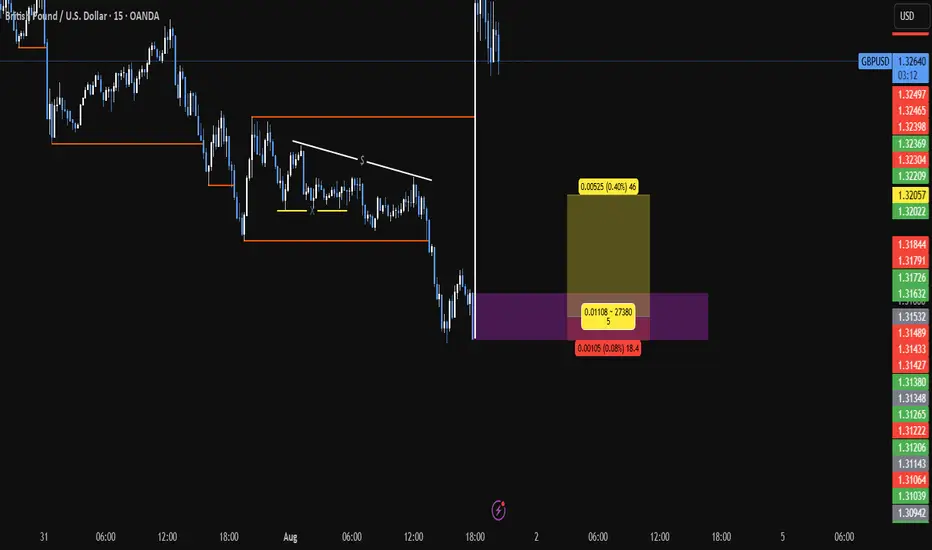
GBPUSD BUYBUY @1.31532
SL @1.31427
TP @1.32057
If SL hits by a candle sweep and closed above the entry level again buy....
And always risk 1%
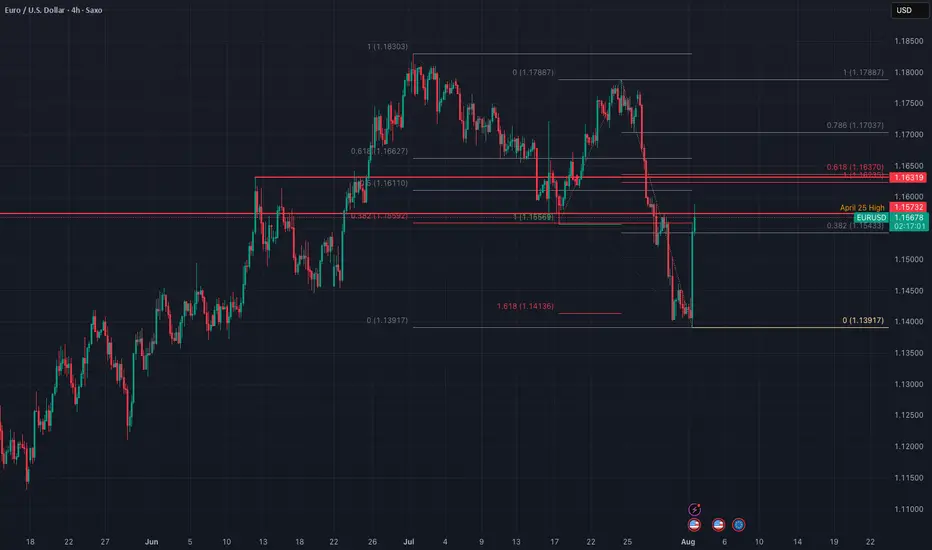
EURUSD - correction ahead of timeWell, well - EUR used the NFP data to start the correction ahead of time. It used the FR 161.8 of the recent correction as support. And it did it in a impressive time...
Now we are heading into Resistance cluster created by the April High and July Low (as wee and FR 38.8 of the whole movement form the July High. Yet the upper level of the cluster is created by the FR 61.8 of the recent impulse, and 1:1 with the recent correction and June High. The second one seems to me as stronger and more probably. However, price may be in hurry again and complete the correction ahead of time... Again.
Just my humble opinion...
Eurusd sell pending order set already. Hopefully on mondayBased on my technical analysis, I strongly speculate EURUSD fall on Monday.
GBPUSD MULTI TIME FRIME ANALYSISBased on the TREX method, this analysis is expected to be bearish, but the market is 50-50 and the pound may break the zone and rise.
If the sound quality is bad, forgive your greatness.

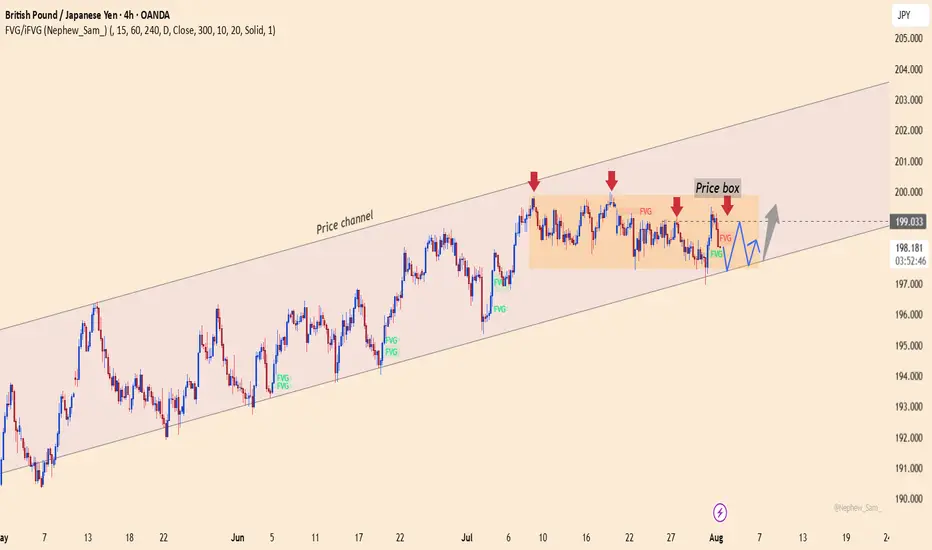
GBPJPY holds momentum, waiting for the final pushThe GBPJPY pair is moving sideways between 197.400 and 199.000, while maintaining its position inside the ascending price channel. Each pullback is quickly absorbed near the lower support, indicating that buying pressure is quietly building.
💡 Bullish factors supporting the trend:
– UK Services PMI beats expectations, strengthening economic outlook.
– BOJ maintains negative interest rates, weakening the JPY.
– Risk-on sentiment drives capital back into the GBP.
🎯 Suggested strategy:
Buy near 197.400 or on a breakout above 199.000.
Target: 201.500 | Stop-loss: below 196.800.
GBPUSD long position 01/08/2025English : According to our analysis, we anticipate a bullish scenario.
Morocan Darija : kanchofo d'apres l'analyse dyalna antsanaw tloo3
ATENTION : I only share my ideas, not signals

AUDUSD TRADE RECAPIn this video I explained the reasons as to why I didn't take AUDUSD and why I opted to trade GBPUSD! This can be the video that you need to watch before you close up the week. Wishing a good weekend guys

EURUSD: Move Down Expected! Short!
My dear friends,
Today we will analyse EURUSD together☺️
The price is near a wide key level
and the pair is approaching a significant decision level of 1.15337 Therefore, a strong bullish reaction here could determine the next move up.We will watch for a confirmation candle, and then target the next key level of 1.15208.Recommend Stop-loss is beyond the current level.
❤️Sending you lots of Love and Hugs❤️
EURUSDPrice rejecting supply; structure showing lower highs/lows. COT supports USD strength — expecting further downside.
EUR/USD (Bearish)
Price rejecting supply; lower highs/lows forming with COT backing USD strength. Bias remains bearish toward next support.
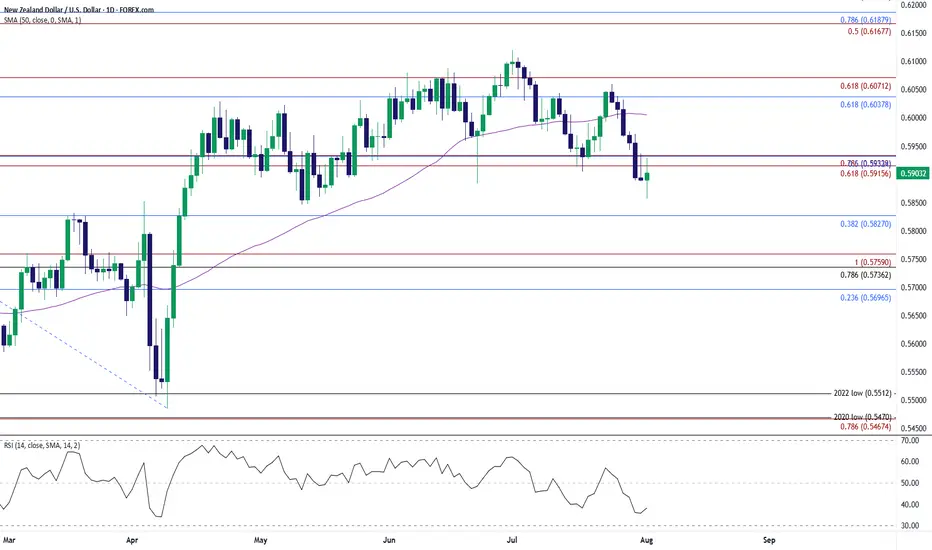
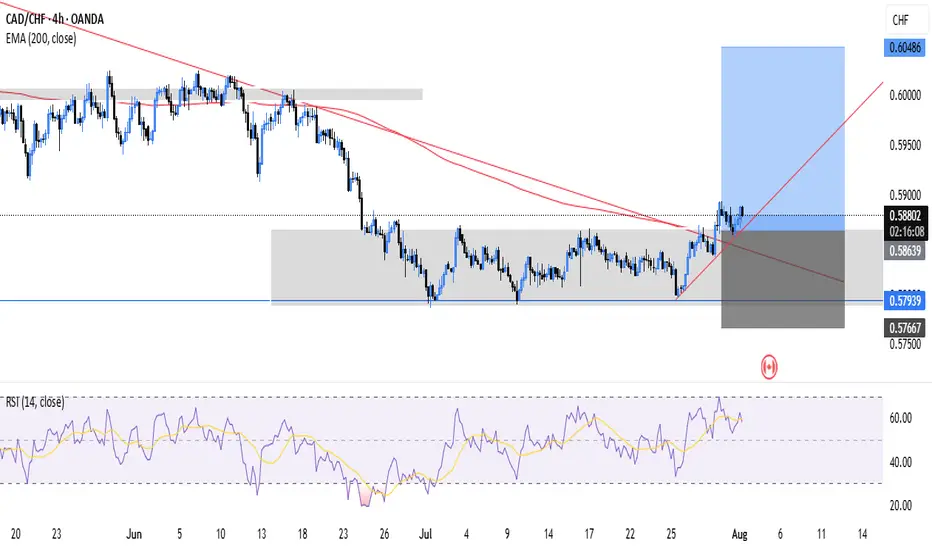
NZD/USD Holds Above May LowNZD/USD halts the decline from earlier this week to hold above the May low (0.5847), with a move/close above the 0.5920 (61.8% Fibonacci extension) to 0.5930 (78.6% Fibonacci extension) region bringing the 0.6040 (61.8% Fibonacci retracement) to 0.6070 (61.8% Fibonacci extension) zone on the radar.
Next area of interest comes in around the July high (0.6120), but the rebound in NZD/USD may turn out to be temporary if it struggles to trade back above the 0.5920 (61.8% Fibonacci extension) to 0.5930 (78.6% Fibonacci extension) region.
A breach of the May low (0.5847) opens up 0.5830 (38.2% Fibonacci retracement), with the next area of interest coming in around 0.5740 (78.6% Fibonacci retracement) to 0.5760 (100% Fibonacci extension).
--- Written by David Song, Senior Strategist at FOREX.com
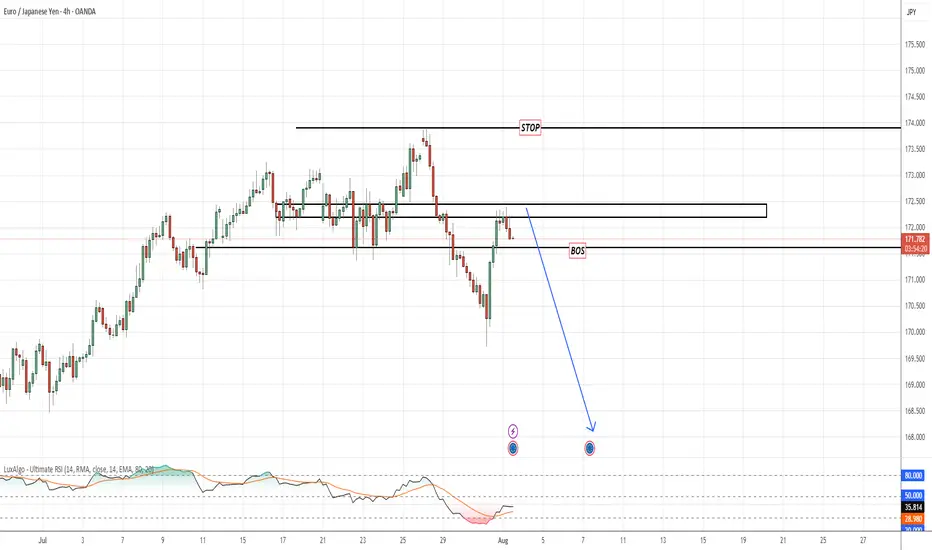
EURJPYPrice just broke key internal structure with a clear BoS (Break of Structure) after liquidity sweep above the previous highs. We're now watching for a clean retracement to the supply zone to execute a sniper short.
📍 Setup Details:
BoS Confirmed: 172.00 level cleanly broken
Area of Interest: Supply zone 172.90–173.60
Stop: Above liquidity zone ~174.55
Target: Downside continuation toward 168.00–167.00
📉 RSI shows momentum weakness on the pullback
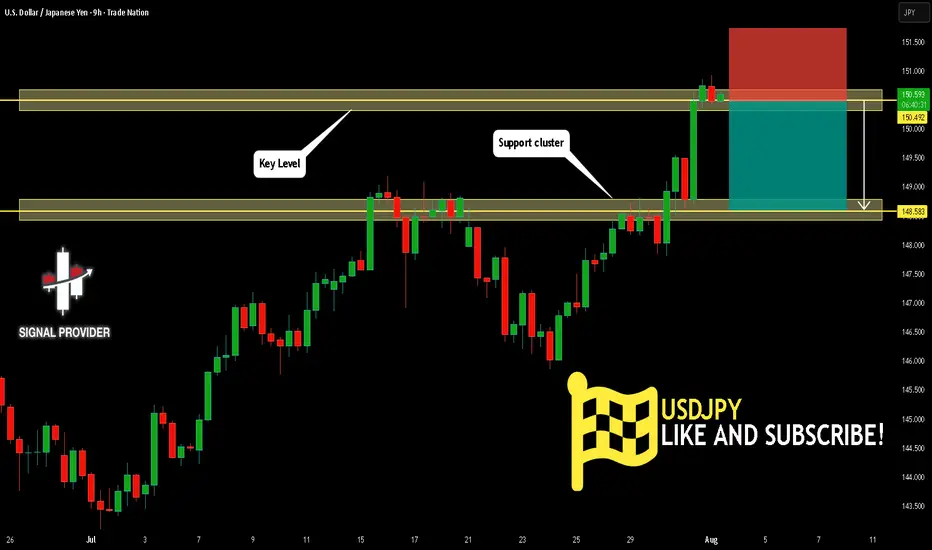
USDJPY Is Very Bearish! Sell!
Here is our detailed technical review for USDJPY.
Time Frame: 9h
Current Trend: Bearish
Sentiment: Overbought (based on 7-period RSI)
Forecast: Bearish
The market is on a crucial zone of supply 150.492.
The above-mentioned technicals clearly indicate the dominance of sellers on the market. I recommend shorting the instrument, aiming at 148.583 level.
P.S
We determine oversold/overbought condition with RSI indicator.
When it drops below 30 - the market is considered to be oversold.
When it bounces above 70 - the market is considered to be overbought.
Disclosure: I am part of Trade Nation's Influencer program and receive a monthly fee for using their TradingView charts in my analysis.
Like and subscribe and comment my ideas if you enjoy them!
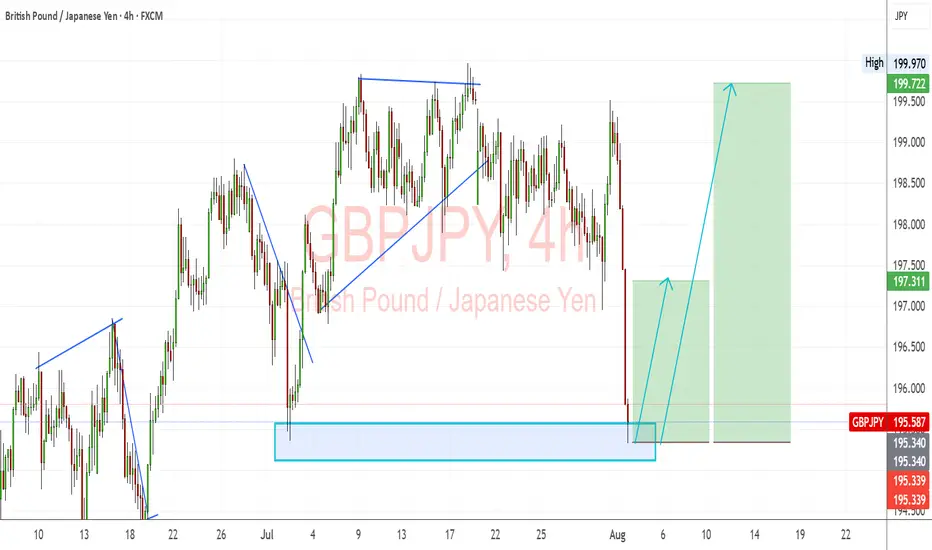
GBPJPY: Strong Bullish Reversal from Demand ZoneGBPJPY has bounced sharply from a key demand zone, indicating renewed bullish momentum. The pair continues to follow the broader bullish bias in GBP crosses, with JPY weakness driven by the Bank of Japan's dovish policy stance.
Technical Analysis (4H Chart)
Pattern: Bullish rejection from the 195.30–195.50 demand zone.
Current Level: 195.58, rebounding from strong support, setting up for a potential upward leg.
Key Support Levels:
195.34 – immediate demand zone and critical support.
194.90 – deeper backup support if a pullback occurs.
Resistance Levels:
197.31 – near-term resistance and first upside target.
199.72 – extended target if bullish continuation strengthens.
Projection: As long as 195.34 holds, GBP/JPY could push toward 197.31, with potential for 199.72 if GBP strength persists.
Fundamental Analysis
Bias: Bullish.
Key Fundamentals:
GBP: Supported by the BOE’s cautious but tight stance due to persistent inflation pressures.
JPY: Remains fundamentally weak, with the BoJ avoiding major policy tightening while intervention threats only provide short-term support.
Risk Sentiment: Mild risk-on conditions favor GBP over safe-haven JPY.
Risks:
BoJ FX intervention could temporarily strengthen JPY.
A dovish BOE shift could slow GBP momentum.
Key Events:
BOE policy updates and UK CPI.
BoJ commentary and risk sentiment indicators.
Leader/Lagger Dynamics
GBP/JPY is a leader among JPY pairs due to GBP’s volatility and strength. It often outpaces EUR/JPY and CHF/JPY, making it a key pair for JPY sentiment shifts.
Summary: Bias and Watchpoints
GBP/JPY is bullish, with price rebounding from the 195.34 demand zone. Upside targets are 197.31 and 199.72. Watch for BOE communication, BoJ intervention signals, and global risk sentiment for confirmation of the move.
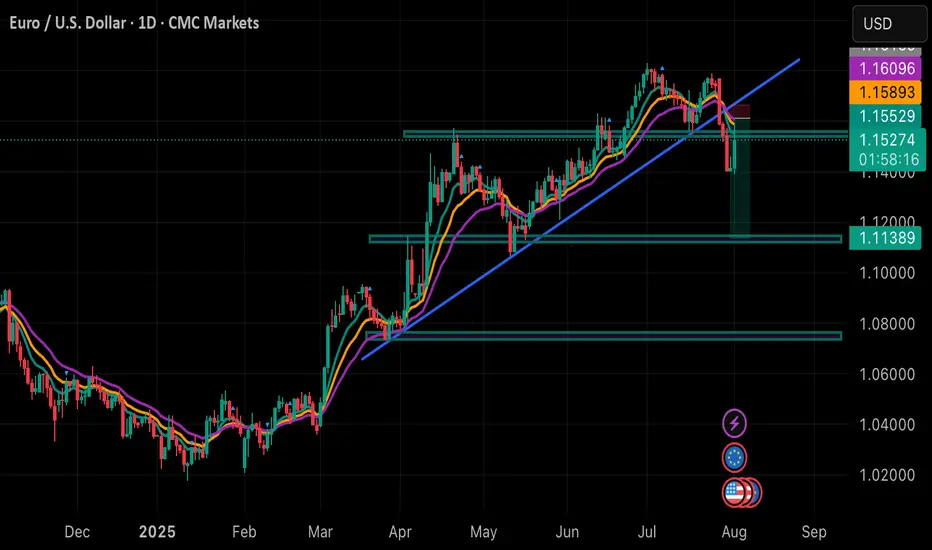
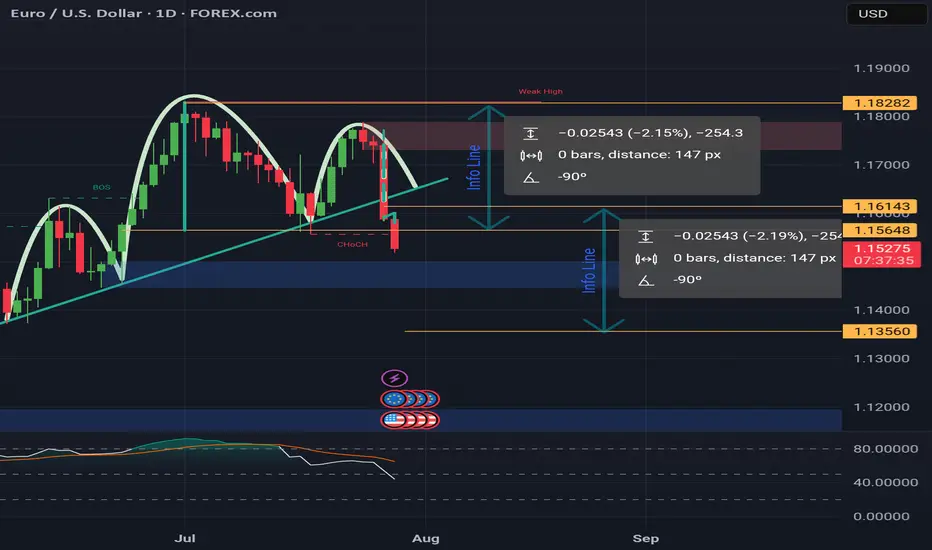
Head & Shoulders on EUR/USD daily!We're currently observing a significant Head & Shoulders pattern forming on the EUR/USD daily chart, with the price just breaking below the neckline on the right shoulder.
Applying standard Head & Shoulders trading principles, we measure the distance from the head's peak to the neckline and project that same range downward from the breakdown point. Based on this, the estimated target price (TP) for the trade lands around $1.135. The stop-loss will be positioned just above the right shoulder to manage risk effectively.
We'll be watching closely to see how this setup unfolds. 🍻
Trend decision after the newsAfter the news, the price nearly reached the bottom of the higher time frame channel and paused. We need to see whether the price can break into the channel or not. Personally, I don’t think that will happen. I believe a range will form within the marked zone, and then the price will drop further.

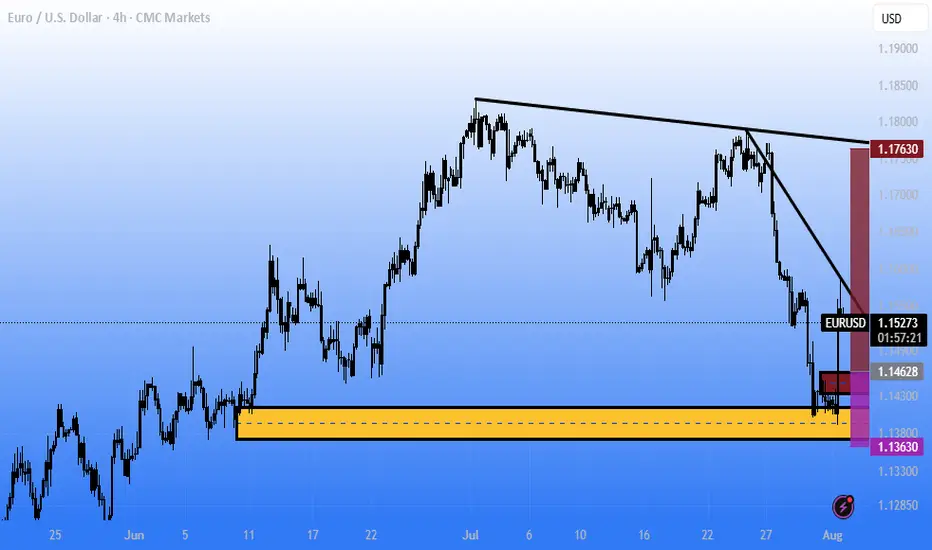
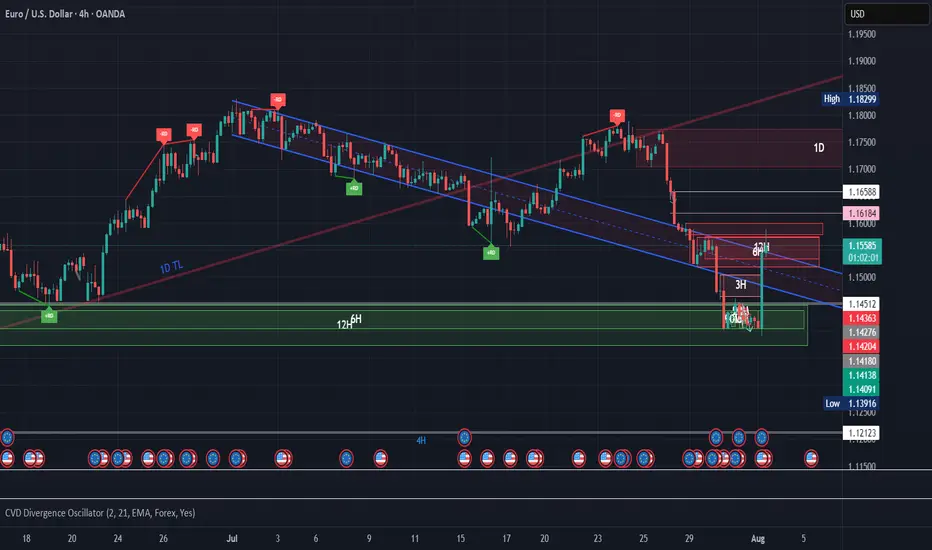
EURUSD short to 1.121Hello Traders,
Factoring in the fundamentals such as US EUR trade deal, $600 billion of investment into US, $350 billion investment from South Korea.
4hr chart, trading under 1 day up trendline.
Was strong sell signal from 1.177 last Thursday.
200ema starting to turn downwards
Still close to upper regression channel that began July 1st, believe it is still in play.
6 hr and 12 hr block still support, strong rejection at 4h bearish block. not expecting much else today since it's Friday. Still targeting 1.121 in August
Originally entered trade at 1.172 area, added 3 times on the way down, originally targeting 1.143 but with the ever evolving trade deal news that I believe to be bullish for the USD I moved target to 1.121.
Goodluck to you all.
EURUSD – Smart Money Short Setup During NFP Friday | ICT Concept
EURUSD is trading inside a well-defined bearish structure after multiple internal liquidity sweeps during the London and Asia sessions.
As we enter the New York Killzone, price has returned to a bearish OB near the NY Midnight Open, with clear signs of exhaustion.
The pair failed to break above the Thursday OB zone, and the 15M chart shows consecutive MSS and BOS patterns, indicating supply is in control.
🧠 Trade Idea (Execution Plan):
Sell Limit: 1.14183
SL: 1.14422
TP1: 1.13877
TP2: 1.13608
TP3: 1.13351
📌 Confluence:
Bearish OB
NY Midnight Open rejection
MSS on LTF
RSI/Williams %R Overbought
📉 Structure: Bearish
🕒 Session: New York (NFP Volatility Expected)
💡 Context: USD is likely to strengthen after deep retracement into DXY OB, targeting 100.5–100.7
If price invalidates 1.14422 with bullish displacement, setup becomes void.
Patience is key during high-impact news – let Smart Money show their hand.

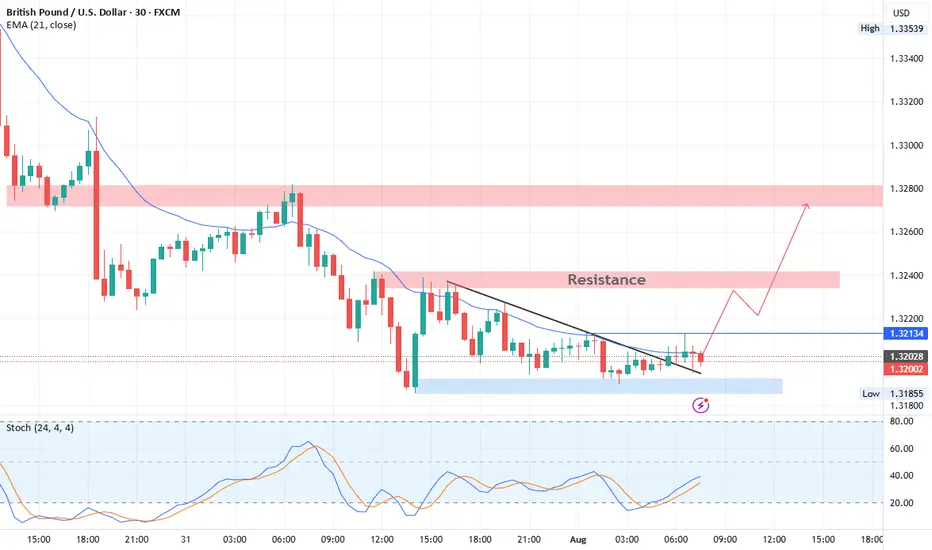
GBPUSD Technical BreakdownTrendline Breakout:
Price has decisively broken above a short-term descending trendline, signaling a potential shift in intraday momentum from bearish to bullish.
Support Zone (1.3185 – 1.3195):
This demand area has provided a strong base, with multiple successful rejections confirming buyer interest.
Resistance Levels:
Near-term resistance: 1.3213 (minor breakout level – watch for retest)
Key upside targets: 1.3240 followed by the major supply zone at 1.3275 – 1.3290
📈 Trade Outlook:
Bias: Bullish above 1.3213
Entry Idea: Look for bullish confirmation on a retest of 1.3213 as support
Targets:
TP1: 1.3240
TP2: 1.3275 – 1.3290
Invalidation: A sustained move below 1.3185 would invalidate the setup and reopen downside risk.