Check the trend Given that there is a possibility of a triangle pattern forming, it is expected that the price will change direction at the current resistance level and a downtrend will begin. If the price consolidates above the green resistance level, the uptrend will likely continue.
Forex market
Correction It is expected that the downtrend will continue to form until the specified support levels. Then there is a possibility of a trend change and the start of an uptrend. If the price breaks through the support area, the downtrend will continue to the next support area.
Possibility of correction As long as the price fluctuates above the support trend line, the continuation of the uptrend is likely. If the price crosses the support trend line, it will be a confirmation of the downtrend and the start of a downtrend or correction is likely.
Downtrend If the price can break through the support trend line, a continuation of the downtrend to the support levels is likely. Otherwise, an uptrend is possible with consolidation above the support level.
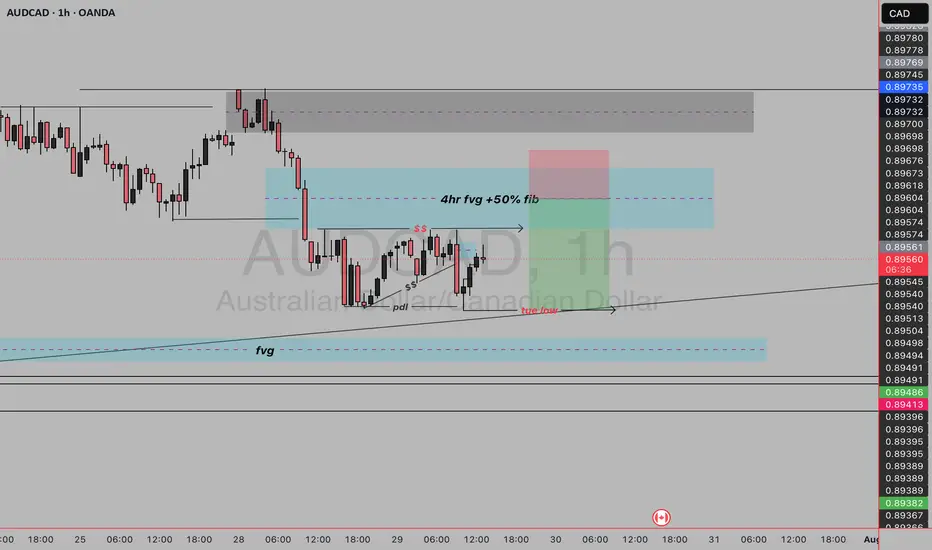
audcad sell setupThis AUD/CAD H1 chart shows a Smart Money Concept (SMC) based sell setup, focused on liquidity engineering, internal structure shifts, and supply zone rejections.
Key Features of the Sell Setup
1. Break of Market Structure
Price previously rallied and made a high at 0.90140.
After that, there was a clear break of structure to the downside with strong bearish candles—indicating distribution and a bearish order flow shift.
2. Premium Supply Zone (Blue Box)
The price is retracing back into a supply zone, where institutional orders previously caused the strong drop.
The blue zone marks a bearish Order Block or supply area where price is expected to react.
Your entry is placed just below this zone.
3. Equal Highs / Liquidity Above
Multiple internal highs were created (marked with $$)—these are liquidity traps.
Price is likely to grab liquidity above these highs before rejecting from the supply zone.
4. Entry Context
Sell entry is placed after a liquidity sweep above minor internal highs.
The Current High (crt high) marks the point of internal liquidity.
This entry is anticipating a rejection from this area (above previous highs but below the OB's top).
5. Fair Value Gap (fvg)
A clear FVG exists below current price—this is your downside magnet or target area.
Price often fills FVGs after mitigation of supply/demand.
6. Stop Loss & Take Profit
Stop Loss (red box): Placed above the supply zone and liquidity grab area, protecting from deeper retracements.
Take Profit (green box): Aiming toward the FVG zone and unfilled imbalance near 0.89430–0.89390.
Why This Is a Valid Sell Setup
Break of Bullish Structure (Shift in Order Flow).
Liquidity Sweeps above equal highs.
Retracement into Supply Zone / Premium.
Confluence with FVG below for target
Check the trend Given the price behavior within the current resistance range, possible scenarios have been identified. It is expected that after some volatility and correction, we will see a continuation of the upward trend.
Check the trend A triangle pattern is expected to form within the current support range. Then the start of an uptrend is likely. If the price breaks through the 78.6% level, a continuation of the correction and downtrend is possible.
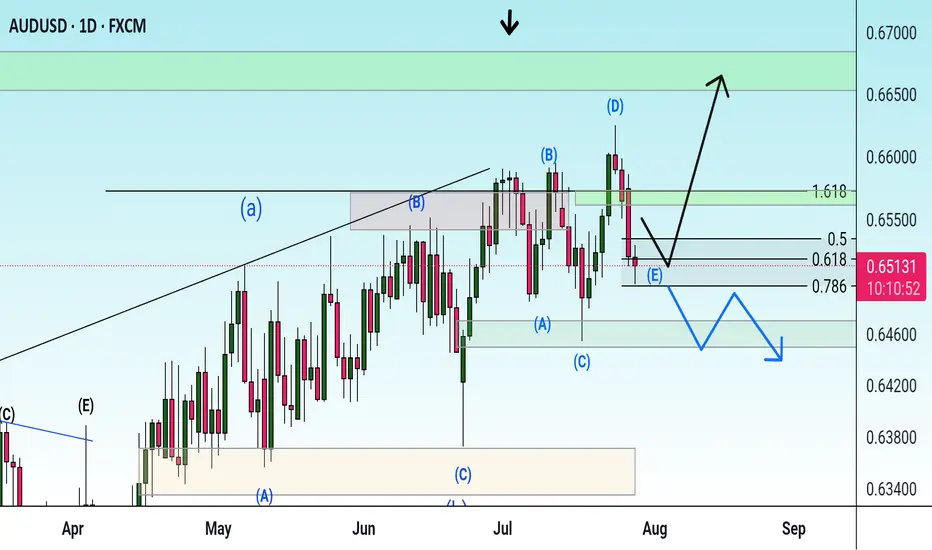
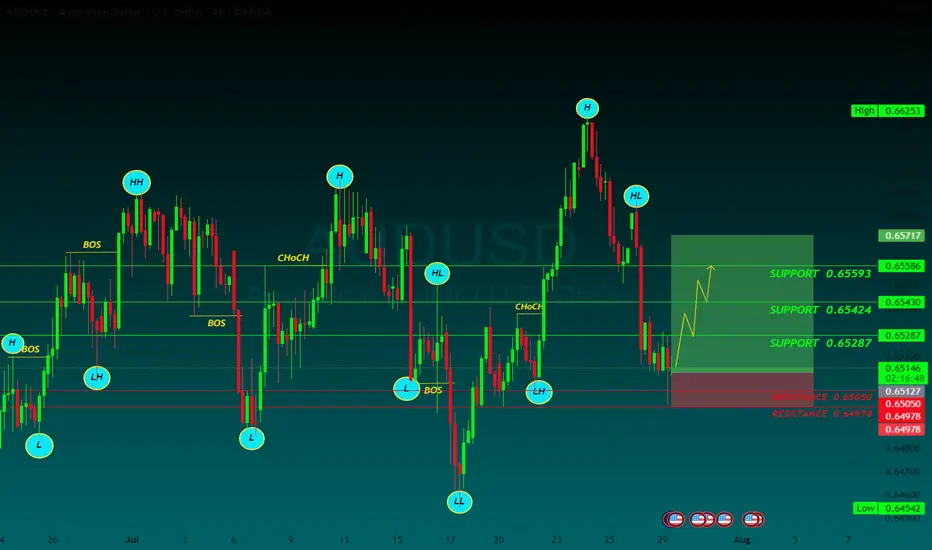
AUDUSD BUYThe AUD/USD pair is trading around 0.6520 on Tuesday. The daily chart’s technical analysis indicates a prevailing bullish bias as the pair remains within the ascending channel pattern. However, the 14-day Relative Strength Index (RSI) has moved below the 50 mark, indicating that a bearish bias is active. Additionally, the pair is positioned below the nine-day Exponential Moving Average (EMA), indicating that short-term price momentum is weaker.
The US and EU reached a framework trade agreement on Sunday that sets 15% tariffs on most European goods, taking effect on August 1. This deal has ended a months-long stand-off, per Bloomberg.
Traders keep their eyes on further developments in the US-China trade talks. The discussions are set to resume on Tuesday after top economic officials from both nations held over five hours of negotiations in Stockholm on Monday. The purpose of this meeting is to resolve ongoing disputes and extend their trade truce by another three months.
US Treasury Chief Scott Bessent met with China’s Vice Premier He Lifeng at Sweden’s Rosenbad government offices. The meeting comes ahead of an August 12 deadline to finalize a long-term tariff agreement with the Trump administration, building on preliminary deals reached in May and June that had helped ease tensions.
The US Federal Reserve (Fed) is widely expected to keep the benchmark interest rate steady between 4.25% and 4.50% at its July meeting. The FOMC press conference will be observed for any signs that rate cuts may start in September.
The Reserve Bank of Australia (RBA) is expected to closely watch the June labor force data and second-quarter inflation figures before deciding on a potential rate cut. Both the monthly and quarterly CPI reports are scheduled for release later this week.
SUPPORT 0.65593
SUPPORT 0.65424
SUPPORT 0.65593
RESISTSNCE 0.65050
RESISTANCE 0.64973
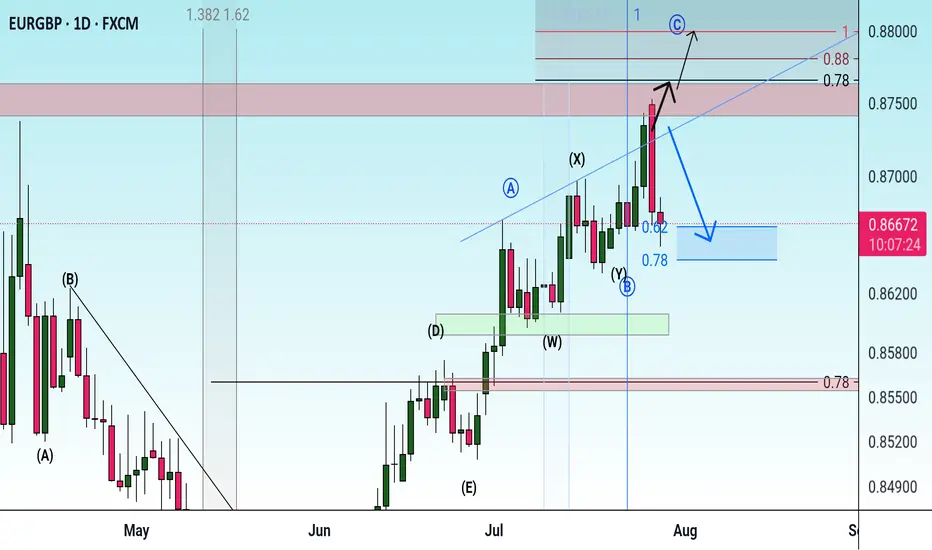
GBPCAD waiting to shortbased on daily candle closed yesterday, i'm expecting another bearish move today.
i'm marked the possible resistant area and waiting lower timeframe to do reversal pattern.
calculate your own risk & reward.
Good luck

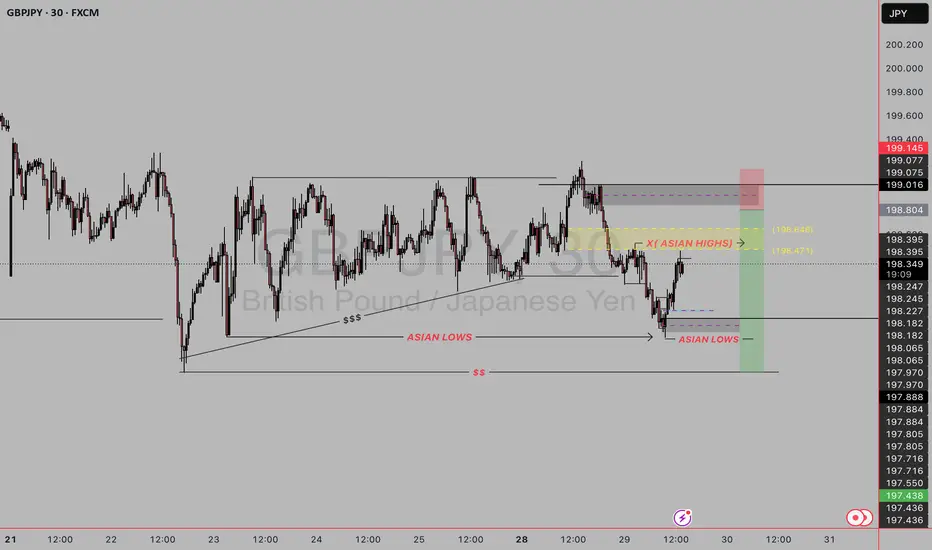
GJ SELL SETUP This GBP/JPY 30-minute chart shows a short trade setup based on Smart Money Concepts (SMC), liquidity sweep zones, and session highs/lows. Here's a breakdown of what’s happening:
1) Key Elements Identified in the Chart
Asian Session Range
Asian Highs (Yellow Zone at ~198.471–198.646): Marked as a key liquidity zone.
Asian Lows (Purple Line): Used for liquidity hunting and market structure context.
2) Market Structure
Prior to this setup, price had a bullish structure, forming higher highs.
Eventually, price broke structure to the downside, suggesting a shift to bearish momentum.
3)Liquidity Grabs
Price swept the Asian lows, tapping into sell-side liquidity.
The current move upward looks like a retracement into the Asian highs, likely aiming to grab buy-side liquidity.
4)Entry Zone
The entry is placed just around the Asian highs, targeting the idea that this area will act as a supply zone or breaker block.
Stop Loss (Red Box): Above the liquidity zone, where a breaker would be invalidated.
Take Profit (Green Box): Targeting the recent lows or continuation lower—likely the low around 197.438.
Risk-Reward Ratio
The R:R looks solid—about 2.5–3:1, suggesting a well-balanced trade.
Why This Is a Bearish Setup
Liquidity Sweep: Price ran below Asian lows, collected liquidity, and is now retracing.
Premium Zone: Current price is retracing into a premium zone (above equilibrium) where sellers are expected to re-enter.
Rejection Expected: The idea is that price will reject around 198.5–198.6 (where previous buy stops are likely stacked).
EUR USD LONG SETUP Price is currently in a falling Broadening wedge which is a Bullish trend and with the conflunce of the Demand Zone just below the wedge pattern.
Setup might need adjustments though, but we'll see how price moves and further direction.
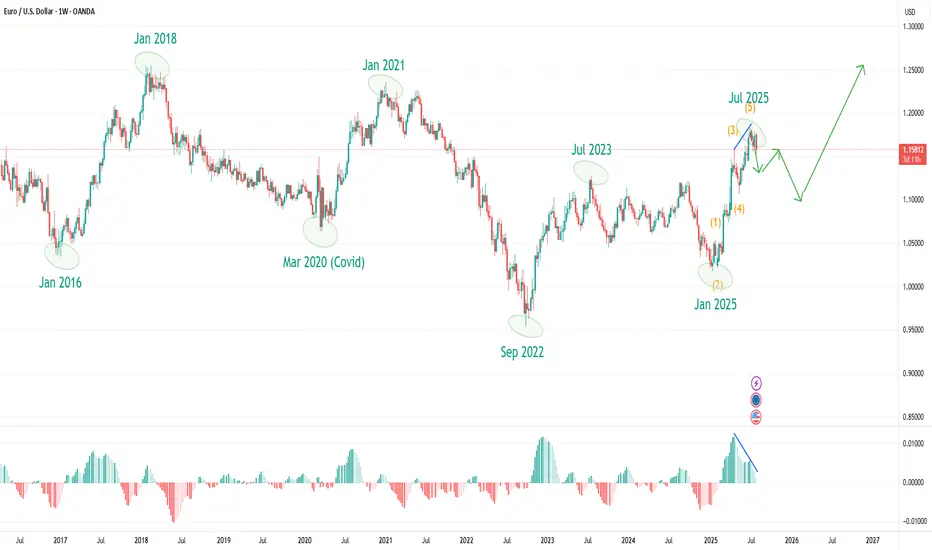
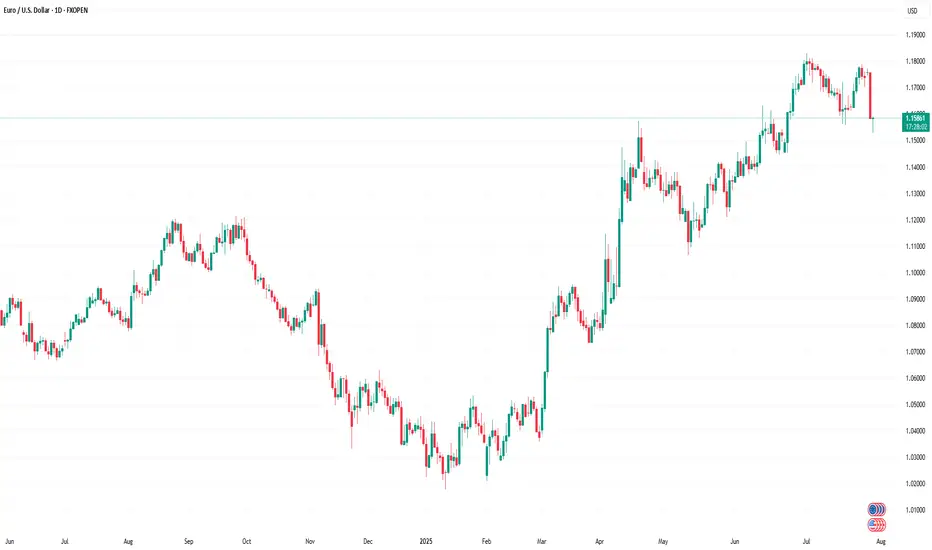
EUR/USD: Is the Next Big Correction Already Underway?EUR/USD: After 120 Days Up, Are We Entering a Year-Long Correction? What Market Cycles Reveal.
As EUR/USD traders digest the stunning 120-day, five-wave rally from the January 2025 lows to the July 2025 highs, the big question now is—what's next? The clues are right in front of us, and they suggest we may be headed into an extended corrective phase, one that could last until the very start of 2026.
What the Current Structure Shows
Motive Wave Complete: The impulsive surge just wrapped up a textbook five-wave move, with each leg unfolding cleanly and culminating in a July top. Motive waves like this are the engines of market trends—fast-moving, decisive, and packed with momentum.
Corrective Phase Incoming: But all trends eventually pause, and here the evidence points to a shift. Corrective waves—unlike their trending counterparts—are time-consuming, choppy, and have a tendency to frustrate impatient traders. The completed motive wave took just 120 days, but corrections often take much longer to play out. According to this chart, the probable timeline for this correction extends into December 2025, or possibly beyond.
Why the Count Is Labelled This Way
Wave Duration Clue: One of the most reliable Elliott Wave principles is that corrective phases outlast the sharp, high-energy motive moves that precede them. With the motive wave spanning four months, a comparable correction stretching into late 2025 makes perfect structural sense.
Cycle Awareness, Major Turning Points, and MACD Divergence:
Flip to the weekly turning points chart, and a deeper pattern emerges: Major EUR/USD direction changes consistently cluster around the start of a new year, with minor tops and bottoms often forming near mid-year. Over the last eight years, six out of seven major pivots have landed at those cycle pivots.
Notably, if you look at the weekly chart’s MACD, there’s now a clear bearish divergence—while price clocked new highs into July, the MACD failed to confirm, rolling over and diverging lower. This kind of momentum divergence at a major turning point is classic for trend exhaustion and aligns perfectly with the idea that a correction is not only likely, but perhaps overdue.
This powerful confluence—timing, price structure, and momentum—underscores just how much “cycle” and structure awareness can add to your trading playbook.
What to Watch Next (Trade Planning)
Timing the Correction: If the correction follows historical precedent, expect sideways or choppy price action well into Q4 2025, with the next big directional opportunity around the calendar turn into 2026.
Cycle-Based Strategies: Recognising these cycles lets you prepare for reversals, especially if price is diverging from the MACD at those major timing windows.
Structure > Prediction: The motive phase is where you ride the trend; cycles, structure, and momentum help you avoid exhaustion traps and see when patience is required.
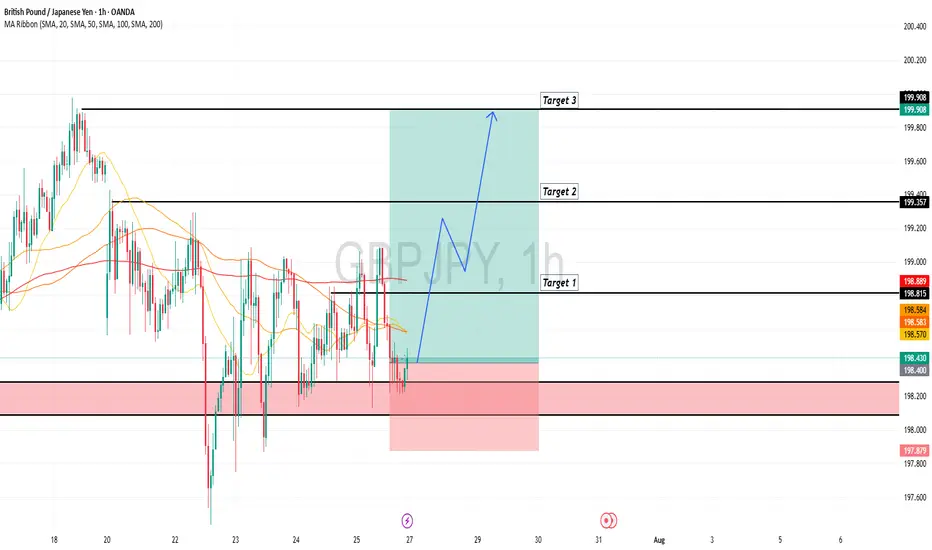
GBPJPY is Holding above the SupportHello Traders
In This Chart GBPJPY HOURLY Forex Forecast By FOREX PLANET
today GBPJPY analysis 👆
🟢This Chart includes_ (GBPJPY market update)
🟢What is The Next Opportunity on GBPJPY Market
🟢how to Enter to the Valid Entry With Assurance Profit
This CHART is For Trader's that Want to Improve Their Technical Analysis Skills and Their Trading By Understanding How To Analyze The Market Using Multiple Timeframes and Understanding The Bigger Picture on the Charts
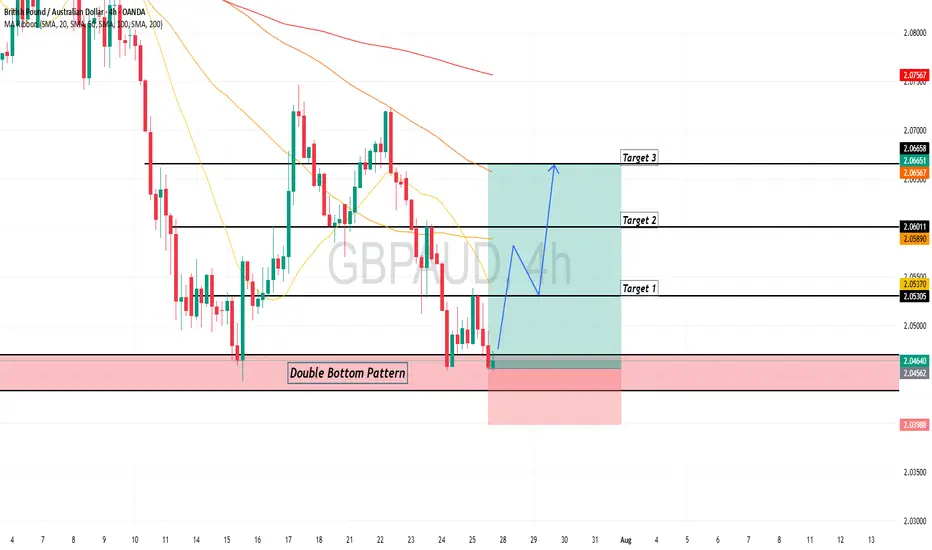
GBPAUD is Holding above the Support , All Eyes on BuyingHello Traders
In This Chart GBPAUD HOURLY Forex Forecast By FOREX PLANET
today GBPAUD analysis 👆
🟢This Chart includes_ (GBPAUD market update)
🟢What is The Next Opportunity on GBPJPY Market
🟢how to Enter to the Valid Entry With Assurance Profit
This CHART is For Trader's that Want to Improve Their Technical Analysis Skills and Their Trading By Understanding How To Analyze The Market Using Multiple Timeframes and Understanding The Bigger Picture on the Charts
How Do Traders Use the Pivot Points Indicator? How Do Traders Use the Pivot Points Indicator?
Pivot points are a popular technical analysis tool for spotting areas where the price is expected to react, i.e. pause or reverse. Calculated using the previous day’s high, low, and close, they’re projected onto the current session to highlight potential support and resistance levels, especially useful for intraday traders.
Alongside stock charts, pivot point levels can be used in a wide variety of markets, including forex, commodities, and cryptocurrencies*. As a versatile indicator, pivot points also come in many different types. This article breaks down the definition of pivot points, the variations traders use, and how they can fit into a broader trading strategy.
A Deeper Look at Pivot Points
A common question in technical analysis is, “What is a pivot point?” Pivot points trading, or pivot point theory, is a popular technical analysis concept used in a range of financial asset classes, including stocks, currencies, cryptocurrencies*, and commodities. The indicator assists traders in gauging overall market trends and determining possible support and resistance barriers.
How to Read Pivot Points
The pivot point indicator is static—it’s an average of the high, low, and close prices from the previous trading day. It includes three levels: pivot point (P), support (S), and resistance (R). If the price is above the pivot point, it is supposed to target resistance barriers. Conversely, if it’s below the pivot, it could move to support levels. Thus, support and resistance levels serve as targets or stop-loss zones. They remain constant throughout the period, enabling traders to plan ahead.
In the EURUSD daily chart below, the price is trading above R2; therefore, market sentiment is assumed to be bullish. R3 indicates the next possible price target. Should a shift below P occur, bearishness arises, and S1 becomes the upcoming support level.
Pivots are widely used with trend indicators such as moving averages and Fibonacci tools. In the chart below, Fibonacci retracements could be used to identify intermediate levels of support and resistance within widely placed pivots.
How to Calculate Pivot Points?
There are four key types of pivots, including standard, Woodie’s, Camarilla, and Fibonacci. While there’s no need to use a pivot points calculator—they’re calculated automatically when implemented on a price chart—it is worth looking at their formulas to understand how they differ from each other.
Note the labels for the following formulas:
P = pivot point
H = high price
L = low price
C = close price
Standard Pivot Points
Traders commonly use standard pivot points. Traditional pivots (P) identify potential levels of support (S) and resistance (R) by averaging the previous trading period's high, low, and close prices.
P = (H + L + C) / 3
S1 = (2 * P) - H
S2 = P - (H - L)
R1 = (2 * P) - L
R2 = P + (H -L)
Although they are popular among traders, they can produce false signals and lead to incorrect trades in ranging markets and during periods of high volatility.
Woodie’s Pivot Points
Woodie's pivots are similar to standard pivots but include a slight modification to the calculation. In Woodie's method, the close price is assigned more weight.
P = (H + L + 2 * C) / 4
R1 = (2 * P) - L
R2 = P + H - L
S1 = (2 * P) - H
S2 = P - H + L
However, their extra sensitivity can make them less reliable during choppy markets or when the price lacks a clear direction.
Camarilla Pivot Points
Camarilla pivots use a set formula to generate eight levels: four support and four resistance. They are based on the previous day’s close and range and multiplied by a certain multiplier. The inner levels (R3 and S3) often act as reversal zones, while R4 and S4 are watched for breakouts. Still, in trending markets, the reversals can fail frequently.
R4 = C + (H - L) x 1.5
R3 = C + (H - L) x 1.25
R2 = C + (H - L) x 1.1666
R1 = C + (H - L) x 1.0833
P = (High + Low + Close) / 3
S1 = C - (H - L) x 1.0833
S2 = C - (H - L) x 1.1666
S3 = C - (H - L) x 1.25
S4 = C - (H - L) x 1.5
Fibonacci Pivot Points
Fibonacci pivot points are based on the Fibonacci sequence, a popular mathematical concept in technical analysis.
They are calculated in the same way as the standard indicator. However, the levels of support and resistance are determined by including the Fibonacci sequence with a close monitoring of the 38.2% and 61.8% retracement levels as the primary price points.
P = (High + Low + Close) / 3
S1 = P - (0.382 * (H - L))
S2 = P - (0.618 * (H - L))
R1 = P + (0.382 * (H - L))
R2 = P + (0.618 * (H - L))
Despite their popularity, Fibonacci pivots can become less reliable when the price reacts to other fundamental drivers.
Trading with the Pivot Points
Although every trader develops their own trading approach, there are common rules of pivot point trading that are expected to improve their effectiveness.
Day Trading
Day trading with pivot points is usually implemented for hourly and shorter intraday timeframes. As pivot levels are updated daily and calculated on the previous day's high, low, and close prices, this allows traders to react promptly to market changes and adjust their strategies. Some traders prefer Camarilla pivots as their calculation takes into account the volatility of the previous trading period to produce pivot levels closer to the current price.
Medium-Term Trading
When looking at a medium-term analysis, weekly pivot levels are added to four-hour and daily charts. These are calculated using the previous week's high, low, and close prices, which remain unchanged until the start of the next week.
Long-Term Trading
For longer-term analysis, traders use monthly pivots on weekly charts. These levels, gathered from the previous month's data, offer a broader picture of market trends and price movements over time.
Pivot Point Trading Strategies
The pivot points indicator is typically used in two ways – breakout and reversal trading.
Breakout Trading Strategy
The breakout approach seeks to take advantage of market momentum by entering trades when prices break above or below significant levels of support and resistance.
- Bullish Breakout. When levels P and R1 are broken, and the price closes above either, it’s more likely a rise will occur.
- Bearish Breakout. When levels P and S1 are broken, and the price closes below either, it’s more likely the price fall will occur.
Strong momentum and high volume are two critical factors needed for a solid price movement in both cases.
Trading Conditions
If a breakout is confirmed, traders enter a trade in the breakout direction. A take-profit target might be placed at the next pivot level. A stop-loss level can be placed beyond the previous level or calculated according to a risk/reward ratio. Traders continuously monitor their trades and adjust their stop-loss levels to lock in potential returns if prices move in their favour.
Reversal Trading Strategy
The reversal strategy seeks to take advantage of a slowdown in market momentum by entering trades when prices stall at significant levels of support or resistance.
- Bullish Reversal. When levels S1 and S2 are not broken and the price stalls above either, a reversal is more likely to occur.
- Bearish Reversal. When levels R1 and R2 are not broken and the price stalls below either, a reversal is expected to happen.
Note: Reversals are always confirmed by another indicator or a chart pattern.
Trading Conditions
If a reversal is confirmed, traders consider entering a trade in its direction. The next level may be a take-profit target, which might be trailed to the next level if the market conditions signal a continuation of a price move. A stop-loss level is typically placed below a swing low or above a swing high, depending on the trade direction.
Pivot Points and Other Indicators
While pivots show where the price may reverse, there’s nothing to say a market won’t trade through these areas. Therefore, traders typically pair them with other technical indicators and patterns.
Candlestick and Chart Patterns
Traders often combine levels with specific reversal candlestick formations, like three black crows/three white soldiers or engulfing patterns, to confirm a change in market movements. For example, a bullish engulfing candle forming at S1 could reinforce the idea of a reversal at that level.
Moving Averages
When a pivot aligns with a major moving average, e.g. the 50-period or 200-period EMA, it strengthens the area. As moving averages act as dynamic support and resistance levels, an overlap can signal a strong area where a reversal might occur.
RSI and Stochastic Oscillator
Momentum indicators like RSI or Stochastic help judge whether the price is likely to bounce or break through a pivot. If it hits support and RSI is oversold, that adds conviction. But if momentum is still strong in one direction, it might get ignored.
Considerations
Even with strong confluence, these combinations can fail. Markets don’t always respect technical alignment, especially around data releases or sharp movements in sentiment. For instance, in stocks, pivot points may be ignored if an earnings release strongly beats analyst estimates. Instead, they are believed to work when treated as one piece of a broader technical framework.
Limitations
Pivot points are widely used, but like any tool, they have flaws. They’re based purely on past price data, so they don’t account for news, sentiment shifts, or broader market context.
- False signals in ranging markets: The price often oscillates around pivot zones in markets without a clear direction, meaning setups might not follow through.
- Less reliable during strong trends: In trending conditions, the price can blow past several levels without reacting.
- No built-in volatility filter: The points don’t adapt to changing volatility, so levels might be too close or too far apart to be useful.
- Lag in real-time shifts: Since pivots are pre-calculated, they don’t adjust mid-session as new data emerges.
Final Thoughts
Pivot points are widely used in stock trading as well as in commodity, cryptocurrency*, and currency markets. While they can be useful tools, their limitations cannot be overlooked. It is essential to conduct a comprehensive analysis and confirm the indicator signals with fundamental and technical analysis tools.
FAQ
What Is a Pivot Point in Trading?
The pivot point meaning refers to a technical analysis tool used to identify potential support and resistance levels. It’s calculated using the previous day’s high, low, and close prices, and helps traders find areas where the price may react during the current session.
What Is the Best Indicator for Pivot Points?
There isn’t one best indicator, but traders often pair pivot points with moving averages, RSI, or candlestick patterns to confirm a potential reversal. The most effective setup usually depends on the strategy and market conditions.
What Are the Pivot Points’ R1, R2, and R3?
R1, R2, and R3 are resistance levels above the central point. They represent increasingly stronger potential resistance zones where the price may stall or reverse.
Which Is Better, Fibonacci or Camarilla?
Fibonacci offers wider levels based on retracement ratios, useful in trending markets. Camarilla focuses on tighter reversal zones, which are mostly used for intraday strategies. Each suits different trading styles; neither is objectively better.
*Important: At FXOpen UK, Cryptocurrency trading via CFDs is only available to our Professional clients. They are not available for trading by Retail clients. To find out more information about how this may affect you, please get in touch with our team.
This article represents the opinion of the Companies operating under the FXOpen brand only. It is not to be construed as an offer, solicitation, or recommendation with respect to products and services provided by the Companies operating under the FXOpen brand, nor is it to be considered financial advice.
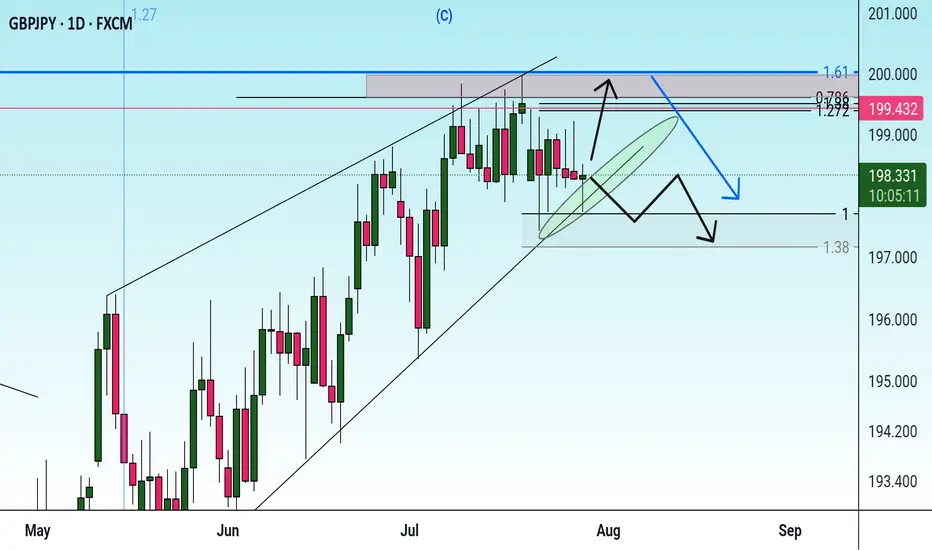
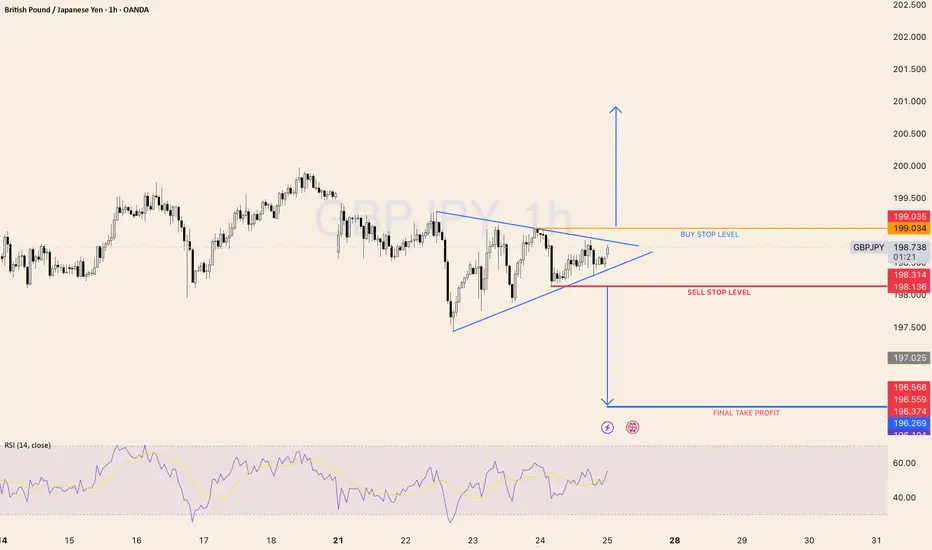
GBP/JPY SYMMETRICAL TRIANGLESYMMETRICAL TRIANGLE Completion: A potential breakout scenario for GBP/JPY involves the currency pair moving sharply out of a symmetrical triangle pattern. If the pair breaks above the upper trendline, it could signal a bullish move, with traders targeting higher resistance levels. Conversely, a break below the lower trendline may indicate a bearish trend, prompting a search for support levels.
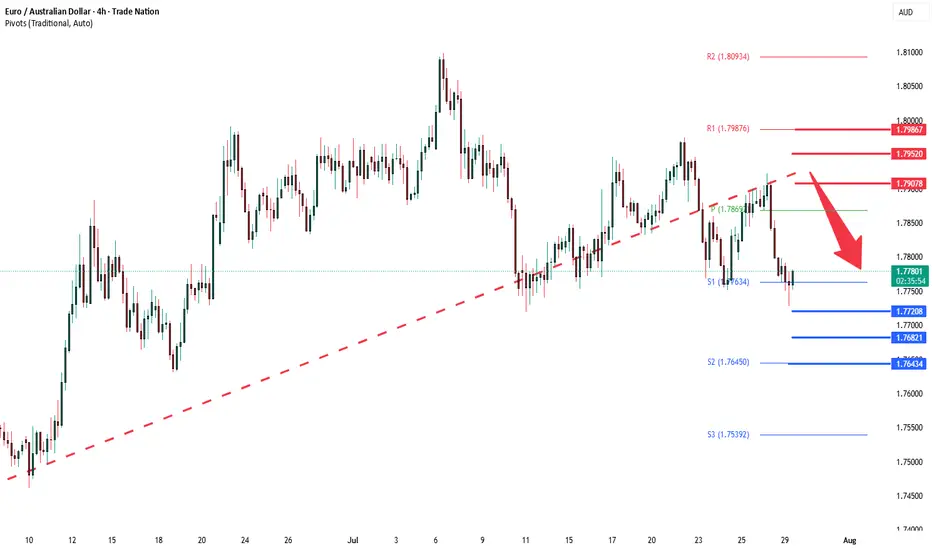
EURAUD oversold bounce backs capped at 1.7907The EURAUD pair is currently trading with a bearish bias, aligned with the broader range-bound sideway consolidation. Recent price action shows a retest of the resistance, (previous rising support)
Key resistance is located at 1.7907, a prior consolidation zone. This level will be critical in determining the next directional move.
A bearish rejection from 1.7907 could confirm the resumption of the downtrend, targeting the next support levels at 1.7720, followed by 1.7680 and 1.7643 over a longer timeframe.
Conversely, a decisive breakout and daily close above 1.7907 would invalidate the current bearish setup, shifting sentiment to bullish and potentially triggering a move towards 1.7950, then 1.7986.
Conclusion:
The short-term outlook remains bearish unless the pair breaks and holds above 1.7907. Traders should watch for price action signals around this key level to confirm direction. A rejection favours fresh downside continuation, while a breakout signals a potential trend reversal or deeper correction.
This communication is for informational purposes only and should not be viewed as any form of recommendation as to a particular course of action or as investment advice. It is not intended as an offer or solicitation for the purchase or sale of any financial instrument or as an official confirmation of any transaction. Opinions, estimates and assumptions expressed herein are made as of the date of this communication and are subject to change without notice. This communication has been prepared based upon information, including market prices, data and other information, believed to be reliable; however, Trade Nation does not warrant its completeness or accuracy. All market prices and market data contained in or attached to this communication are indicative and subject to change without notice.
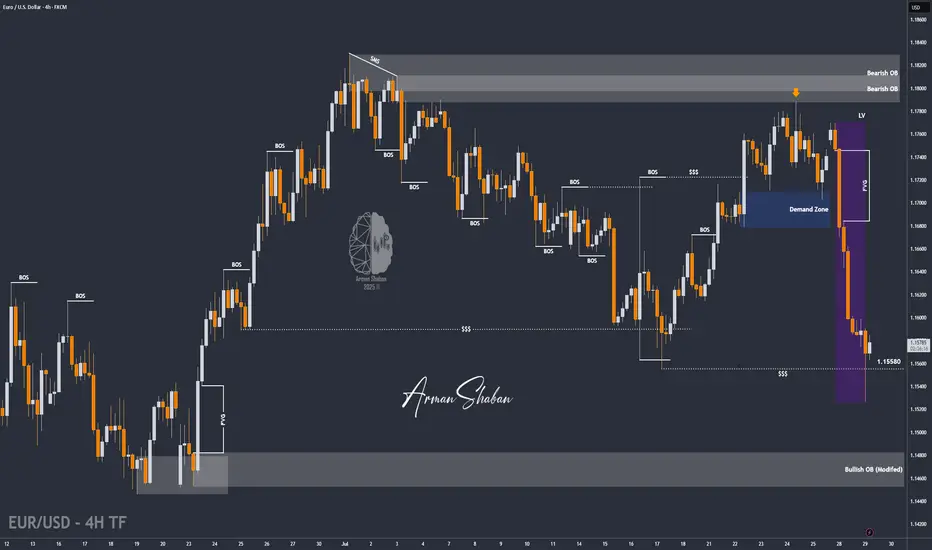
EUR/USD | Sweeps Liquidity and Rebounds – Eyes on 1.16700!By analyzing the EURUSD chart on the 4-hour timeframe, we can see that after our previous analysis, the price continued its decline and eventually swept the liquidity below 1.15580. Following that, strong demand kicked in, and the pair is currently trading around 1.15810. If the price can hold above this level, we can expect further bullish movement. The next potential targets are 1.1600, 1.16280, 1.16430, and 1.16700.
Please support me with your likes and comments to motivate me to share more analysis with you and share your opinion about the possible trend of this chart with me !
Best Regards , Arman Shaban
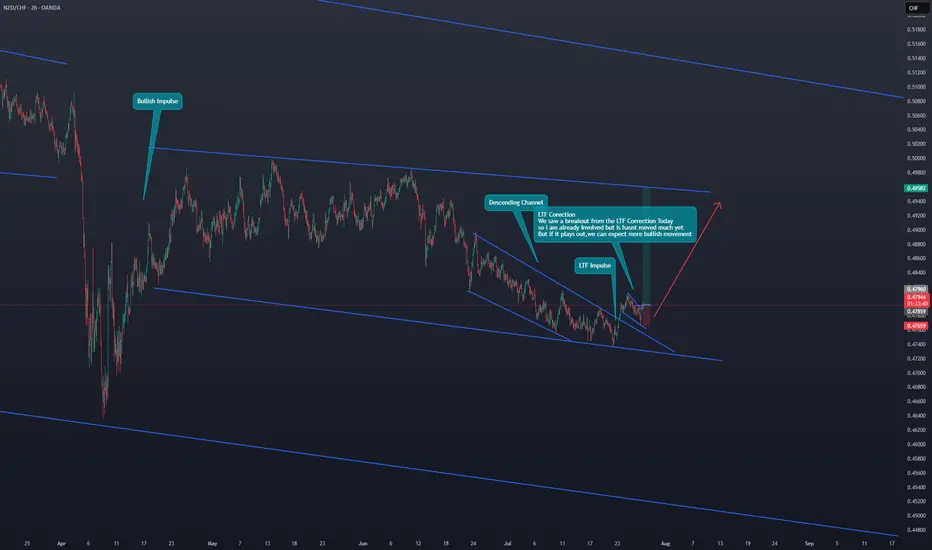
NZD/CHF Bullish move to expectWe saw a breakout from the LTF Correction Today
so i am already Involved but is hasnt moved much yet.
But if it plays out,we can expect more bullish movement
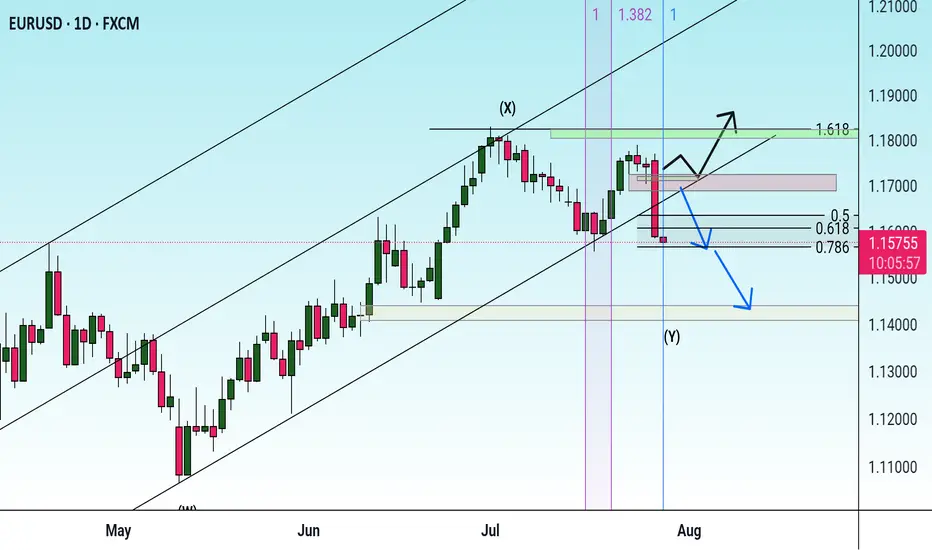
Euro Drops Hard — Is a 100-Pips Slide Toward 1.1500 Next?Euro’s current situation doesn’t look great — we’re clearly seeing strong selling pressure across the board.
Price has now reached the block zones near 1.1600, and I want to break down what this area means to me.
The lower pivot of the 1.1600 zone was created after the 50% level of the previous bullish leg was consumed — which is typical in many bullish trends. Based on that, we expected a move toward 1.1800 to break the structure and continue the uptrend.
However, the recent bullish move lacked strength, which became quite clear during the last upward leg. And now, after that weak rally, we’re witnessing a sharp and aggressive selloff.
This reaction weakens the 1.1600 block in my eyes — and I’m now watching 1.1500 as the more probable target. It’s a major price level and also aligns with a bank-level midline zone.
In my view, it’s still too early to buy. I’d want to see price range and confirm before looking for longs.
That said, this area could be a good place to partially exit short positions and lock in some profits.
🔁 This analysis will be updated whenever necessary.
Disclaimer: This is not financial advice. Just my personal opinion!!!

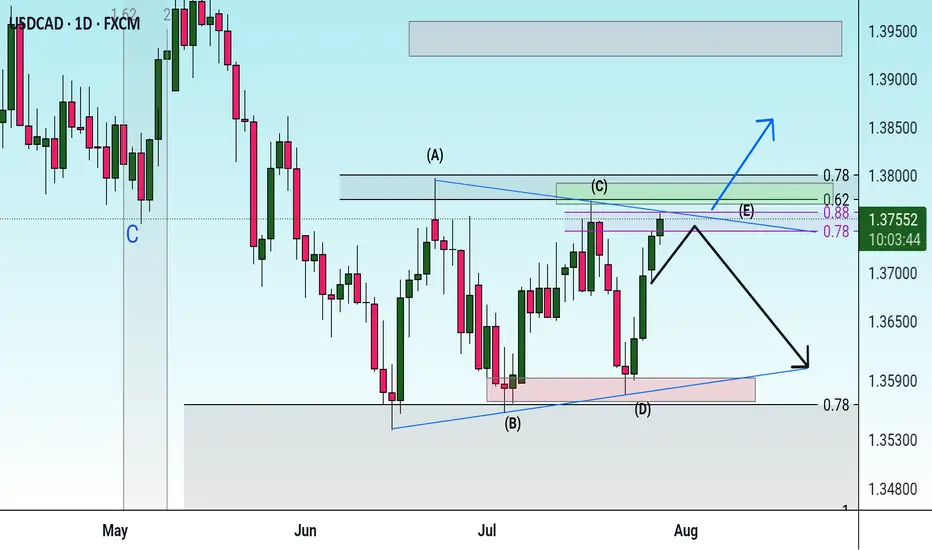
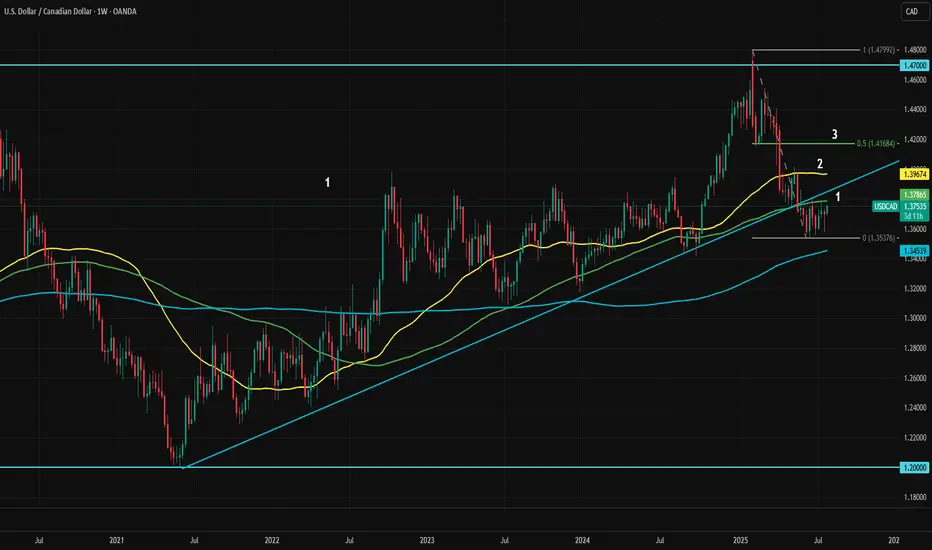
USDCAD Bounce May Face Strong ResistanceUSDCAD is attempting to bounce back, supported by a stronger U.S. dollar index. The recent trade deals with Japan and the Eurozone have prompted traders to position more favorably toward the dollar. The sharp decline in EURUSD is also putting upward pressure on USDCAD.
This week will be crucial for both the U.S. and Canada, with a flood of economic data and major central bank events ahead. The Federal Reserve and the Bank of Canada are both expected to hold rates at tomorrow’s meetings. Although pressure from Trump is unlikely to sway FOMC members into a rate cut, the new trade deals do reduce policy uncertainty, which could increase the likelihood of a rate cut in September. Any minor hint of this scenario will likely be interpreted as dovish by the markets.
The Bank of Canada, in contrast, is expected to remain firmly dovish as tariffs continue to weigh heavily on growth. Meanwhile, Trump’s recent comments regarding Canadian tariffs are unlikely to boost economic confidence in Canada, although Carney is actively pushing for an improved trade agreement.
Aside from central bank meetings, both countries will release GDP data this week. Canada’s economy is expected to contract by 0.1% in May, with GDP figures arriving alongside employment change and the U.S. PCE report. A strong surprise from Canada could help limit the effect of the rising dollar index on USDCAD.
In the U.S., GDP, PCE, and payrolls data will make this one of the most unpredictable weeks for markets in recent months.
USDCAD is currently testing its 100-week moving average. The immediate resistance levels are 1.3786 and 1.3850, both marked as “1” in the chart as the first resistance area. If dollar index strength continues after the initial shock, the second resistance zone defined by the May top and the 50-week moving average will become the next target.
If dollar dominance persists in the medium term, the ultimate target would be 1.4170. This area is likely to act as strong resistance, as it includes the midpoint of the March to July pullback, the 23.6% Fibonacci retracement level of the 2021 to 2025 uptrend, and the February dip.
As long as this resistance holds, any upward moves can be considered potential selling opportunities. However, it remains uncertain which of the resistance levels will mark the top.
EURCHF bearish continuation The EURCHF pair is currently trading with a bearish bias, aligned with the broader downward trend. Recent price action shows a retest of the falling resistance, suggesting a temporary relief rally within the downtrend.
Key resistance is located at 0.9340, a prior consolidation zone. This level will be critical in determining the next directional move.
A bearish rejection from 0.9340 could confirm the resumption of the downtrend, targeting the next support levels at 0.9300, followed by 0.9290 and 0.9270 over a longer timeframe.
Conversely, a decisive breakout and daily close above 0.9340 would invalidate the current bearish setup, shifting sentiment to bullish and potentially triggering a move towards 0.9355, then 0.9365.
Conclusion:
The short-term outlook remains bearish unless the pair breaks and holds above 0.9340. Traders should watch for price action signals around this key level to confirm direction. A rejection favours fresh downside continuation, while a breakout signals a potential trend reversal or deeper correction.
This communication is for informational purposes only and should not be viewed as any form of recommendation as to a particular course of action or as investment advice. It is not intended as an offer or solicitation for the purchase or sale of any financial instrument or as an official confirmation of any transaction. Opinions, estimates and assumptions expressed herein are made as of the date of this communication and are subject to change without notice. This communication has been prepared based upon information, including market prices, data and other information, believed to be reliable; however, Trade Nation does not warrant its completeness or accuracy. All market prices and market data contained in or attached to this communication are indicative and subject to change without notice.

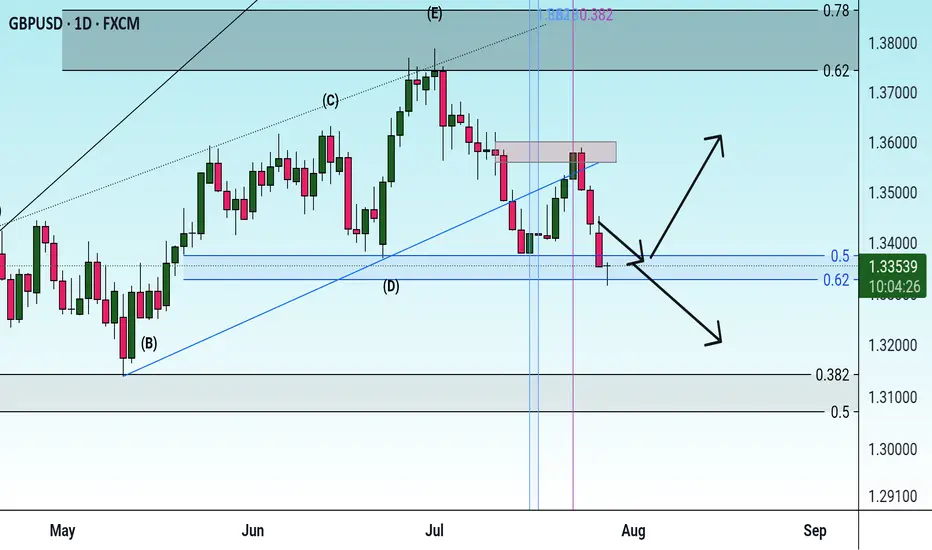
EURUSD corrective pullback support at 1.1526The EURUSD remains in a bullish trend, with recent price action showing signs of a corrective pullback within the broader uptrend.
Support Zone: 1.1526 – a key level from previous consolidation. Price is currently testing or approaching this level.
A bullish rebound from 1.1526 would confirm ongoing upside momentum, with potential targets at:
1.1714 – initial resistance
1.1810 – psychological and structural level
1.1885 – extended resistance on the longer-term chart
Bearish Scenario:
A confirmed break and daily close below 1.1526 would weaken the bullish outlook and suggest deeper downside risk toward:
1.1470 – minor support
1.1400 – stronger support and potential demand zone
Outlook:
Bullish bias remains intact while the EURUSD holds above 1.1526. A sustained break below this level could shift momentum to the downside in the short term.
This communication is for informational purposes only and should not be viewed as any form of recommendation as to a particular course of action or as investment advice. It is not intended as an offer or solicitation for the purchase or sale of any financial instrument or as an official confirmation of any transaction. Opinions, estimates and assumptions expressed herein are made as of the date of this communication and are subject to change without notice. This communication has been prepared based upon information, including market prices, data and other information, believed to be reliable; however, Trade Nation does not warrant its completeness or accuracy. All market prices and market data contained in or attached to this communication are indicative and subject to change without notice.
