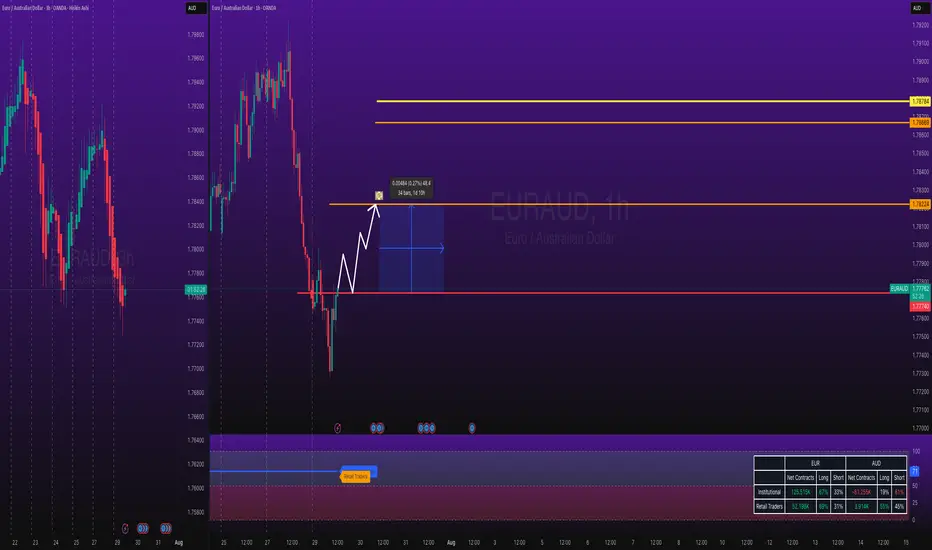
EURAUD Long - Pullback from Monthly Support - Easy MoneyOANDA:EURAUD Long Trade.
EURUSD is Bouncing Back from Monthly Support.
Note: Manage your risk yourself, its risky trade, see how much your can risk yourself on this trade.
Don't be greedy.
Use proper risk management
Looks like good trade.
Lets monitor.
Use proper risk management.
Disclaimer: only idea, not advice
Forex market
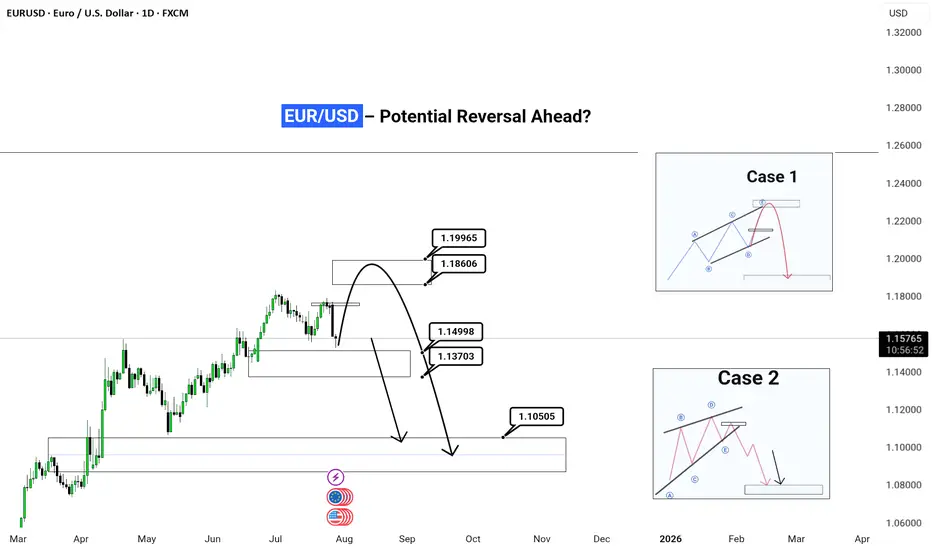
EUR/USD – Potential Reversal Ahead?| Daily Timeframe | Outlook (Published July 29, 2025)
⚠️ Setup Summary:
This chart is highlighting a critical juncture for EUR/USD, where price is nearing a major decision zone. Based on price action and wave structure, there are two likely scenarios unfolding. Let’s break it down simple .
EUR/USD has seen a strong bullish rally from March to July, but current price action suggests momentum exhaustion. Now, we’re watching for signs of a reversal or deeper correction in the coming weeks.
📊 Two Probable Scenarios:
✅ Case 1 – Simple Corrective Wave (ABC Pattern)
Expected Move:
Price may spike up into the 1.186–1.199 zone (final bull trap/liquidity grab)
Followed by a sharp bearish move (impulse C wave) towards 1.10505 zone
This reflects a clean correction before possible reaccumulation
📌 This is often seen after retail traders get caught chasing highs late in a move.
---
✅ Case 2 – Complex Corrective Wave (ABCDE Flat/Running Triangle)
Expected Move:
A longer, more sideways and choppy correction into Q1 2026
Price forms a distribution pattern under resistance
After a breakout below the structure, a sharp drop to 1.10505 zone (or deeper)
📌 This is a slower bleed-out pattern before continuation lower. Often traps both buyers and sellers in the chop.
---
🎯 Current Price: 1.15756
We are in a decision zone, and watching the reaction around 1.165–1.186 will be crucial to validate either Case 1 or Case 2.
---
💡 My View:
> Wait for confirmation at the 1.186 zone.
If price rejects strongly from there, Case 1 is in play. 👈❤️
If price chops sideways and holds higher for weeks, expect Case 2 structure.
---
🚨 Reminder for Traders:
Don’t chase moves — let the market show its hand
Use proper risk management
Combine this structure with session timing, liquidity sweeps, and fundamental events
---
💬 Drop a comment if you're seeing similar setups in other majors!
🧠 Follow for real-time updates & actionable setups.
#EURUSD #ForexAnalysis #WaveTheory #SmartMoney #OrderBlock #LiquidityHunt #ForexStrategy #ElliottWave #PriceAction #FXTrader #TradingView
---
EURUSD Long Trade - Bounce Back from Monthly SupportFX:EURUSD Long Trade.
EURUSD is Bouncing Back from Monthly Support.
Note: Manage your risk yourself, its risky trade, see how much your can risk yourself on this trade.
Don't be greedy.
Use proper risk management
Looks like good trade.
Lets monitor.
Use proper risk management.
Disclaimer: only idea, not advice

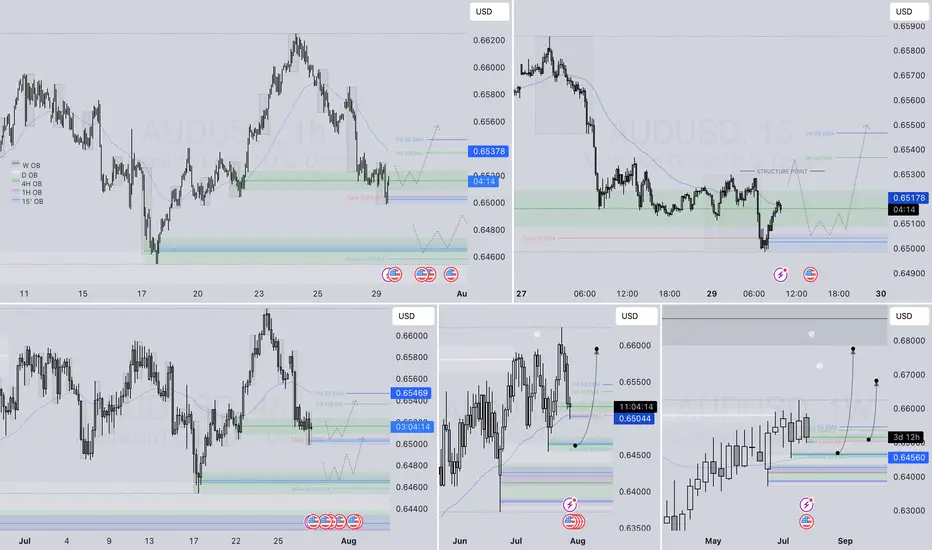
AUDUSD – DAILY FORECAST Q3 | W31 | D29 | Y25📊 AUDUSD – DAILY FORECAST
Q3 | W31 | D29 | Y25
Daily Forecast 🔍📅
Here’s a short diagnosis of the current chart setup 🧠📈
Higher time frame order blocks have been identified — these are our patient points of interest 🎯🧭.
It’s crucial to wait for a confirmed break of structure 🧱✅ before forming a directional bias.
This keeps us disciplined and aligned with what price action is truly telling us.
📈 Risk Management Protocols
🔑 Core principles:
Max 1% risk per trade
Only execute at pre-identified levels
Use alerts, not emotion
Stick to your RR plan — minimum 1:2
🧠 You’re not paid for how many trades you take, you’re paid for how well you manage risk.
🧠 Weekly FRGNT Insight
"Trade what the market gives, not what your ego wants."
Stay mechanical. Stay focused. Let the probabilities work.
FX:AUDUSD
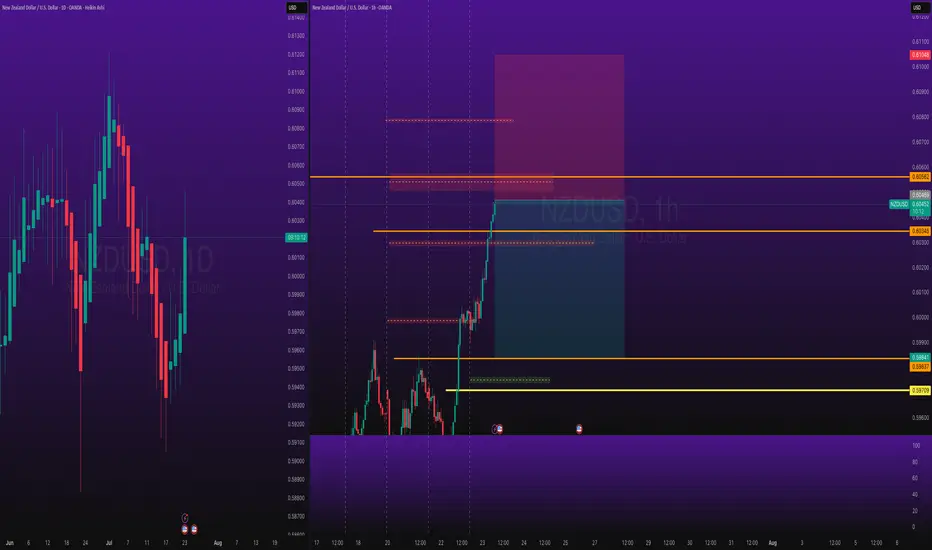
NZDUSD Short SwingOANDA:NZDUSD Short Swing Trade, with my back testing of this strategy, it hits multiple possible take profits, manage your position accordingly.
This is good trade, don't overload your risk like greedy, be disciplined trader.
I manage trade on daily basis.
this is good trade, lets see, don't be greedy, risk what you can afford.
Use proper risk management
Looks like good trade.
Lets monitor.
Use proper risk management.
Disclaimer: only idea, not advice
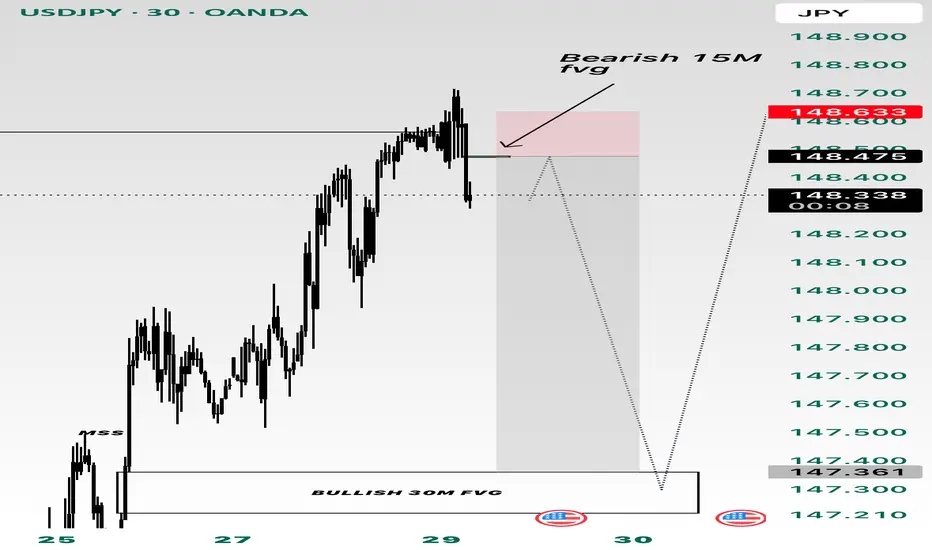
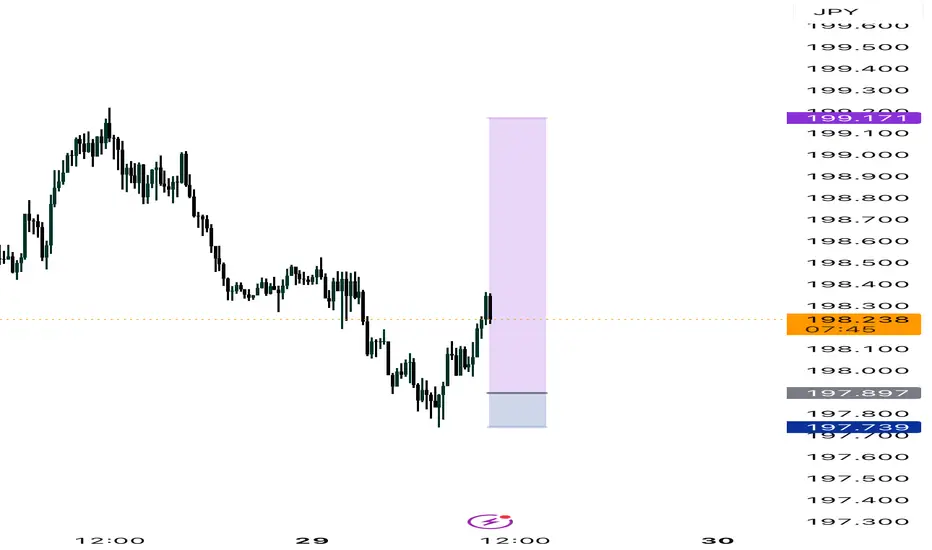
USDJPY USDJPY has reached liquidity level on the higher timeframe. A bearish 15M FVG has formed and I’m going to short to the 30/1H FVG gap. And then look for long positions
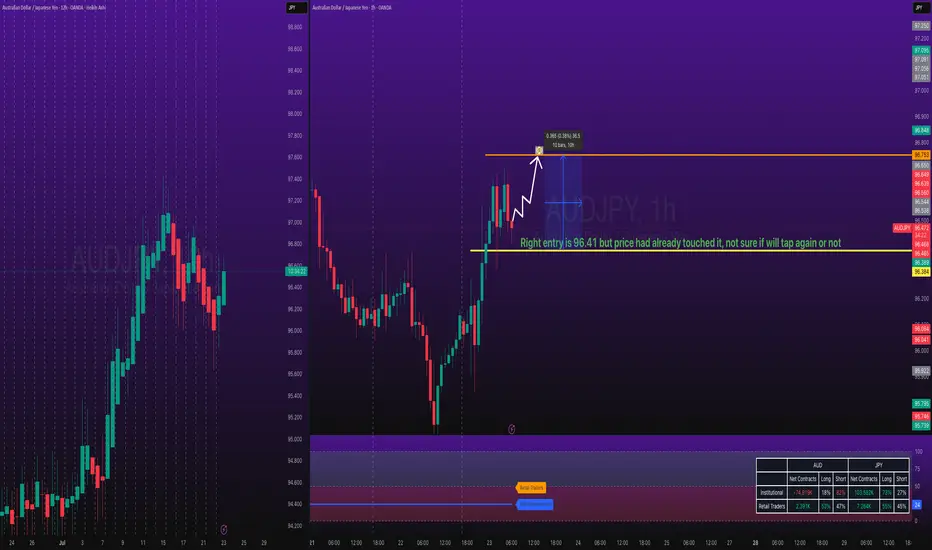
AUDJPY Long TradeOANDA:AUDJPY Long Trade.
Entry price is already tapped in, I checked chart late, TP is intact, you can take little risk if you can afford.
Note: Manage your risk yourself, its risky trade, see how much your can risk yourself on this trade.
Don't be greedy.
Use proper risk management
Looks like good trade.
Lets monitor.
Use proper risk management.
Disclaimer: only idea, not advice
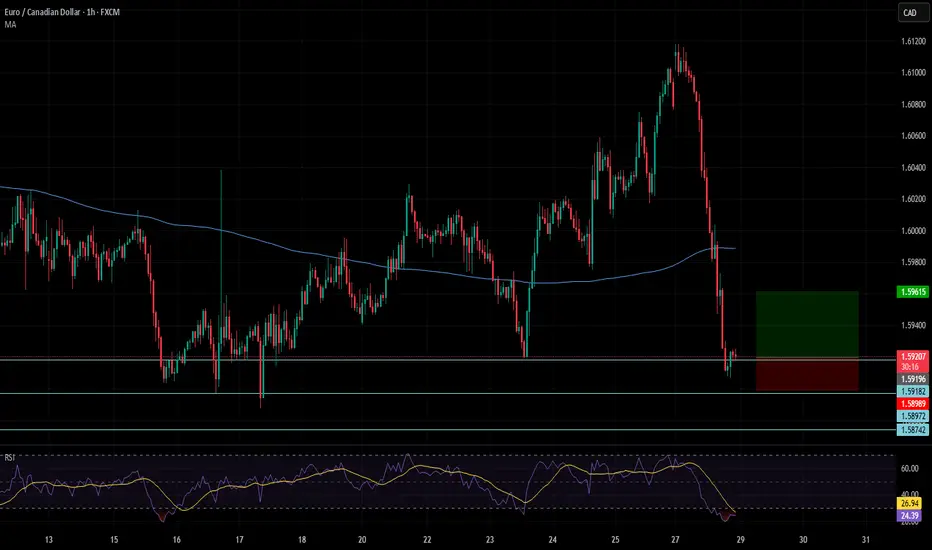
EURCAD 1H longEURCAD 1 H made a beatiful sharp drop, now stalling arround some good support levels.
When such a drop happens with no pullback formed yet I'm happy to buy the way down.
Because the pullback has to come soon buyers step in at the support levels.
My plan is simple I open a manual grid at the support levels I draw and aim for a 2R profit
Current grid 3 levels
1 market order
2 buy limits
Tp 2R
extra confirmation RSI is oversold
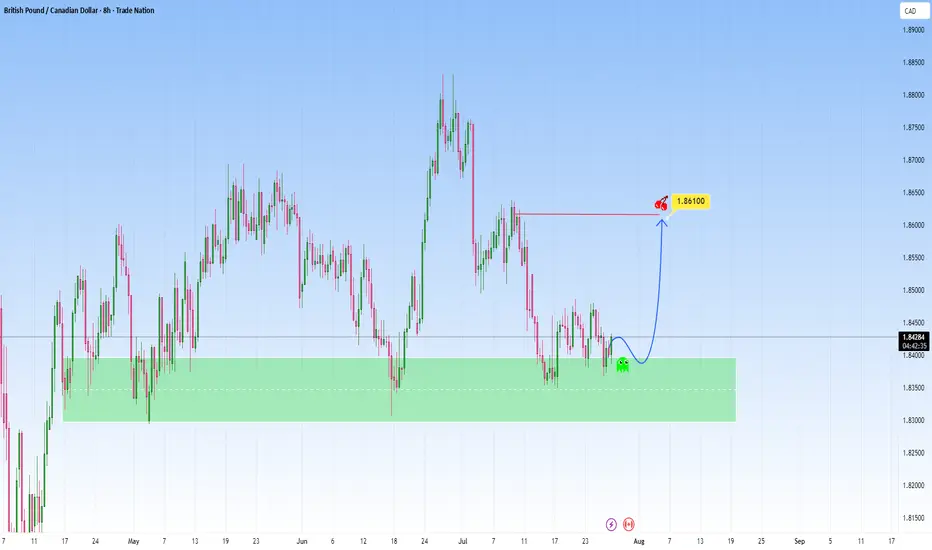
GBPCAD At Support - High probability reversalGBPCAD descended with strength, and has now reached a strong support zone.
Price now hovers above and this zone and is a great indication to use for possible reversal move, that could send price into the 1.86100 level.
But if price breaks below support with momentum, then I’ll back off this bullish bias and reassess, and consider the reversal idea invalidated, with potential for further downside.
Just sharing my thoughts for the charts, this isn’t financial advice. Always confirm your setups and manage your risk properly.
Disclosure: I am part of Trade Nation's Influencer program and receive a monthly fee for using their TradingView charts in my analysis.
USDCAD USDCAD has entered a range since the start of June.
retesting very strong resistance levels again.
creating a rising wedge reversal at this key high level of resistance.
looking for a sell off

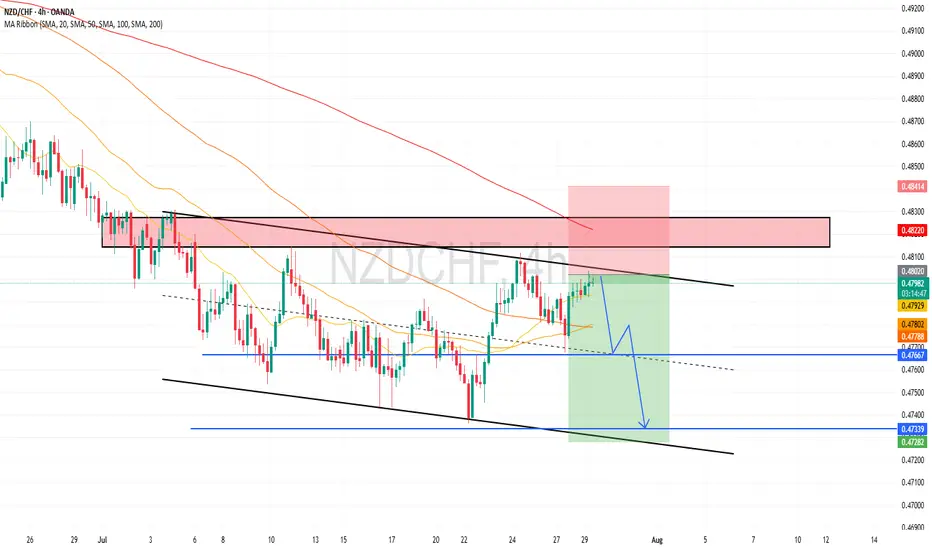
NZDCHF is in the Bearish Side due to Bearish TrendHello Traders
In This Chart NZDCHF HOURLY Forex Forecast By FOREX PLANET
today NZDCHF analysis 👆
🟢This Chart includes_ (NZDCHF market update)
🟢What is The Next Opportunity on NZDCHF Market
🟢how to Enter to the Valid Entry With Assurance Profit
This CHART is For Trader's that Want to Improve Their Technical Analysis Skills and Their Trading By Understanding How To Analyze The Market Using Multiple Timeframes and Understanding The Bigger Picture on the Chart
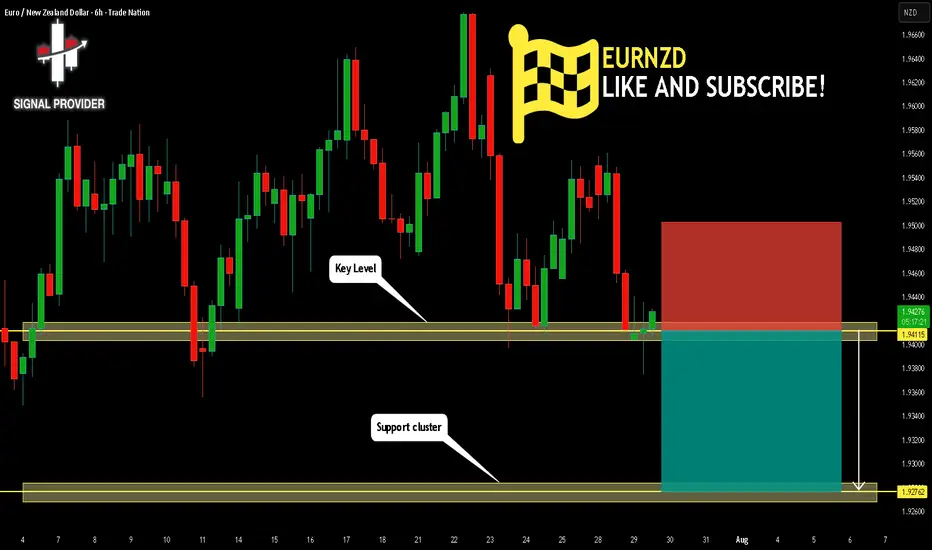
EURNZD Will Go Down From Resistance! Short!
Here is our detailed technical review for EURNZD.
Time Frame: 6h
Current Trend: Bearish
Sentiment: Overbought (based on 7-period RSI)
Forecast: Bearish
The market is on a crucial zone of supply 1.941.
The above-mentioned technicals clearly indicate the dominance of sellers on the market. I recommend shorting the instrument, aiming at 1.927 level.
P.S
We determine oversold/overbought condition with RSI indicator.
When it drops below 30 - the market is considered to be oversold.
When it bounces above 70 - the market is considered to be overbought.
Disclosure: I am part of Trade Nation's Influencer program and receive a monthly fee for using their TradingView charts in my analysis.
Like and subscribe and comment my ideas if you enjoy them!
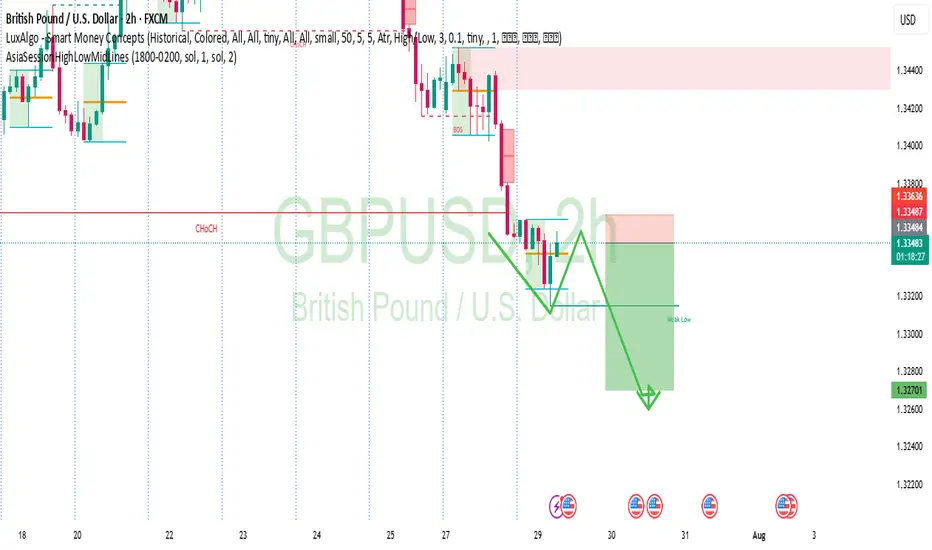
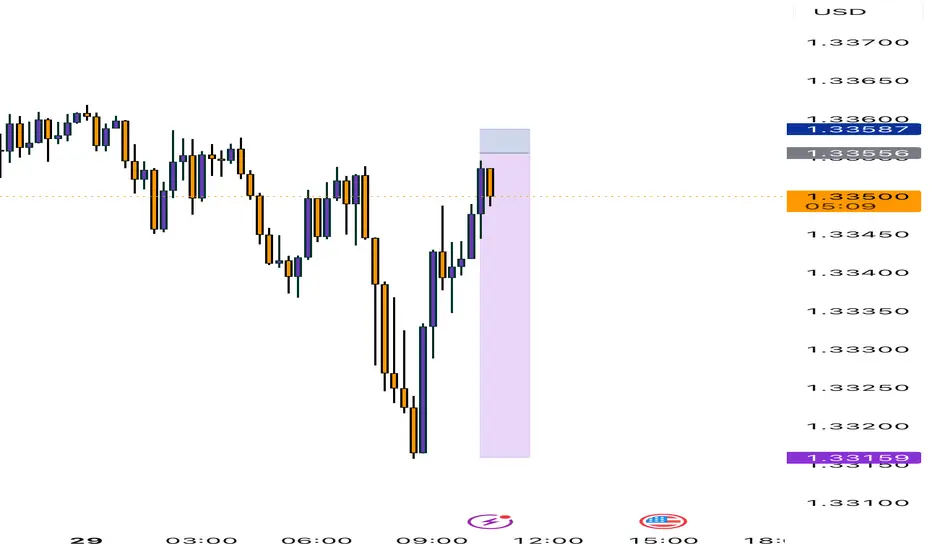
idea GBPUSDmorning everyone, i continue sell for next hours, i think good mommentum, entry was in 3 min. and we search aroun 60-80 points
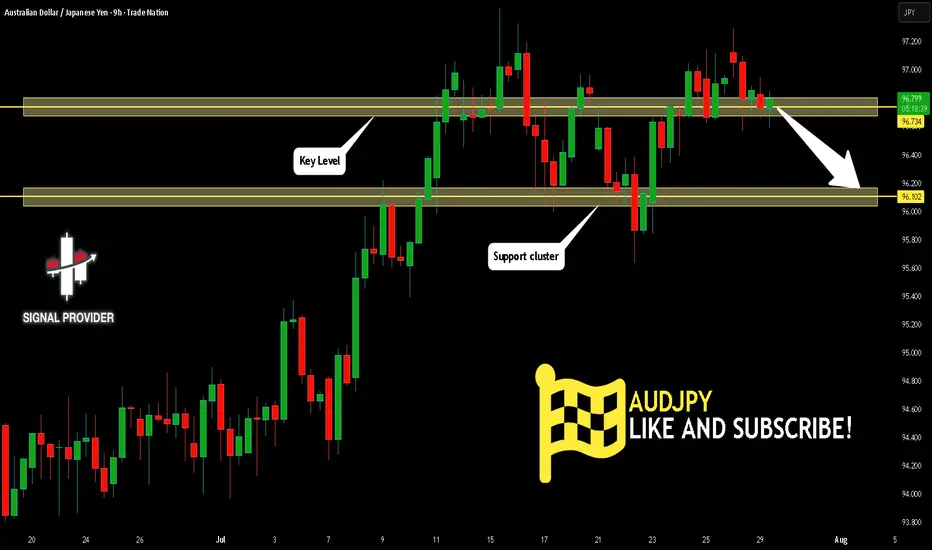
AUDJPY Will Go Lower! Sell!
Take a look at our analysis for AUDJPY.
Time Frame: 9h
Current Trend: Bearish
Sentiment: Overbought (based on 7-period RSI)
Forecast: Bearish
The price is testing a key resistance 96.734.
Taking into consideration the current market trend & overbought RSI, chances will be high to see a bearish movement to the downside at least to 96.102 level.
P.S
Overbought describes a period of time where there has been a significant and consistent upward move in price over a period of time without much pullback.
Disclosure: I am part of Trade Nation's Influencer program and receive a monthly fee for using their TradingView charts in my analysis.
Like and subscribe and comment my ideas if you enjoy them!
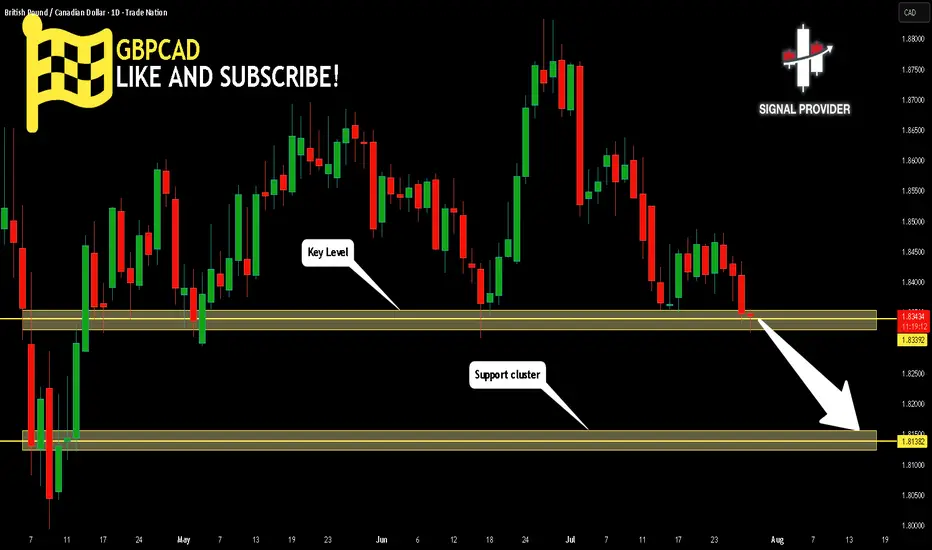
GBPCAD Will Go Down! Short!
Please, check our technical outlook for GBPCAD.
Time Frame: 1D
Current Trend: Bearish
Sentiment: Overbought (based on 7-period RSI)
Forecast: Bearish
The market is trading around a solid horizontal structure 1.833.
The above observations make me that the market will inevitably achieve 1.813 level.
P.S
Please, note that an oversold/overbought condition can last for a long time, and therefore being oversold/overbought doesn't mean a price rally will come soon, or at all.
Disclosure: I am part of Trade Nation's Influencer program and receive a monthly fee for using their TradingView charts in my analysis.
Like and subscribe and comment my ideas if you enjoy them!
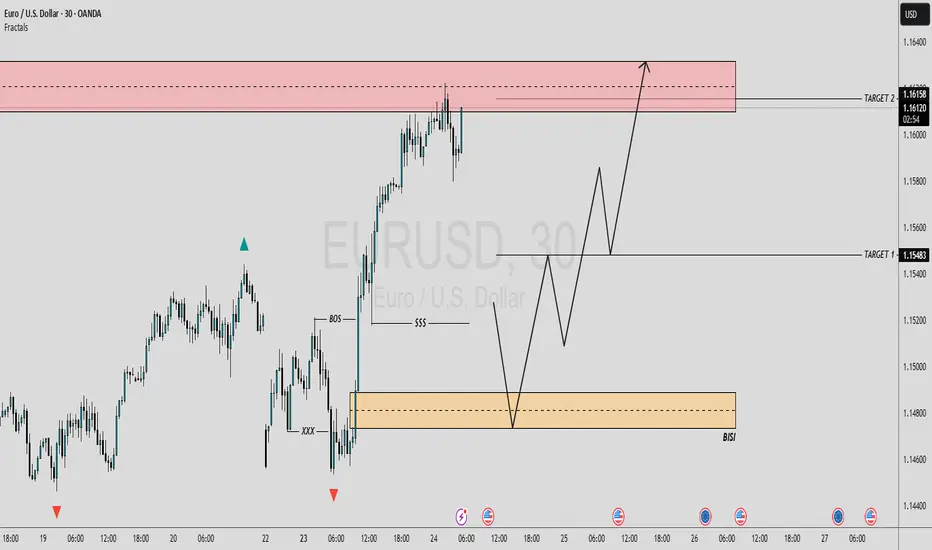
EUR/USD 30-MIN ANALYSISThis EURUSD setup showcases a clean bullish continuation scenario following a confirmed Break of Structure (BOS) and a sharp rally driven by momentum and liquidity imbalance.
After sweeping a key low (XXX), price impulsively broke structure to the upside, confirming a potential shift in market intent. A retracement is now expected to mitigate the Buy-Side Imbalance (BISI) zone.
BOS & SSS (Short-Term Structural Shift): Confirmed bullish intent.
Imbalance (BISI): Price left behind an unfilled imbalance zone a likely magnet for a pullback.
Re-Entry Zone: (BISI) provides a high probability area for long re-entry.
Upside Targets:
Target 1: 1.15483 – intermediate structural level.
Target 2: 1.16158 – premium supply / liquidity target.
#EURUSD 30M Technical Analysis Expected Move.
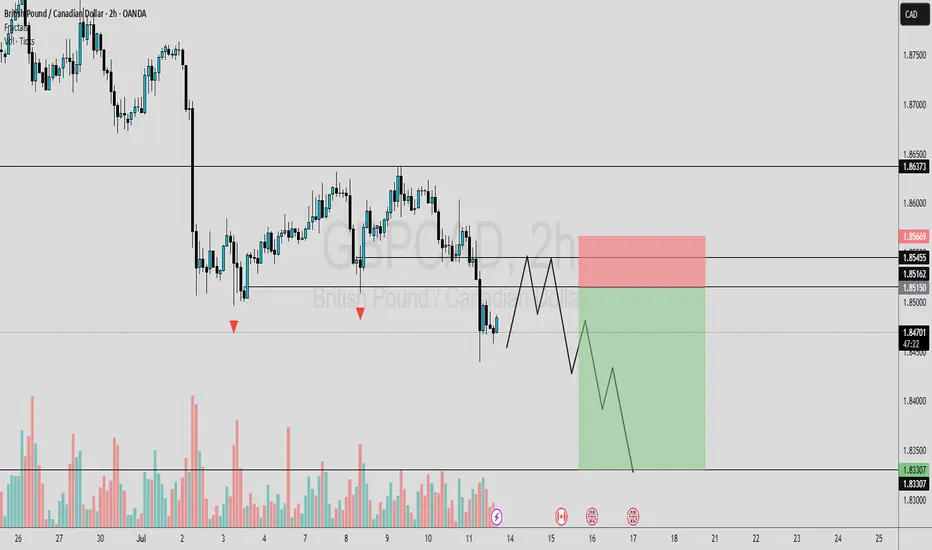
GBPCAD OUTLOOKIn this analysis we're focusing on 2H time frame for finding possible upcoming movement in price. So as per my strategy today I'm looking for a sell trade opportunity. Confirmation is very important, after confirmation we'll execute our trade. Let's see which opportunity market will give us.
Always use stoploss for your trade.
Always use proper money management and proper risk to reward ratio.
This is my prediction.
#GBPCAD 1H Technical Analysis Expected Move.

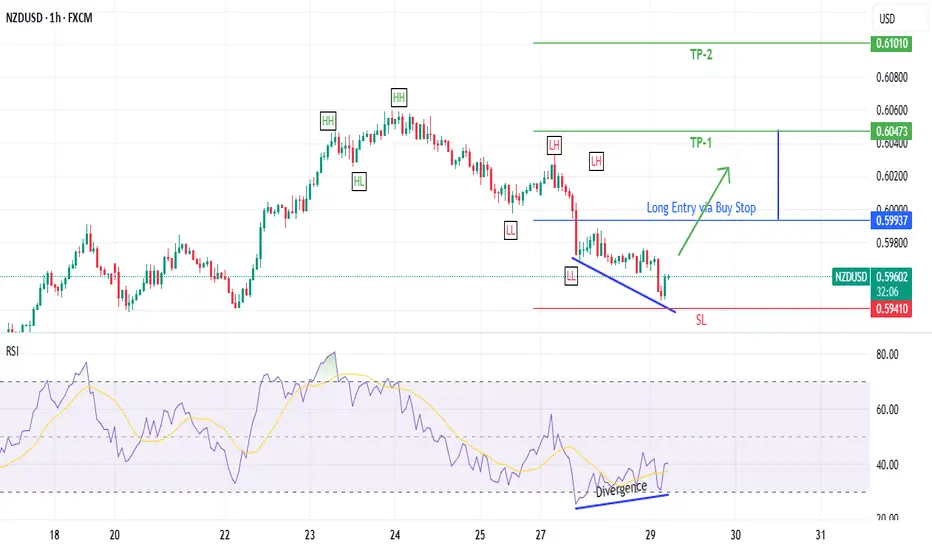
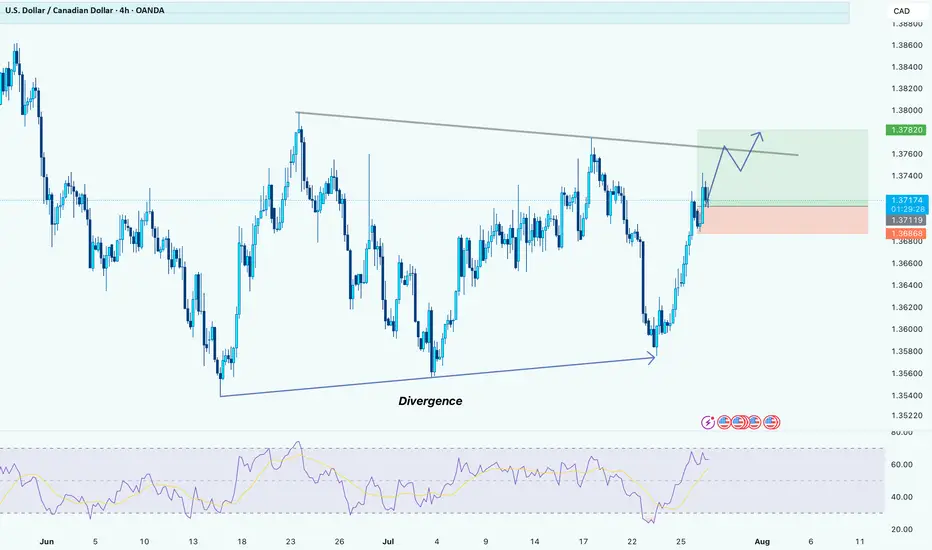
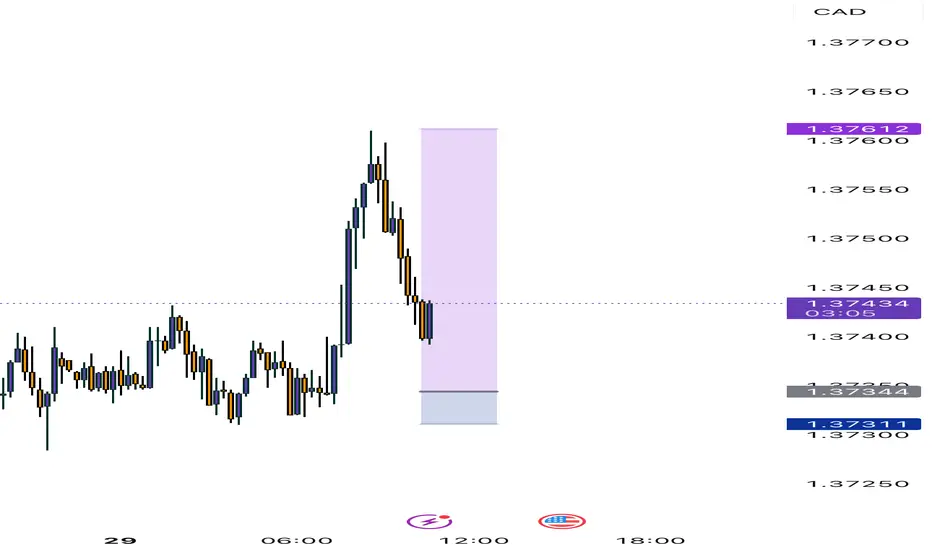
USDCAD: a long positionHello guys.
Divergence:
A bullish RSI divergence is noted, price made lower lows while RSI formed higher lows, signaling a potential bullish reversal.
Price Action:
Price has bounced strongly from around the 1.3570–1.3580 zone and is now approaching a descending trendline resistance.
Trade Setup:
Entry: 1.3718
Stop Loss: Below the breakout candle, near 1.3686
Take Profit: Around 1.3782
Risk-to-Reward: 1:3