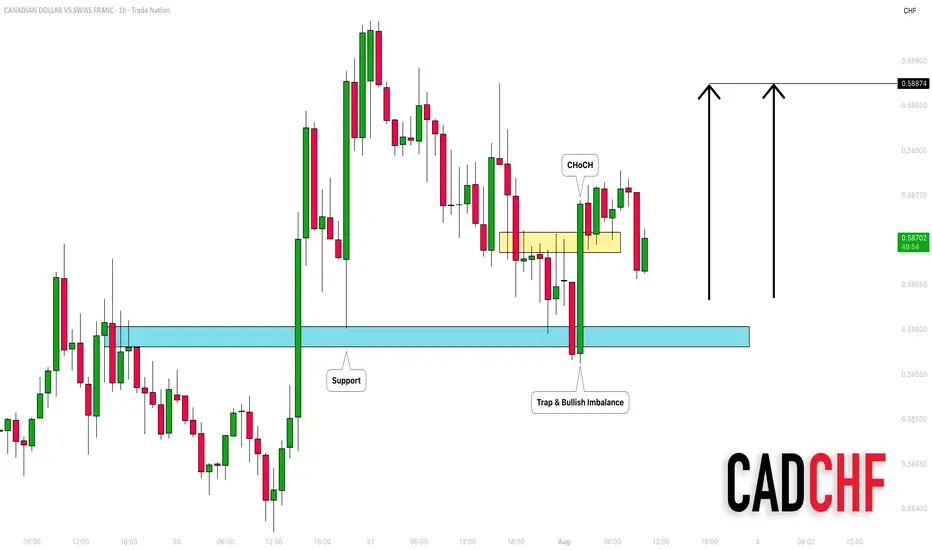
CADCHF: Bullish Move After the Trap 🇨🇦🇨🇭
There is a high chance that CADCHF will go up today.
After a test of a key horizontal support, the price formed
a liquidity grab with a consequent bullish imbalance.
We can expect growth to 0.5887
❤️Please, support my work with like, thank you!❤️
I am part of Trade Nation's Influencer program and receive a monthly fee for using their TradingView charts in my analysis.
Forex market
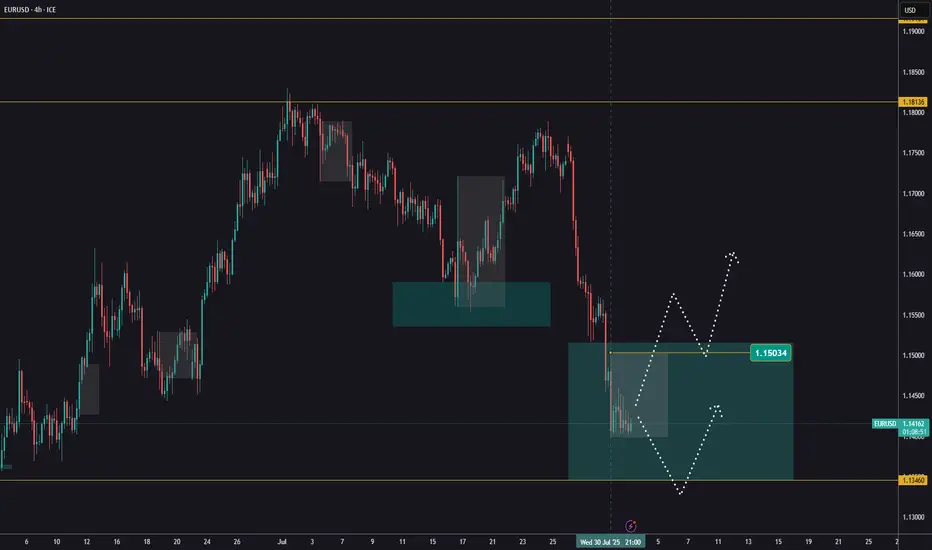
EURUSD ahead of NFPEURUSD is still trading within the range established after Wednesday’s news.
We’re watching for a close above 1,1503, which would confirm a potential buying opportunity.
Today at 1:30 PM (London), the NFP data will be released, which could further impact price action - especially if a reversal is underway.
In case of a decline, the next key support level to watch is around 1,1346.
USDJPY I Technical and Fundamental Analysis Welcome back! Let me know your thoughts in the comments!
** USDJPY Analysis - Listen to video!
We recommend that you keep this on your watchlist and enter when the entry criteria of your strategy is met.
Please support this idea with a LIKE and COMMENT if you find it useful and Click "Follow" on our profile if you'd like these trade ideas delivered straight to your email in the future.
Thanks for your continued support!

eurusd Short position sell 20 to 30 pips Eur usd short position sell 20 to 30 pips .
If you want to learn this analysis system free free contrect with me .
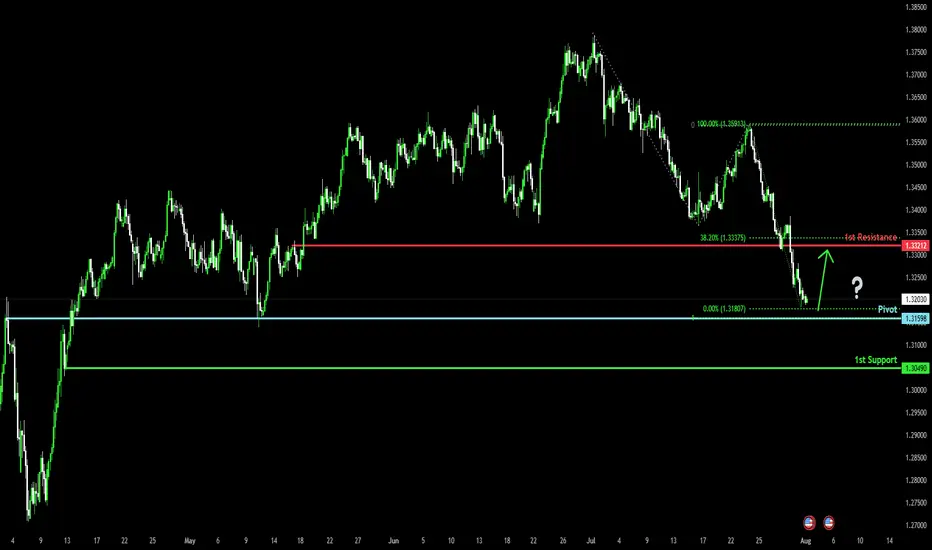
Bullish reversal off overlap support?The Cable (GBP/USD) is falling towards the pivot and could bounce to the 1st resistance, which is a pullback resistance that is slightly below the 38.2% Fibonacci retracement.
Pivot: 1.3159
1st Support: 1.3049
1st Resistance: 1.3321
Risk Warning:
Trading Forex and CFDs carries a high level of risk to your capital and you should only trade with money you can afford to lose. Trading Forex and CFDs may not be suitable for all investors, so please ensure that you fully understand the risks involved and seek independent advice if necessary.
Disclaimer:
The above opinions given constitute general market commentary, and do not constitute the opinion or advice of IC Markets or any form of personal or investment advice.
Any opinions, news, research, analyses, prices, other information, or links to third-party sites contained on this website are provided on an "as-is" basis, are intended only to be informative, is not an advice nor a recommendation, nor research, or a record of our trading prices, or an offer of, or solicitation for a transaction in any financial instrument and thus should not be treated as such. The information provided does not involve any specific investment objectives, financial situation and needs of any specific person who may receive it. Please be aware, that past performance is not a reliable indicator of future performance and/or results. Past Performance or Forward-looking scenarios based upon the reasonable beliefs of the third-party provider are not a guarantee of future performance. Actual results may differ materially from those anticipated in forward-looking or past performance statements. IC Markets makes no representation or warranty and assumes no liability as to the accuracy or completeness of the information provided, nor any loss arising from any investment based on a recommendation, forecast or any information supplied by any third-party.
USDCHF--Short--short term bearish possibility
--strong reaction from monthly resistance around 0.8180
-- lets look at two case. CASE1)Tendency is bearsih. then price will fall. CASE-2) Tendency is bullish.Even if the price will rise later, first it will pullback to 0.7978 level then rise.

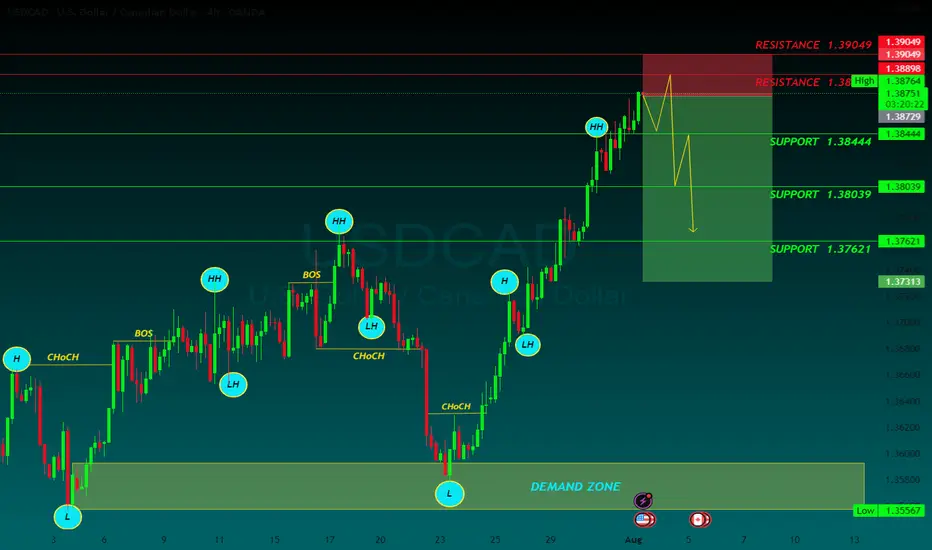
USDCAD SELLUSD/CAD rallies further, approaches 1.3900 on higher levies to Canada
The US Dollar keeps marching higher, as the Canadian Dollar struggles after Trump decided to increase tariffs to Canada to 35% from the previous 25%, escalating the trading tension with one of its main trading partners. The US President justified his decision on Canada’s alleged reluctance to cooperate on curbing the traffic of fentanyl and other drugs across the US border
The year will be politically marked by Trump’s return to the White House. A Republican government is seen as positive for financial markets, but Trump’s pledge to cut taxes and impose tariffs on foreign goods and services may introduce uncertainty to both the political and economic landscape.
Canada’s political crisis peaked in late 2024 with a no-confidence vote against Prime Minister Justin Trudeau, leading to snap elections and a weakened Liberal minority government. Policy uncertainty and economic challenges dominate 2025’s outlook, raising concerns over market stability and investor confidence.
The BoC is set to continue easing interest rates through 2025, at least at a faster pace than the Fed is expected to, which could apply pressure on CAD’s already-rising rate differential.
SUPPORT 1.38444
SUPPORT 1.38039
SUPPORT 1.37621
RESISTANCE 1.38889
RESISTANCE 1.39049
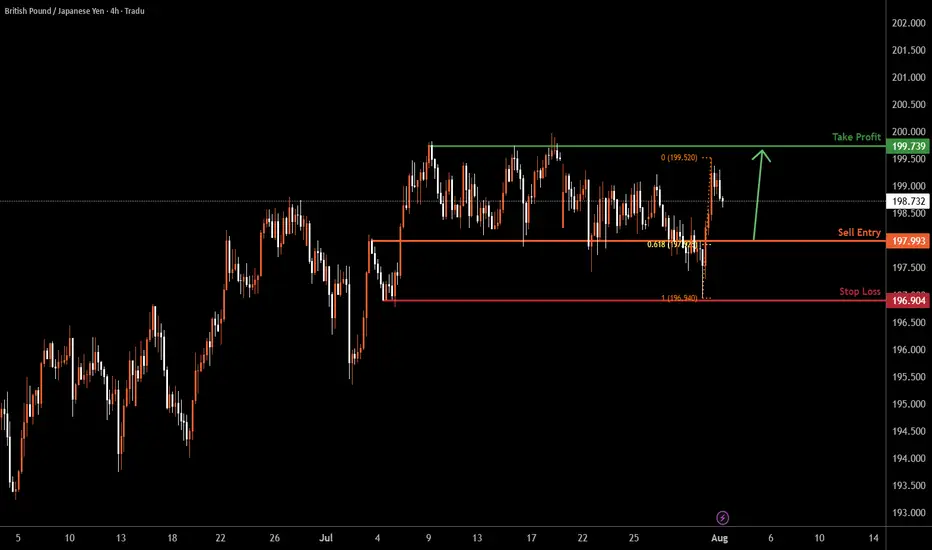
GBP/JPY H4 | Bullish bounce offGBP/JPY is falling towards the buy entry, which is an overlap support that lines up with the 61.8% Fibonacci retracement and could bounce to the take profit.
Buy entry is at 197.99, which is an overlap support that aligns with the 61.8% Fibonacci retracement.
Stop loss is at 196.90, which is a swing low support.
Take profit is at 199.73, which is a multi-swing high resistance.
High Risk Investment Warning
Trading Forex/CFDs on margin carries a high level of risk and may not be suitable for all investors. Leverage can work against you.
Stratos Markets Limited (tradu.com ):
CFDs are complex instruments and come with a high risk of losing money rapidly due to leverage. 65% of retail investor accounts lose money when trading CFDs with this provider. You should consider whether you understand how CFDs work and whether you can afford to take the high risk of losing your money.
Stratos Europe Ltd (tradu.com ):
CFDs are complex instruments and come with a high risk of losing money rapidly due to leverage. 66% of retail investor accounts lose money when trading CFDs with this provider. You should consider whether you understand how CFDs work and whether you can afford to take the high risk of losing your money.
Stratos Global LLC (tradu.com ):
Losses can exceed deposits.
Please be advised that the information presented on TradingView is provided to Tradu (‘Company’, ‘we’) by a third-party provider (‘TFA Global Pte Ltd’). Please be reminded that you are solely responsible for the trading decisions on your account. There is a very high degree of risk involved in trading. Any information and/or content is intended entirely for research, educational and informational purposes only and does not constitute investment or consultation advice or investment strategy. The information is not tailored to the investment needs of any specific person and therefore does not involve a consideration of any of the investment objectives, financial situation or needs of any viewer that may receive it. Kindly also note that past performance is not a reliable indicator of future results. Actual results may differ materially from those anticipated in forward-looking or past performance statements. We assume no liability as to the accuracy or completeness of any of the information and/or content provided herein and the Company cannot be held responsible for any omission, mistake nor for any loss or damage including without limitation to any loss of profit which may arise from reliance on any information supplied by TFA Global Pte Ltd.
The speaker(s) is neither an employee, agent nor representative of Tradu and is therefore acting independently. The opinions given are their own, constitute general market commentary, and do not constitute the opinion or advice of Tradu or any form of personal or investment advice. Tradu neither endorses nor guarantees offerings of third-party speakers, nor is Tradu responsible for the content, veracity or opinions of third-party speakers, presenters or participants.
100% Guaranteed EURUSD Long time buy Position .Eur Usd long time buy position . Next profit will be 50 to 100 pips .
Take 1st tp 50 pips and wait for next 100 pips
If you have any question fell free ask my any question
Technical Analysis: GBP/CHF (British Pound / Swiss Franc)Timeframe: Hourly (H1) – *Data as of Aug 01, 2025, 14:33 UTC+4*
Source: OANDA via TradingView
1. Key Price Levels
Current Price (C): 1.07357 (+0.09% from previous close).
High/Low (H/L): 1.07386 / 1.07308 (narrow range, indicating consolidation).
Resistance Levels:
R1: 1.07514 (near-term resistance).
R2: 1.08208 (stronger resistance).
Pivot Point (P): 1.07723 (intraday benchmark).
2. Price Action & Trends
Short-Term Trend: Slightly bullish (+0.09% gain), but trading near the day’s low (1.07308).
Volatility: Low (tight range between 1.07308–1.07386).
Support Zone: 1.07200–1.07335 (critical for bearish reversals).
3. Technical Indicators (Implied)
Pivot Points (PVC): Price is below the pivot (1.07723), suggesting bearish pressure unless it breaks above.
Resistance/Support:
Bulls need to push above R1 (1.07514) to target R2 (1.08208).
Bears aim for S1 (1.07335) or lower (1.07200).
4. Trading Signals
Bullish Scenario: Break above 1.07514 (R1) could signal upward momentum toward 1.07723 (Pivot).
Bearish Scenario: Drop below 1.07308 (today’s low) may extend losses to 1.07200.
Neutral Zone: Price oscillating between 1.07308–1.07386 suggests indecision.
5. Risk Management
Stop-Loss (S/L): Below 1.07200 for longs; above 1.07514 for shorts.
Take-Profit (T/P):
Longs: 1.07723 (Pivot) or 1.08000 (psychological level).
Shorts: 1.07200 or 1.07000.
6. Conclusion
Current Bias: Neutral-to-slightly bullish, but lacks strong momentum.
Watch For: Breakout from the 1.07308–1.07514 range for directional clarity.
Caution: Low volatility may lead to false breakouts; confirm with volume/RSI if available.
Recommendation: Wait for a confirmed breakout with volume before entering trades.

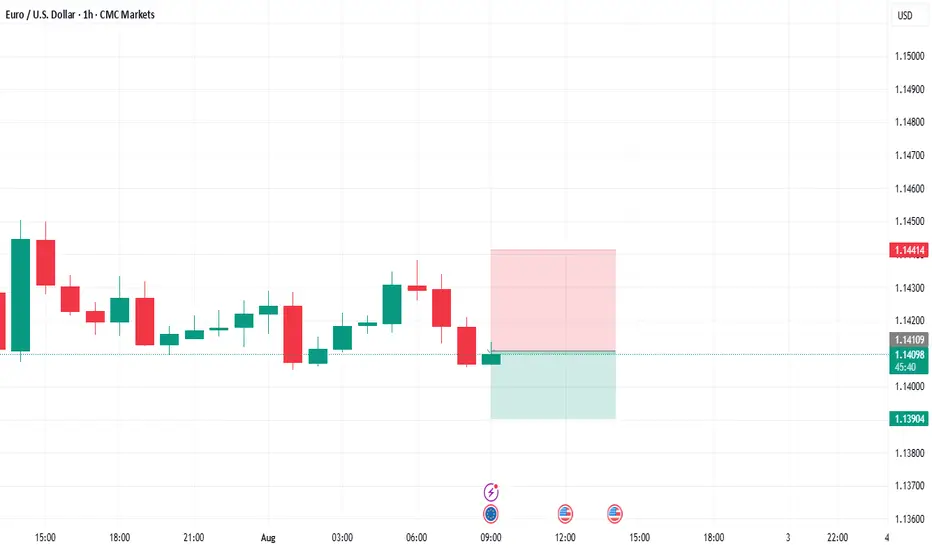
EURUSD First of August The information and publications are not meant to be, and do not constitute, financial, investment, trading, or other types of advice or recommendations.
Have a nice w/e ahead.
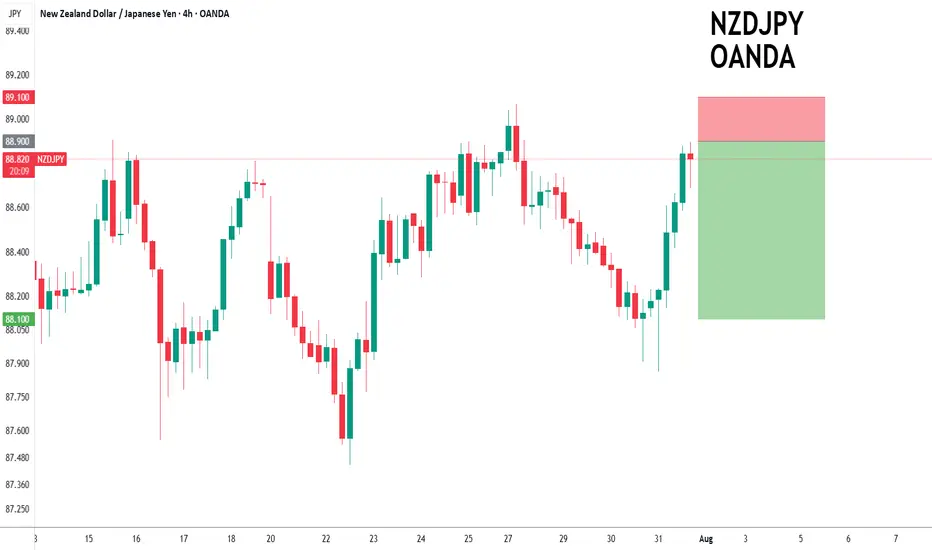
NZDJPY to find sellers at market price?NZDJPY - 24h expiry
Trading has been mixed and volatile.
Price action looks to be forming a top.
We look for a temporary move higher.
Preferred trade is to sell into rallies.
Bespoke resistance is located at 88.90.
We look to Sell at 88.90 (stop at 89.10)
Our profit targets will be 88.10 and 87.90
Resistance: 89.00 / 89.20 / 89.50
Support: 88.40 / 88.10 / 87.90
Risk Disclaimer
The trade ideas beyond this page are for informational purposes only and do not constitute investment advice or a solicitation to trade. This information is provided by Signal Centre, a third-party unaffiliated with OANDA, and is intended for general circulation only. OANDA does not guarantee the accuracy of this information and assumes no responsibilities for the information provided by the third party. The information does not take into account the specific investment objectives, financial situation, or particular needs of any particular person. You should take into account your specific investment objectives, financial situation, and particular needs before making a commitment to trade, including seeking, under a separate engagement, as you deem fit.
You accept that you assume all risks in independently viewing the contents and selecting a chosen strategy.
Where the research is distributed in Singapore to a person who is not an Accredited Investor, Expert Investor or an Institutional Investor, Oanda Asia Pacific Pte Ltd (“OAP“) accepts legal responsibility for the contents of the report to such persons only to the extent required by law. Singapore customers should contact OAP at 6579 8289 for matters arising from, or in connection with, the information/research distributed.
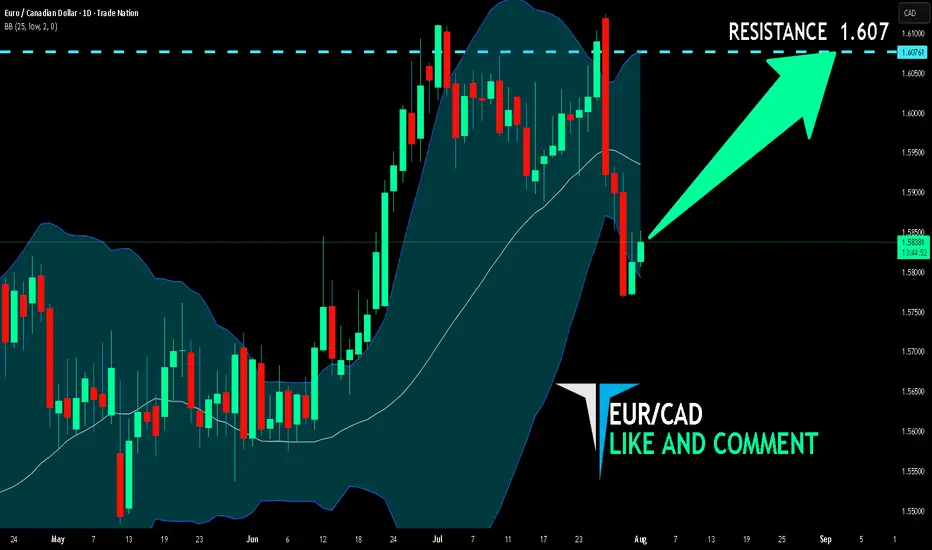
EUR/CAD BUYERS WILL DOMINATE THE MARKET|LONG
Hello, Friends!
We are going long on the EUR/CAD with the target of 1.607 level, because the pair is oversold and will soon hit the support line below. We deduced the oversold condition from the price being near to the lower BB band. However, we should use low risk here because the 1W TF is red and gives us a counter-signal.
Disclosure: I am part of Trade Nation's Influencer program and receive a monthly fee for using their TradingView charts in my analysis.
✅LIKE AND COMMENT MY IDEAS✅
GBP/JPY Clears July LowGBP/JPY clears the July low (195.37) as it tumbles to a fresh weekly low (195.34), and a close below the 195.70 (61.8% Fibonacci extension) to 196.60 (23.6% Fibonacci extension) region may push the exchange rate toward the June low (192.73).
Failure to hold above the 192.40 (50% Fibonacci extension) to 193.50 (38.2% Fibonacci extension) zone may lead to a test of the May low (190.33), but the selloff in GBP/JPY may turn out to be temporary if it defends the rebound from the June low (192.73).
GBP/JPY may attempt to retrace the decline from the July high (199.98) should it hold/close above the 195.70 (61.8% Fibonacci extension) to 196.60 (23.6% Fibonacci extension) region, with a close above the 199.80 (61.8% Fibonacci retracement) to 200.50 (78.6% Fibonacci extension) region opening up 201.20 (23.6% Fibonacci retracement).
--- Written by David Song, Senior Strategist at FOREX.com

USD/CHF potential trend reversalNothing concrete yet. is the down trend over? Road Map idea correct? look for price action to confirm potential setup.
* if trend reversal is in then a major leg up for a stronger US$

GBPUSD LongGBP/USD prices could potentially increase from the 1.3146 level within the Fair Value Gap (FVG) zone, with the next likely target being an upper FVG zone as a potential objective.

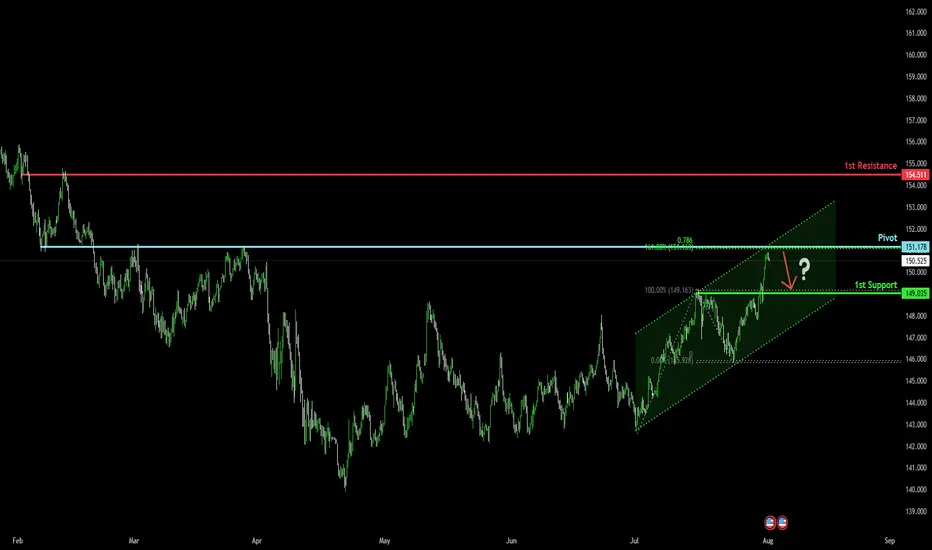
Bearish reversal off overlap resistance?USD/JPY is rising towards the pivot, which has been identified as an overlap resistance and could drop to the 1st support.
Pivot: 151.17
1st Support: 149.03
1st Resistance: 154.51
Risk Warning:
Trading Forex and CFDs carries a high level of risk to your capital and you should only trade with money you can afford to lose. Trading Forex and CFDs may not be suitable for all investors, so please ensure that you fully understand the risks involved and seek independent advice if necessary.
Disclaimer:
The above opinions given constitute general market commentary, and do not constitute the opinion or advice of IC Markets or any form of personal or investment advice.
Any opinions, news, research, analyses, prices, other information, or links to third-party sites contained on this website are provided on an "as-is" basis, are intended only to be informative, is not an advice nor a recommendation, nor research, or a record of our trading prices, or an offer of, or solicitation for a transaction in any financial instrument and thus should not be treated as such. The information provided does not involve any specific investment objectives, financial situation and needs of any specific person who may receive it. Please be aware, that past performance is not a reliable indicator of future performance and/or results. Past Performance or Forward-looking scenarios based upon the reasonable beliefs of the third-party provider are not a guarantee of future performance. Actual results may differ materially from those anticipated in forward-looking or past performance statements. IC Markets makes no representation or warranty and assumes no liability as to the accuracy or completeness of the information provided, nor any loss arising from any investment based on a recommendation, forecast or any information supplied by any third-party.
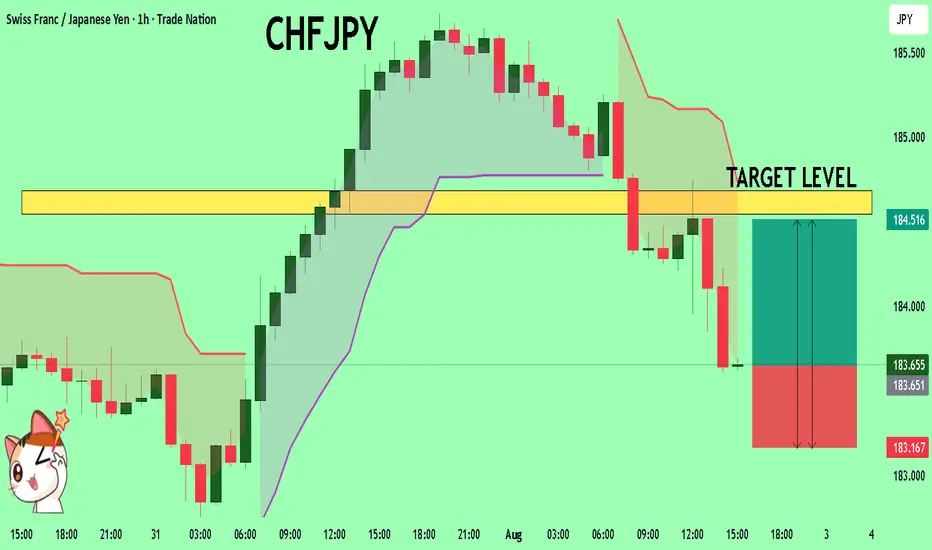
CHFJPY On The Rise! BUY!
My dear friends,
My technical analysis for CHFJPY is below:
The market is trading on 183.63 pivot level.
Bias - Bullish
Technical Indicators: Both Super Trend & Pivot HL indicate a highly probable Bullish continuation.
Target - 184.54
Recommended Stop Loss - 183.16
About Used Indicators:
A pivot point is a technical analysis indicator, or calculations, used to determine the overall trend of the market over different time frames.
Disclosure: I am part of Trade Nation's Influencer program and receive a monthly fee for using their TradingView charts in my analysis.
———————————
WISH YOU ALL LUCK
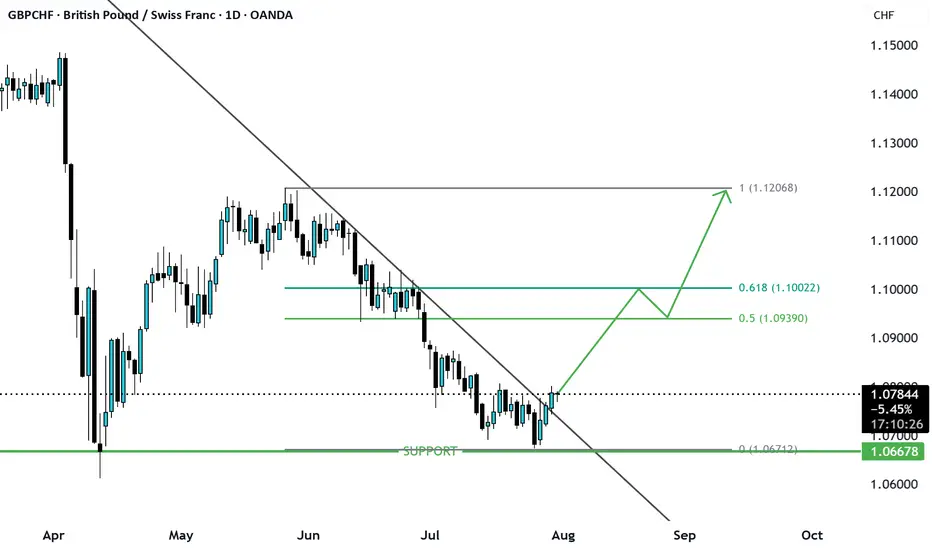
GBPCHF Break of trendline resistance GBPCHF has formed W pattern at the support and price looks to be reverses after the trendline resistance has been broken the first target will be the fib 0.5 of recent swing high if breaks down then it may go to Fib 1 . let us see
AUDUSD BUYBUY @0.64256
SL @0.64189
TP @0.64591
If SL hits by a candle sweep and closed above the entry level again buy....
And always risk 1%

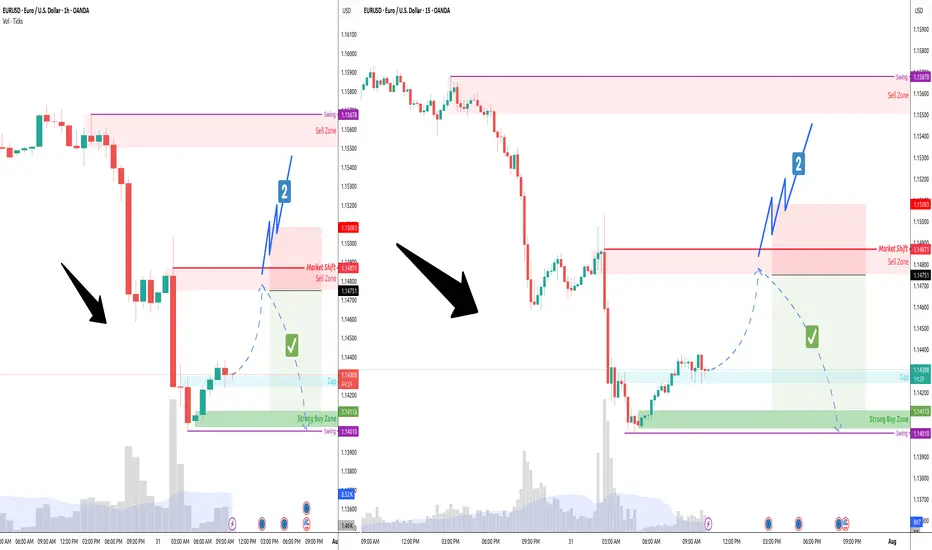
EURUSD 60/15 Pullback ShortOverall down trend. Now the price is located at the defending gap and stay above. Expected to break up and reach the sell zone then drop. Set alarm on lower sell zone and monitor.

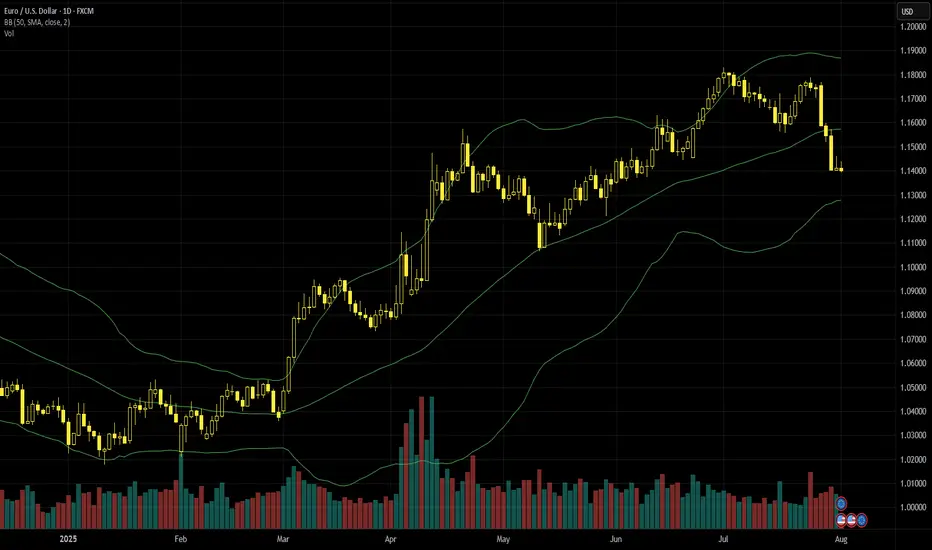
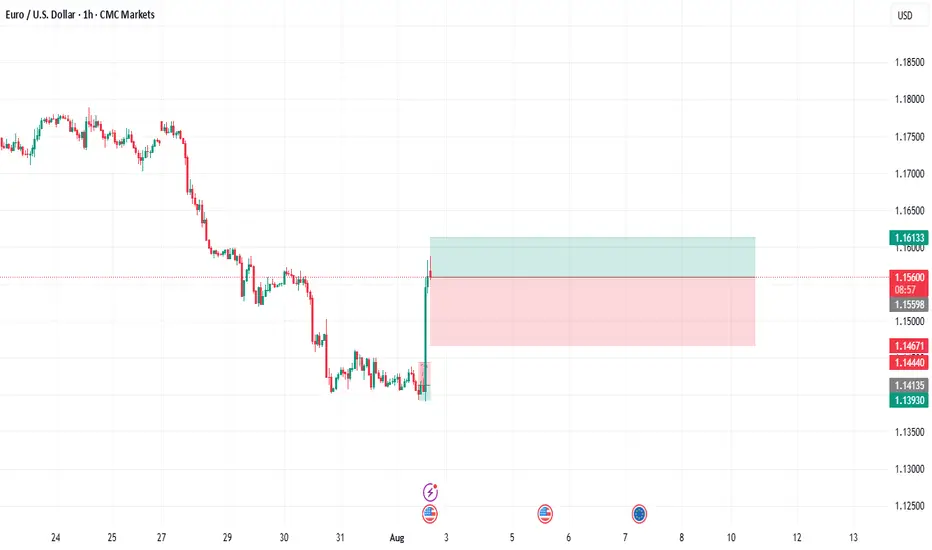
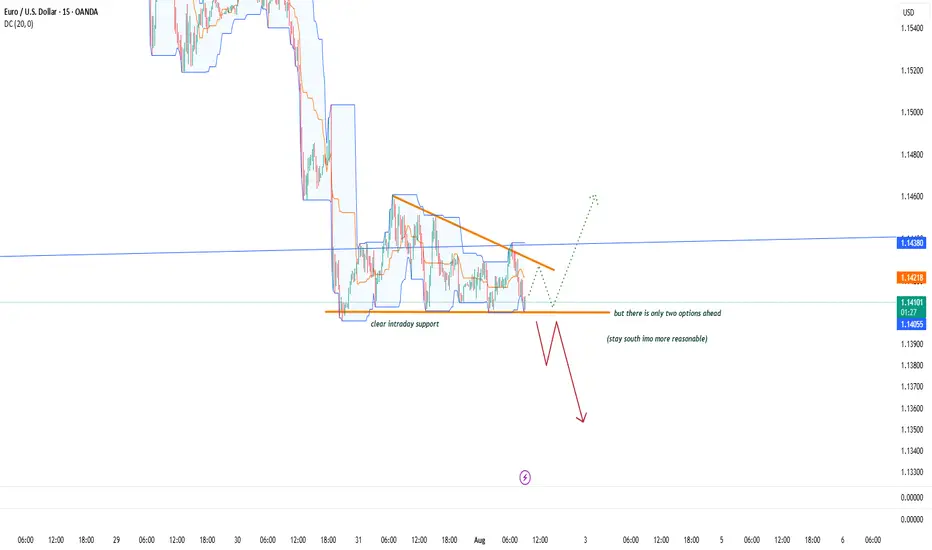
Euro-dollar retreats after the trade deal and divergent GDPEuro-dollar reached six-week lows on 1 August as traders continued to digest the trade deal between the EU and the USA which is widely viewed as being negative for the former. 30 July GDP releases from the eurozone and the USA also showed that American growth is much stronger, but eurozone-wide flash GDP for the second quarter was still slightly better than anticipated. The focus now turns to reactions to new tariffs and the NFP.
$1.14 looks like an important technical reference which might resist testing depending on the results of the job report. With fairly low volume relative to April’s peak and a clear oversold signal from the slow stochastic, a pause around here seems more likely than immediate continuation lower if considering only TA. 31 July’s near-doji slightly below the 100 SMA might suggest some demand for buying.
The obvious short-term resistance would be the confluence of the 50% monthly Fibonacci retracement and the 100 SMA around $1.147. The 61.8% Fibo slightly below $1.13 might be an area of support. Short-term performance depends primarily on the result of the NFP and the reaction to these; the consensus of 110,000 for total nonfarm seems too low relative to the average over the last several months, so a surprise higher might be more likely than lower.
This is my personal opinion, not the opinion of Exness. This is not a recommendation to trade.