GBPCHF LONG/BUY 1:7 PROBABILITYREASON FOR TRADE:
1. Expanding flat in play
2. Order block unmitigated
3. MACD divergence
4. Lquidity (1.08224)
Entry: 1.06994
Stop Loss: 1.06797
Take Profit: 1.08224
Forex market

UADUSD 60/15 Pullback ShortOverall down trend. Saw previous session closing away from P profile, Looking for a retest on current session POC, and continue for bearish momentum.
Two possible pullbacks on sell zones above. React as accordingly.
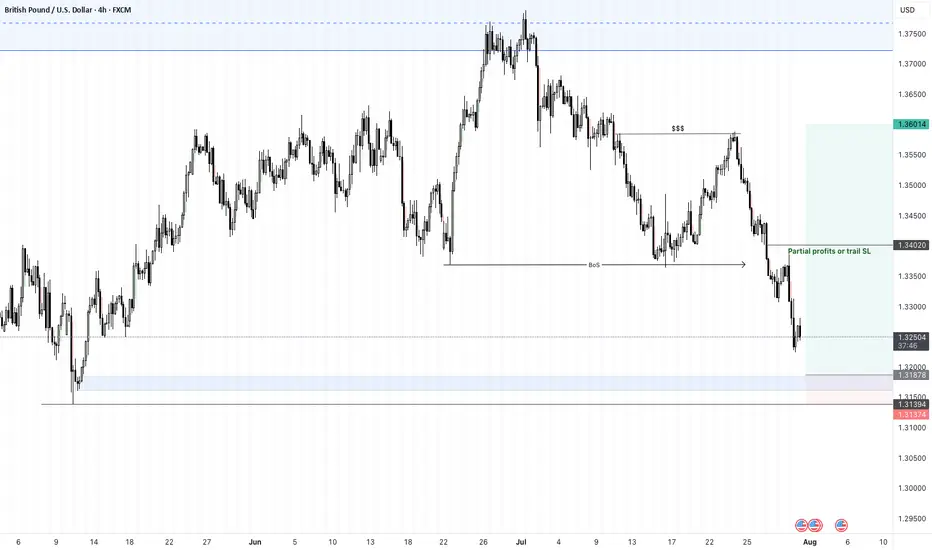
GBPUSD - 31/7/25 - Bullish reversalThe setup is not great, but im expecting a pull back on the dollar which should result in a bullish move on the GBP and EUR.
There is an extreme zone that i would like price to reach to with the possibility of not taking out the previous HL. But lets see.
+ve:
1. Extreme zone that resulted in the bullish move.
2. slight imbalance above the extreme zone
3. Dollar setting up for a pull back that will result in a bullish move on GBP
4. TP is just above the equal high liquidity zone
-ve:
1. close to the higher low and that may be swept
AUDCAD; Heikin Ashi Trade IdeaIn this video, I’ll be sharing my analysis of AUDCAD, using FXAN's proprietary algo indicators with my unique Heikin Ashi strategy. I’ll walk you through the reasoning behind my trade setup and highlight key areas where I’m anticipating potential opportunities.
I’m always happy to receive any feedback.
Like, share and comment! ❤️
Thank you for watching my videos! 🙏

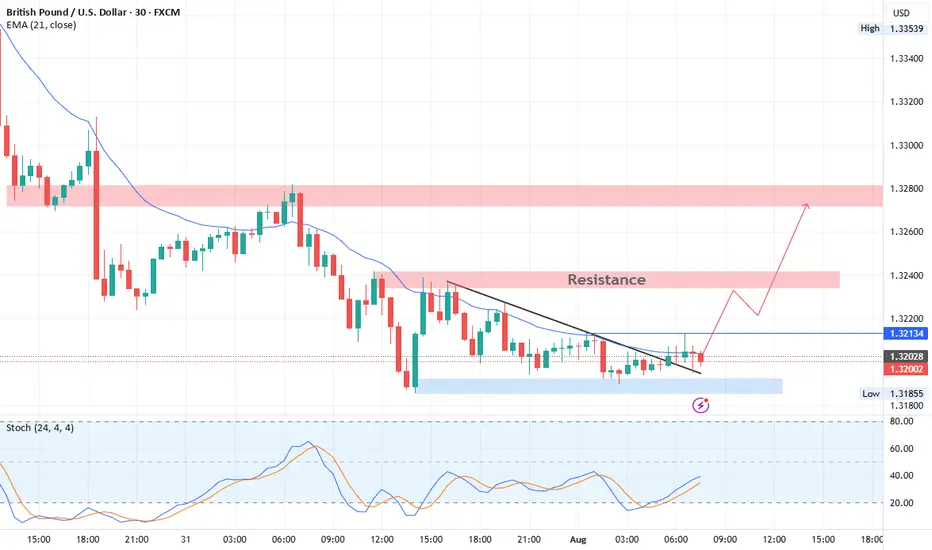
GBPUSD Technical BreakdownTrendline Breakout:
Price has decisively broken above a short-term descending trendline, signaling a potential shift in intraday momentum from bearish to bullish.
Support Zone (1.3185 – 1.3195):
This demand area has provided a strong base, with multiple successful rejections confirming buyer interest.
Resistance Levels:
Near-term resistance: 1.3213 (minor breakout level – watch for retest)
Key upside targets: 1.3240 followed by the major supply zone at 1.3275 – 1.3290
📈 Trade Outlook:
Bias: Bullish above 1.3213
Entry Idea: Look for bullish confirmation on a retest of 1.3213 as support
Targets:
TP1: 1.3240
TP2: 1.3275 – 1.3290
Invalidation: A sustained move below 1.3185 would invalidate the setup and reopen downside risk.
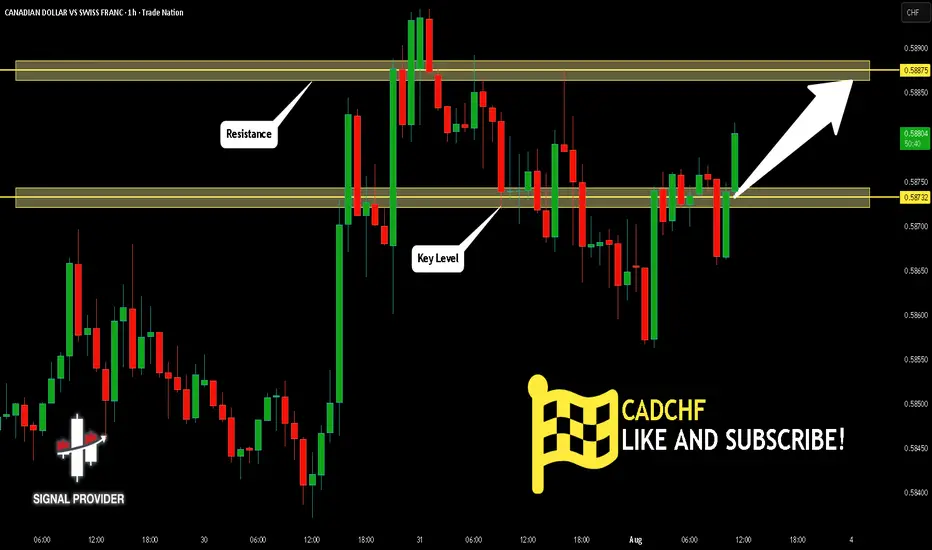
CADCHF Will Grow! Long!
Please, check our technical outlook for CADCHF.
Time Frame: 1h
Current Trend: Bullish
Sentiment: Oversold (based on 7-period RSI)
Forecast: Bullish
The market is trading around a solid horizontal structure 0.587.
The above observations make me that the market will inevitably achieve 0.588 level.
P.S
Please, note that an oversold/overbought condition can last for a long time, and therefore being oversold/overbought doesn't mean a price rally will come soon, or at all.
Disclosure: I am part of Trade Nation's Influencer program and receive a monthly fee for using their TradingView charts in my analysis.
Like and subscribe and comment my ideas if you enjoy them!
EURUSD has broken & hovering near resistance.EURUSD has broken & hovering near resistance. US dollar has started weaking again due to Tariff war.

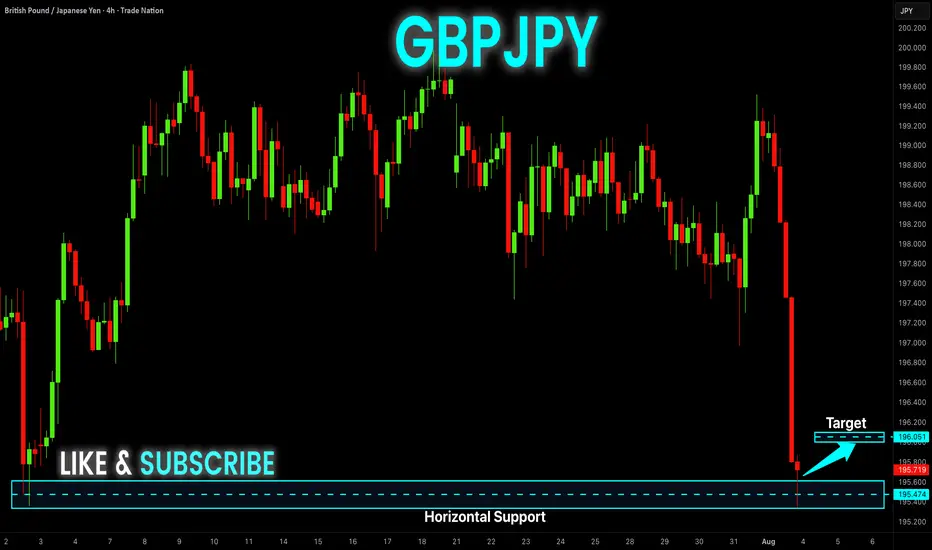
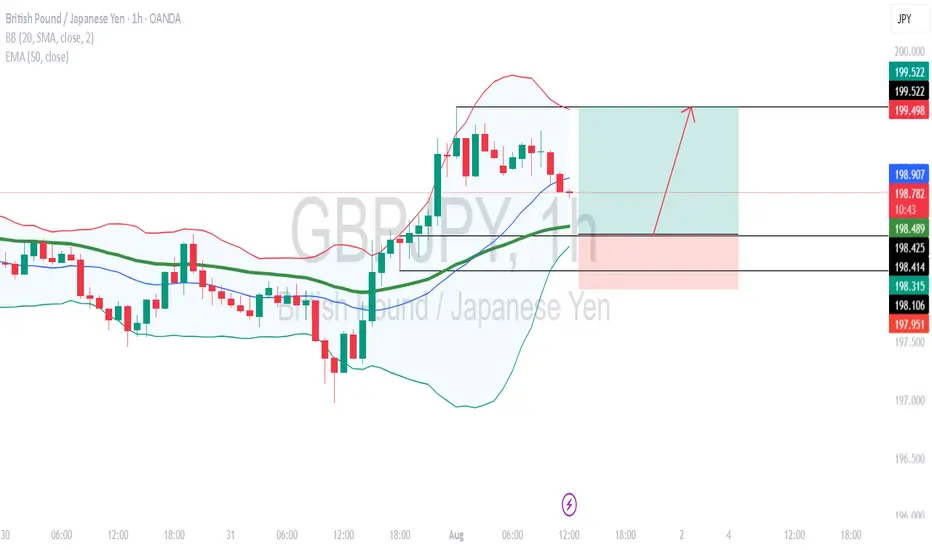
GBP-JPY Risky Long! Buy!
Hello,Traders!
GBP-JPY collapsed on Friday
And the pair's final move
Was absorbed by the horizontal
Support of 195.400 so as the
Pair is oversold we will be
Expecting a local rebound
And a correction on Monday
Buy!
Comment and subscribe to help us grow!
Check out other forecasts below too!
Disclosure: I am part of Trade Nation's Influencer program and receive a monthly fee for using their TradingView charts in my analysis.
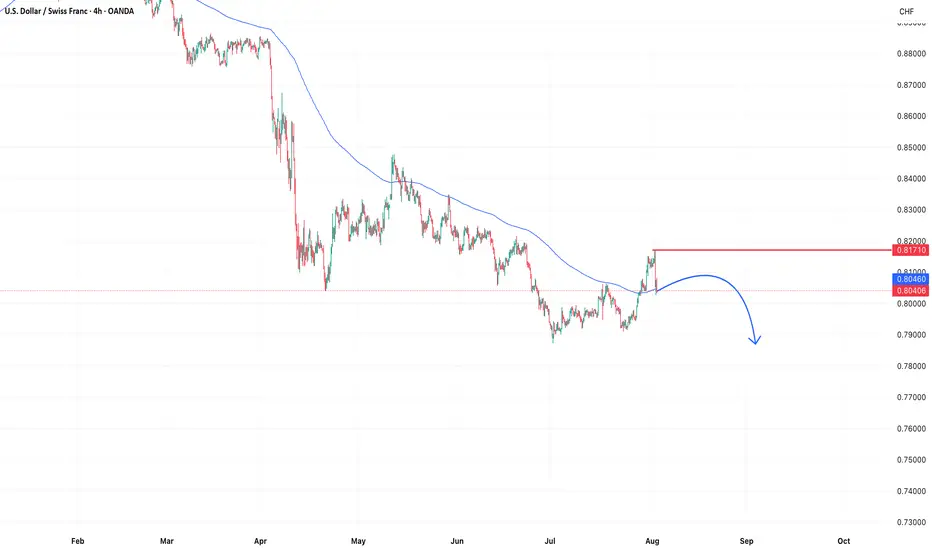
USDCHFUSDCHF is expected to continue its downtrend next week. After a weak recovery attempt, selling pressure remains dominant. Traders should keep an eye on key support zones for potential trading opportunities.
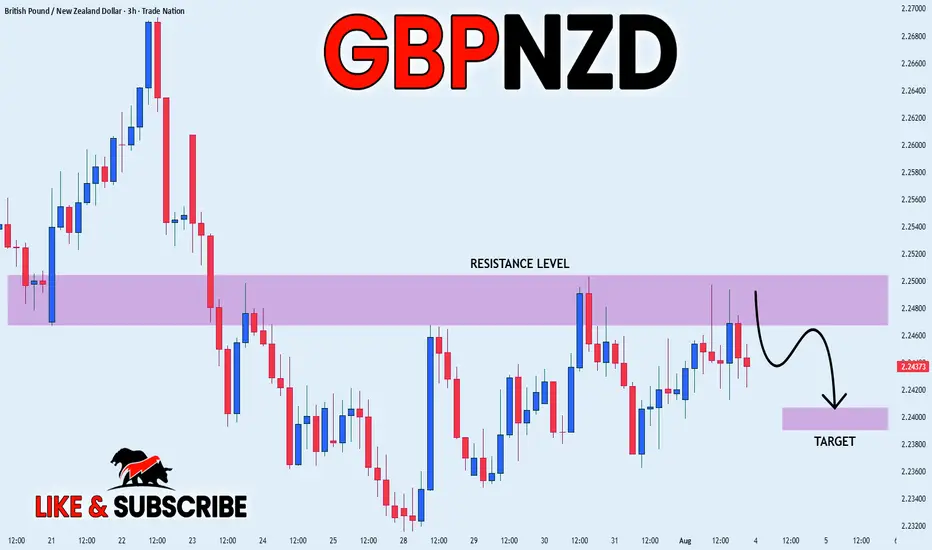
GBP_NZD BEARISH BIAS|SHORT|
✅GBP_NZD has retested
A resistance level of 2.2500
And we are seeing a bearish reaction
With the price going down so we are
Bearish biased now and we will be
Expecting the pair to go further down
SHORT🔥
✅Like and subscribe to never miss a new idea!✅
Disclosure: I am part of Trade Nation's Influencer program and receive a monthly fee for using their TradingView charts in my analysis.
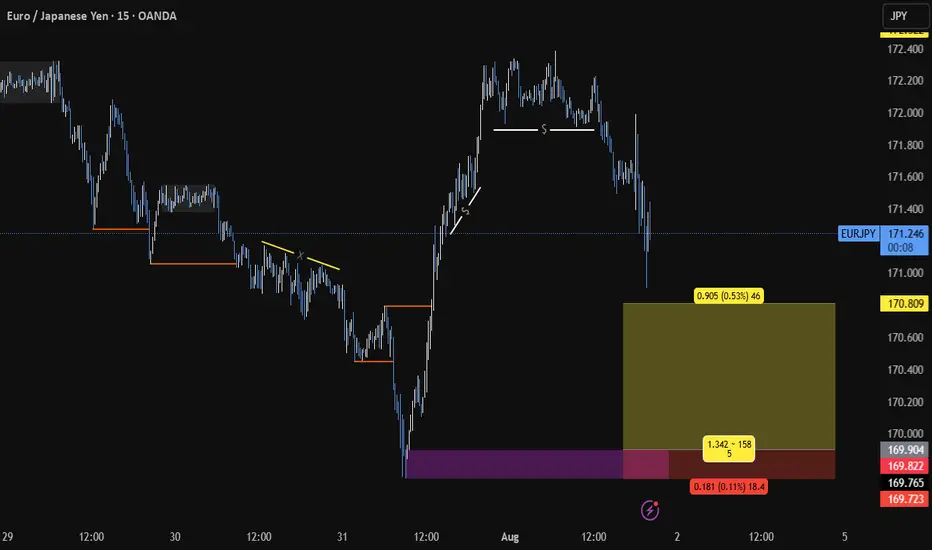
EURJPY SHORTWe have a break of Market structure. The pair rose to the daily fair value gap hoping the pair will drop to the 169.800 level

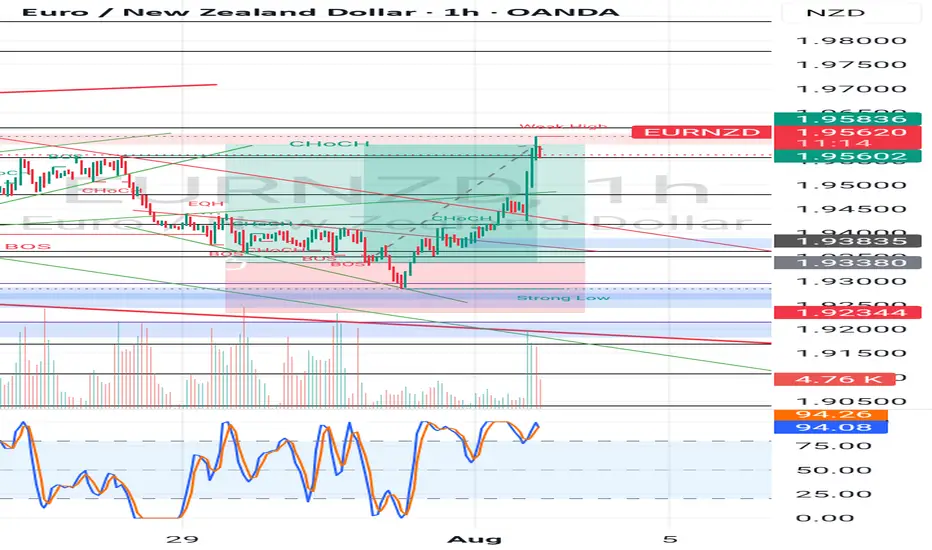
EUR NZD LONG RESULT Price moved better than anticipated, after adjusting my stop loss a little above break even, I decided to risk extended TP to the Supply zone, and the news pushed price directly in our Favor and TP Done ✅.
Not a financial advice though.
_THE_KLASSIC_TRADER_.
EURJPY BUYBUY @169.904
SL @169.723
TP @170.809
If it moves above and create a BOS, then close the trade....
And always risk 1%
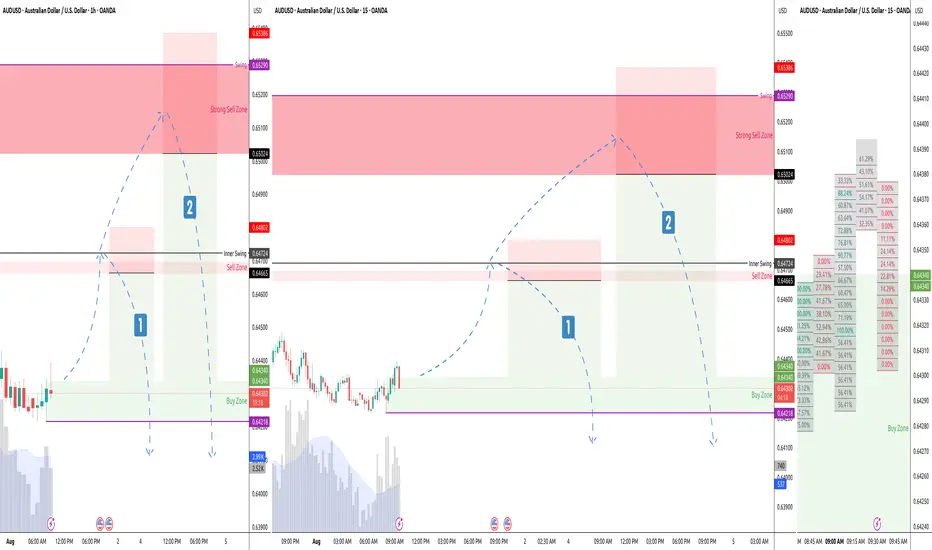
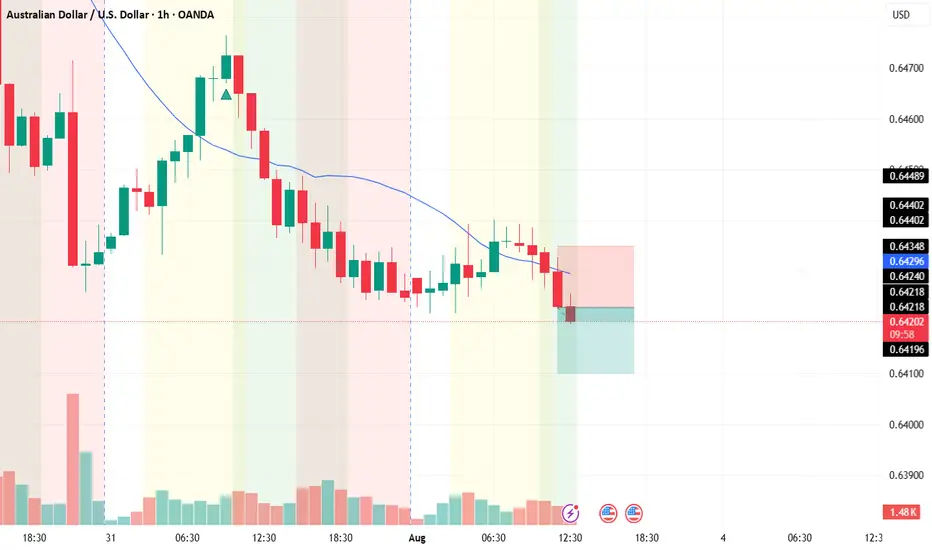
AUD/USDThis is a trade setup for AUD/USD, based on volume and trend analysis.
Entry Price: 0.64230
Stop-Loss (SL): 0.64350
Take-Profit (TP): 0.64100
The trade is intended to be executed instantly at the mentioned price, in alignment with both volume behavior and the current trend direction.
Disclaimer: This setup is shared purely for backtesting purposes and to document trade ideas. It is not financial advice. Always perform your own analysis before making any trading decisions.
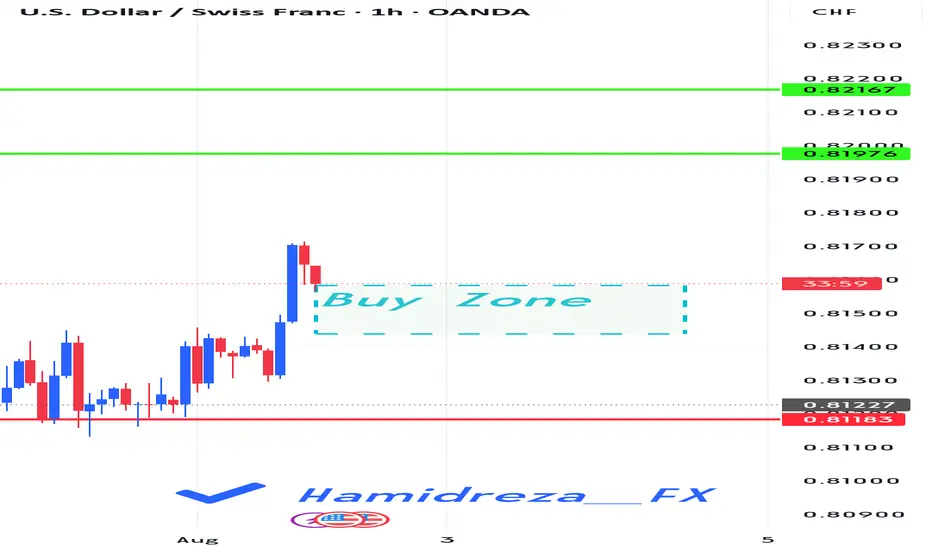
Will USDCHF remain bullish?
Hi dears
We are at your service with the analysis of the Swiss Franc against the US Dollar. It seems that we should continue to see the strengthening of the US Dollar. It is possible that we will see the growth of the African Dollar against the opposite currency pairs.
What do you think?
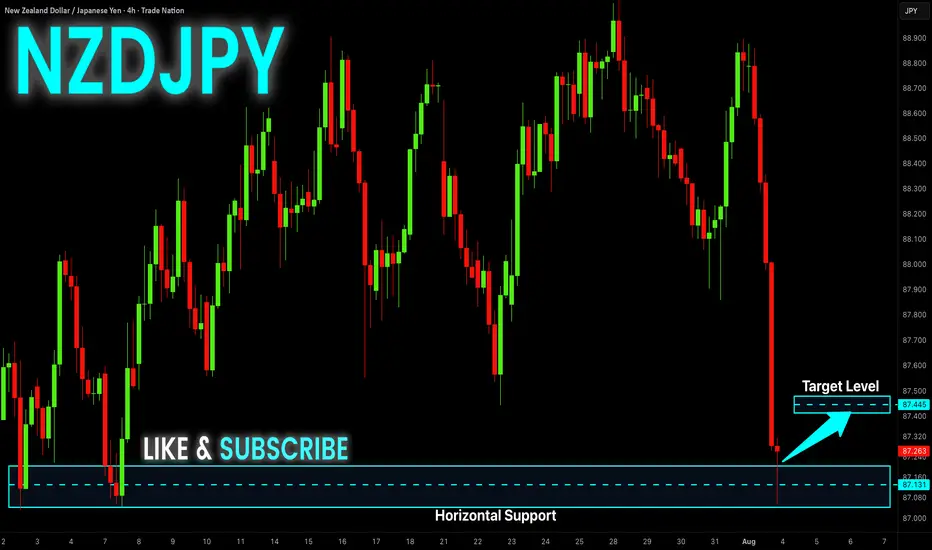
NZD-JPY Local Long! Buy!
Hello,Traders!
NZD-JPY is retsting a
Strong horizontal support
Level around 87.044 and
As the pair is locally
Oversold we will be expecting
A local rebound and a move
Up on Monday!
Buy!
Comment and subscribe to help us grow!
Check out other forecasts below too!
Disclosure: I am part of Trade Nation's Influencer program and receive a monthly fee for using their TradingView charts in my analysis.

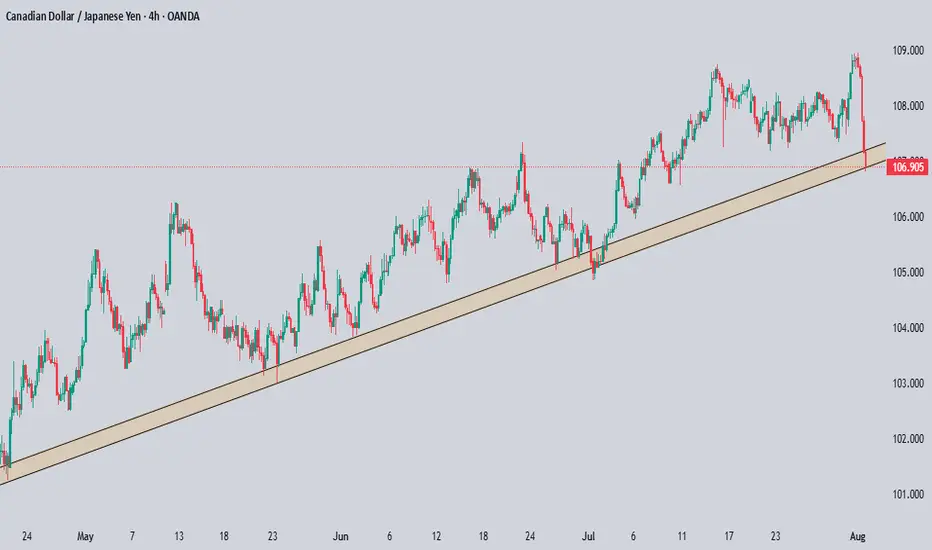
CADJPY Technical & Order Flow AnalysisOur analysis is based on a multi-timeframe top-down approach and fundamental analysis.
Based on our assessment, the price is expected to return to the monthly level.
DISCLAIMER: This analysis may change at any time without notice and is solely intended to assist traders in making independent investment decisions. Please note that this is a prediction, and I have no obligation to act on it, nor should you.
Please support our analysis with a boost or comment!
USD/MXN Bounces Back Ahead of August 2024 LowUSD/MXN appears to be bouncing back ahead of the August 2024 low (18.4291) as it extends the advance from the July low (18.5116), with the exchange rate trading above the 50-Day SMA (18.8993) for the first time since April.
USD/MXN trades to a fresh weekly high (18.9810) following the failed attempt to push below the 18.5090 (23.6% Fibonacci retracement) to 18.6330 (50% Fibonacci retracement) zone, with a move above 19.3720 (38.2% Fibonacci retracement) bringing the June high (19.4441) on the radar.
A move/close above 19.6280 (23.6% Fibonacci extension) opens up the May high (19.7820), but lack of momentum to hold above 18.7780 (50% Fibonacci retracement) may push USD/MXN back toward the July low (18.5116).
--- Written by David Song, Senior Strategist at FOREX.com

GBPJPY pullback for another bullish moveDaily candle closed with strong bullish.
A healthy pullback observed during Asian session.
I'm waiting at marking area for buy entry.
Calculate your own risk & reward.
Good Luck
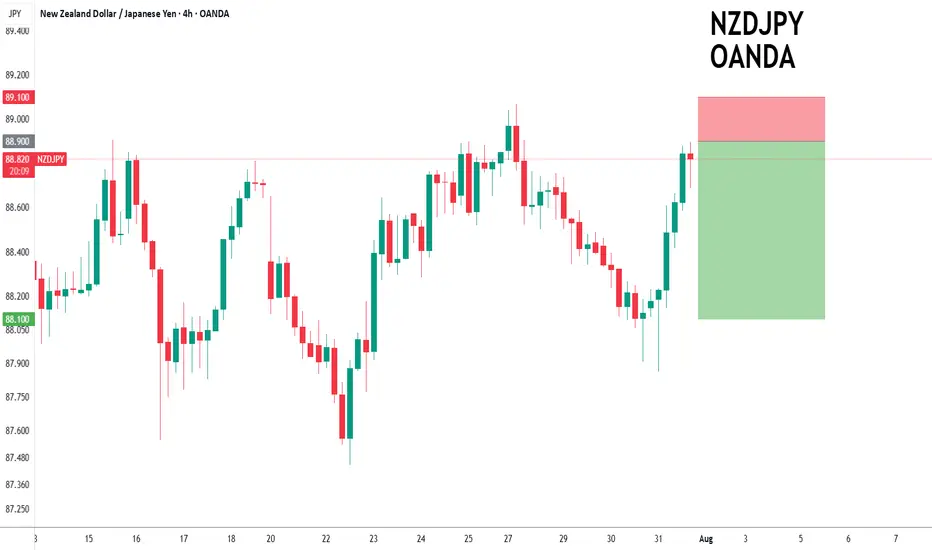
NZDJPY to find sellers at market price?NZDJPY - 24h expiry
Trading has been mixed and volatile.
Price action looks to be forming a top.
We look for a temporary move higher.
Preferred trade is to sell into rallies.
Bespoke resistance is located at 88.90.
We look to Sell at 88.90 (stop at 89.10)
Our profit targets will be 88.10 and 87.90
Resistance: 89.00 / 89.20 / 89.50
Support: 88.40 / 88.10 / 87.90
Risk Disclaimer
The trade ideas beyond this page are for informational purposes only and do not constitute investment advice or a solicitation to trade. This information is provided by Signal Centre, a third-party unaffiliated with OANDA, and is intended for general circulation only. OANDA does not guarantee the accuracy of this information and assumes no responsibilities for the information provided by the third party. The information does not take into account the specific investment objectives, financial situation, or particular needs of any particular person. You should take into account your specific investment objectives, financial situation, and particular needs before making a commitment to trade, including seeking, under a separate engagement, as you deem fit.
You accept that you assume all risks in independently viewing the contents and selecting a chosen strategy.
Where the research is distributed in Singapore to a person who is not an Accredited Investor, Expert Investor or an Institutional Investor, Oanda Asia Pacific Pte Ltd (“OAP“) accepts legal responsibility for the contents of the report to such persons only to the extent required by law. Singapore customers should contact OAP at 6579 8289 for matters arising from, or in connection with, the information/research distributed.
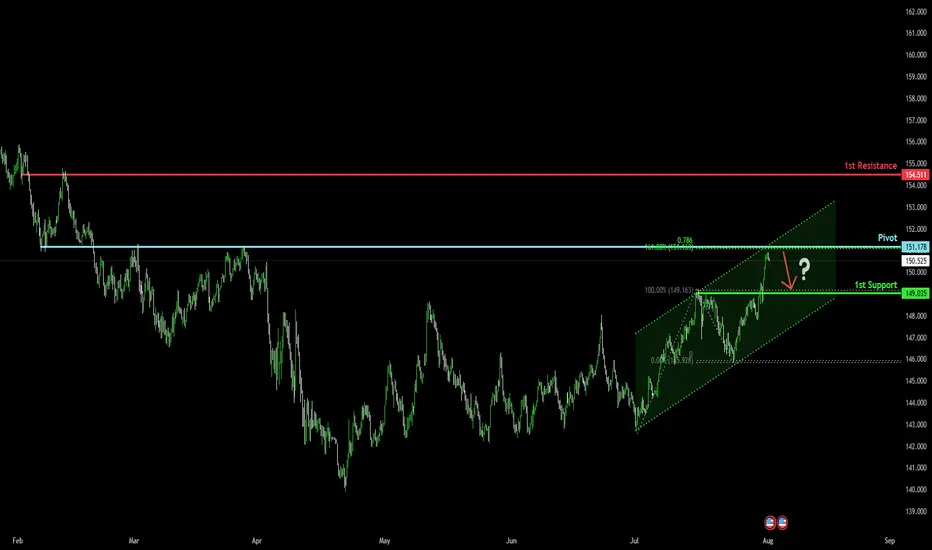
Bearish reversal off overlap resistance?USD/JPY is rising towards the pivot, which has been identified as an overlap resistance and could drop to the 1st support.
Pivot: 151.17
1st Support: 149.03
1st Resistance: 154.51
Risk Warning:
Trading Forex and CFDs carries a high level of risk to your capital and you should only trade with money you can afford to lose. Trading Forex and CFDs may not be suitable for all investors, so please ensure that you fully understand the risks involved and seek independent advice if necessary.
Disclaimer:
The above opinions given constitute general market commentary, and do not constitute the opinion or advice of IC Markets or any form of personal or investment advice.
Any opinions, news, research, analyses, prices, other information, or links to third-party sites contained on this website are provided on an "as-is" basis, are intended only to be informative, is not an advice nor a recommendation, nor research, or a record of our trading prices, or an offer of, or solicitation for a transaction in any financial instrument and thus should not be treated as such. The information provided does not involve any specific investment objectives, financial situation and needs of any specific person who may receive it. Please be aware, that past performance is not a reliable indicator of future performance and/or results. Past Performance or Forward-looking scenarios based upon the reasonable beliefs of the third-party provider are not a guarantee of future performance. Actual results may differ materially from those anticipated in forward-looking or past performance statements. IC Markets makes no representation or warranty and assumes no liability as to the accuracy or completeness of the information provided, nor any loss arising from any investment based on a recommendation, forecast or any information supplied by any third-party.
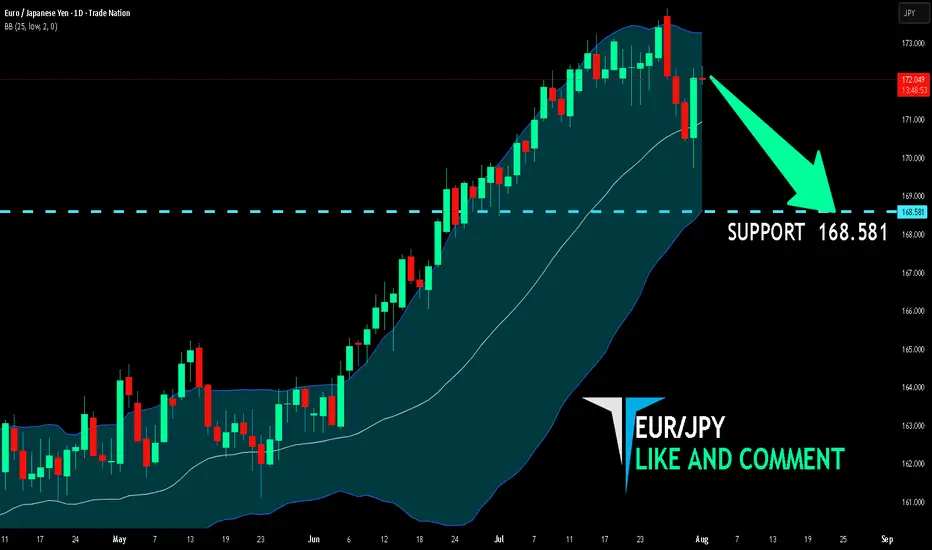
EUR/JPY BEARISH BIAS RIGHT NOW| SHORT
Hello, Friends!
We are now examining the EUR/JPY pair and we can see that the pair is going up locally while also being in a uptrend on the 1W TF. But there is also a powerful signal from the BB upper band being nearby, indicating that the pair is overbought so we can go short from the resistance line above and a target at 168.581 level.
Disclosure: I am part of Trade Nation's Influencer program and receive a monthly fee for using their TradingView charts in my analysis.
✅LIKE AND COMMENT MY IDEAS✅