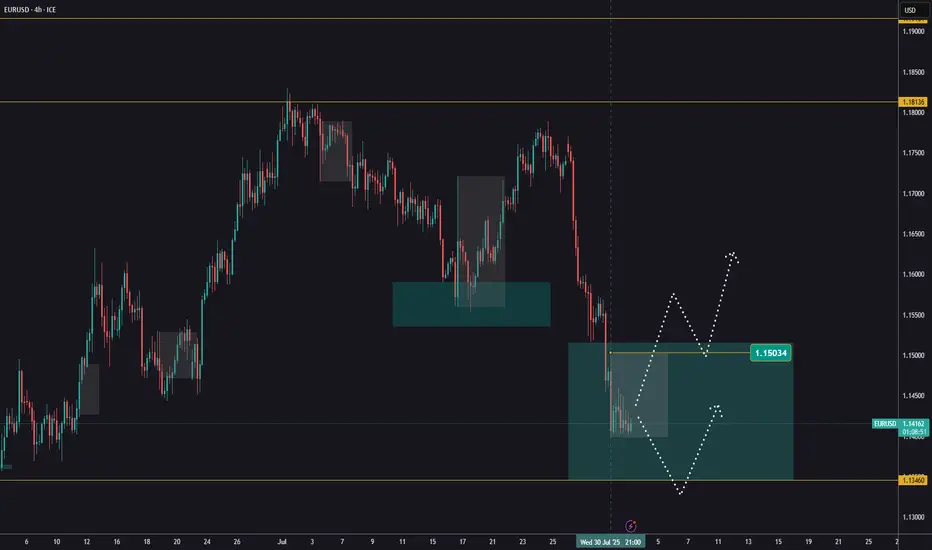
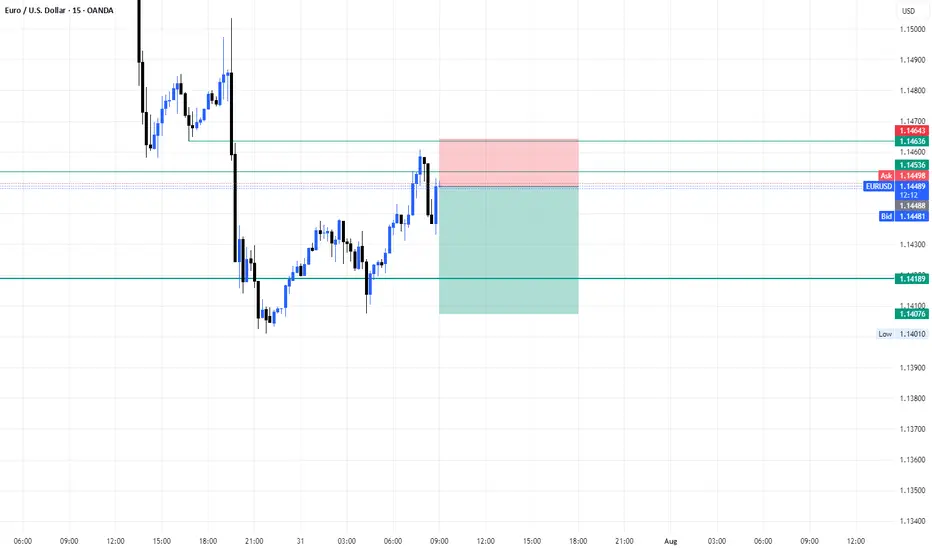
EURUSD ahead of NFPEURUSD is still trading within the range established after Wednesday’s news.
We’re watching for a close above 1,1503, which would confirm a potential buying opportunity.
Today at 1:30 PM (London), the NFP data will be released, which could further impact price action - especially if a reversal is underway.
In case of a decline, the next key support level to watch is around 1,1346.
Forex market
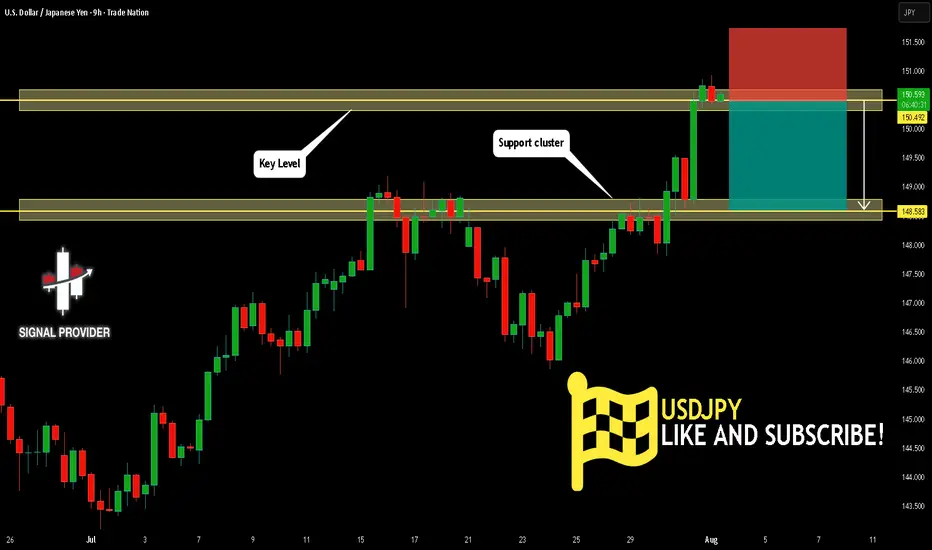
USDJPY Is Very Bearish! Sell!
Here is our detailed technical review for USDJPY.
Time Frame: 9h
Current Trend: Bearish
Sentiment: Overbought (based on 7-period RSI)
Forecast: Bearish
The market is on a crucial zone of supply 150.492.
The above-mentioned technicals clearly indicate the dominance of sellers on the market. I recommend shorting the instrument, aiming at 148.583 level.
P.S
We determine oversold/overbought condition with RSI indicator.
When it drops below 30 - the market is considered to be oversold.
When it bounces above 70 - the market is considered to be overbought.
Disclosure: I am part of Trade Nation's Influencer program and receive a monthly fee for using their TradingView charts in my analysis.
Like and subscribe and comment my ideas if you enjoy them!
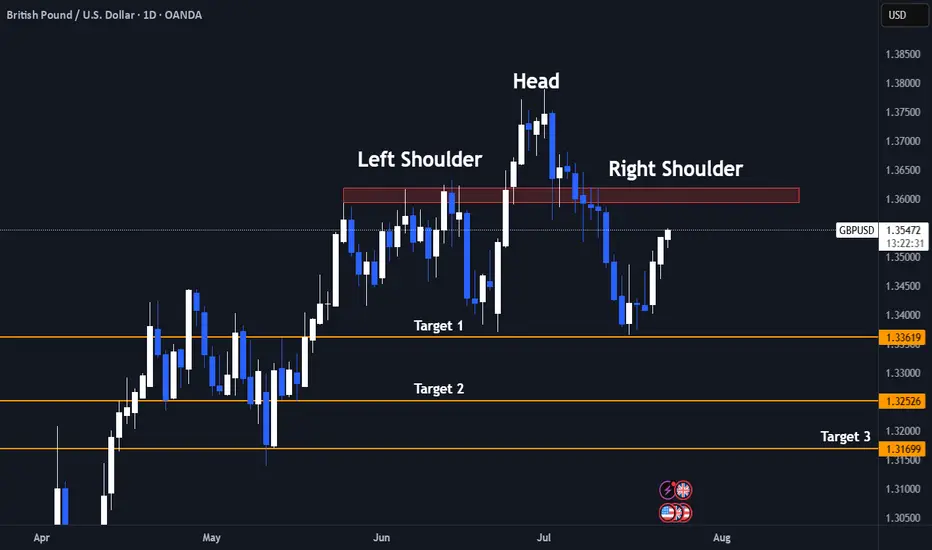
Bull Trap Confirmed: GBPUSD's 8% Rally Faces ExhaustionLets Face it we had a great 6 months already clocking 60%+ Returns already.
And after sitting ducks for almost 2 months now we finally have a trade.
- Its a very self explanatory chart
- Trading at resistance
- Head & Shoulder pattern
And the best part the right shoulder is still yet to be formed! My favourite type of entry.
1.It gives a better risk reward ratio (1:7 expected)
2.Better Entry (No long red candles)
3. And even if the pattern fails it we may still reach the neck line which is target 1.
Entry Criteria
- A Red candle at the entry Line Marked
- Stoploss Above the Entry Candle
Target 1- 1.3361
Target 2- 1.3252
Target 3- 1.3169
Keep Your Risk Reward Intact! Not An investment Advice
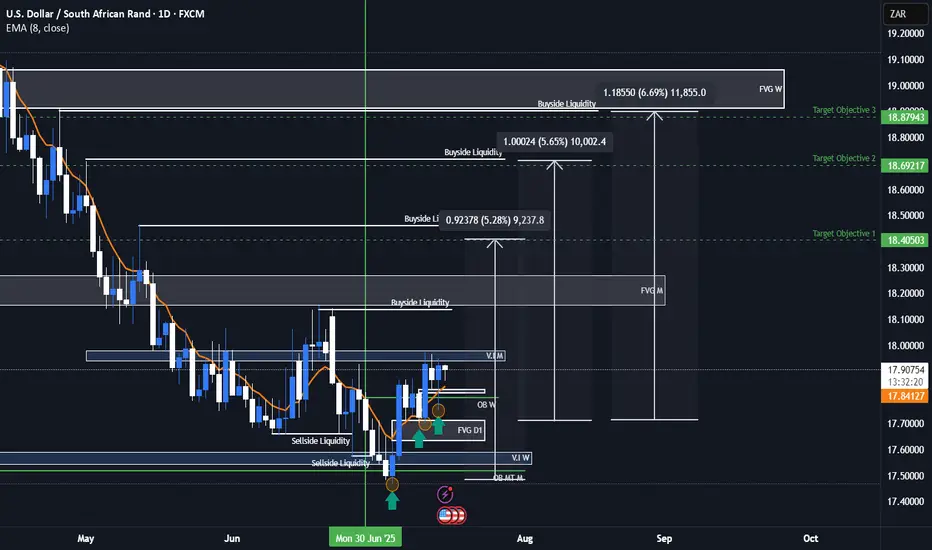
USDZAR Bullish ideaAs we can see this is our USDZAR quarterly shift idea were we are anticipating price to rally to the upside toward our draw on liquidity objectives. We had a weekly volume imbalance and monthly mean threshold order block show us support after we took out major liquidity points. We also showed more support on our daily FVG and a market shift taking place after a displacement. We are anticipating a rally for USDZAR and will be looking to see how price plays out.
USDZAR is an exotic pair that is part of the emerging markets and emerging markets/exotic pairs can usually lead ahead of major forex pair or lag between major forex pairs so this can also help us with our intermarket analysis of forex pairs when determining our dollar strength against other basket currencies.
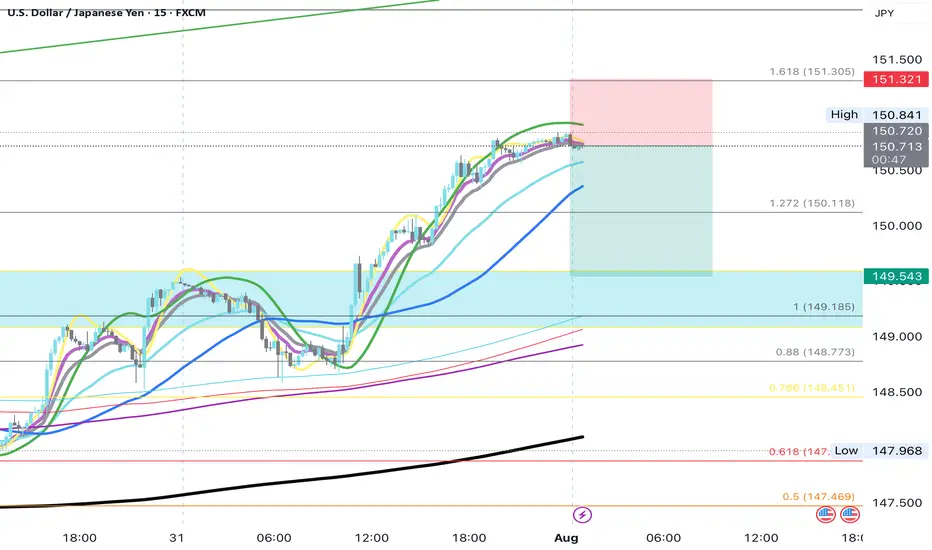
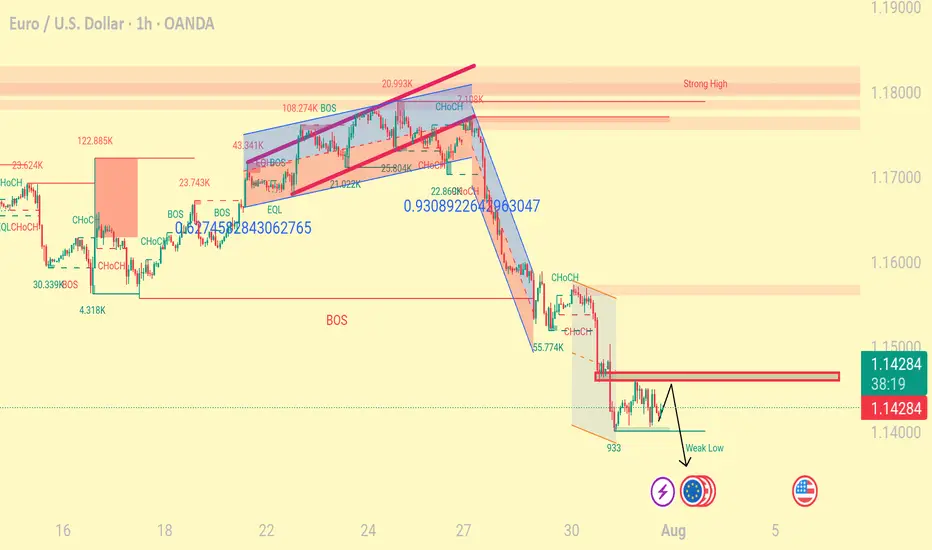
EURUSD First of August The information and publications are not meant to be, and do not constitute, financial, investment, trading, or other types of advice or recommendations.
Have a nice w/e ahead.
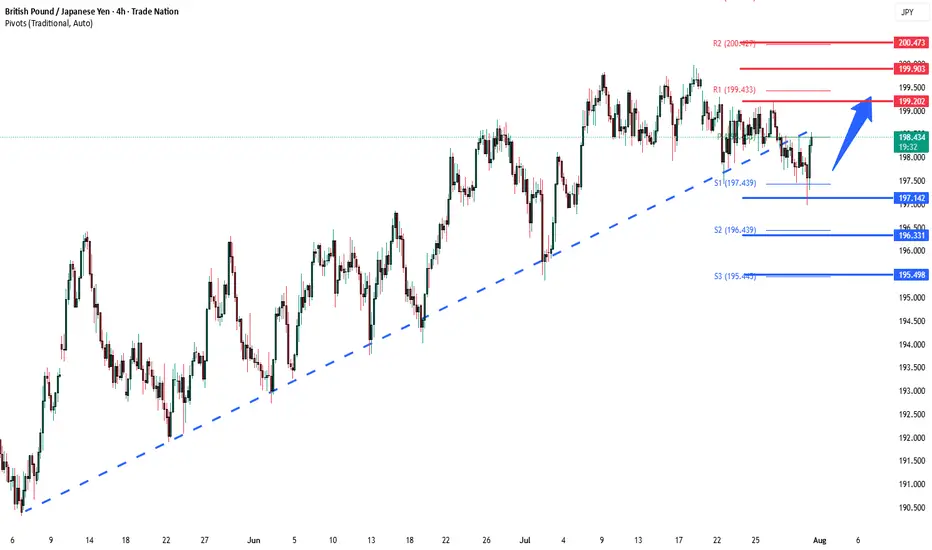
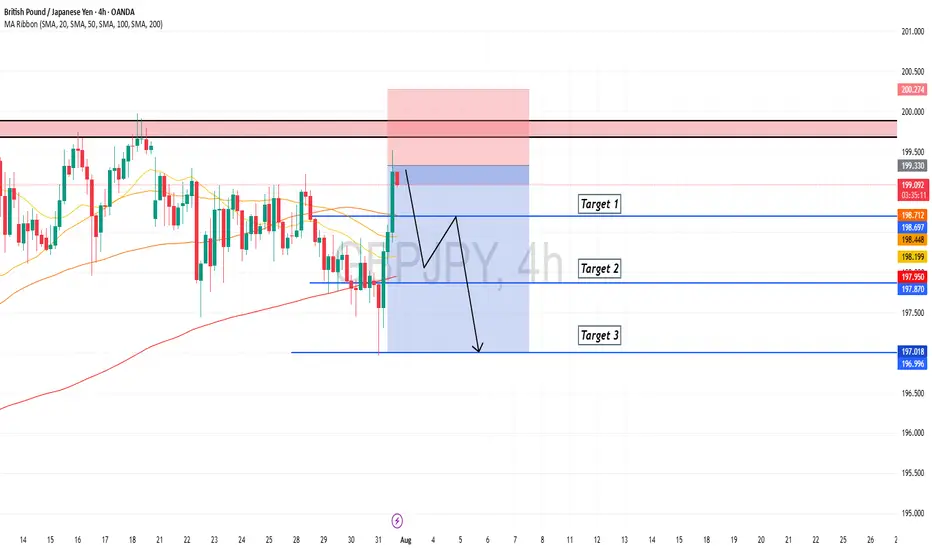
GBPJPY key support at 197.75Key Support: 196.75
This level marks the prior consolidation zone and serves as a critical pivot. A corrective pullback toward 196.75 followed by a bullish reversal would validate the uptrend, with upside targets at:
199.20 – Initial resistance and short-term target
199.70 – Minor resistance zone
200.40 – Longer-term breakout objective
However, a daily close below 196.75 would invalidate the bullish scenario, potentially triggering a deeper retracement toward:
195.80 – Near-term support
194.80 – Key downside level in a bearish reversal
Conclusion:
As long as 196.75 holds, the bias remains bullish, favoring continuation toward the 199–200 zone. A confirmed break below this support would shift momentum, opening the door for a broader corrective decline.
This communication is for informational purposes only and should not be viewed as any form of recommendation as to a particular course of action or as investment advice. It is not intended as an offer or solicitation for the purchase or sale of any financial instrument or as an official confirmation of any transaction. Opinions, estimates and assumptions expressed herein are made as of the date of this communication and are subject to change without notice. This communication has been prepared based upon information, including market prices, data and other information, believed to be reliable; however, Trade Nation does not warrant its completeness or accuracy. All market prices and market data contained in or attached to this communication are indicative and subject to change without notice.
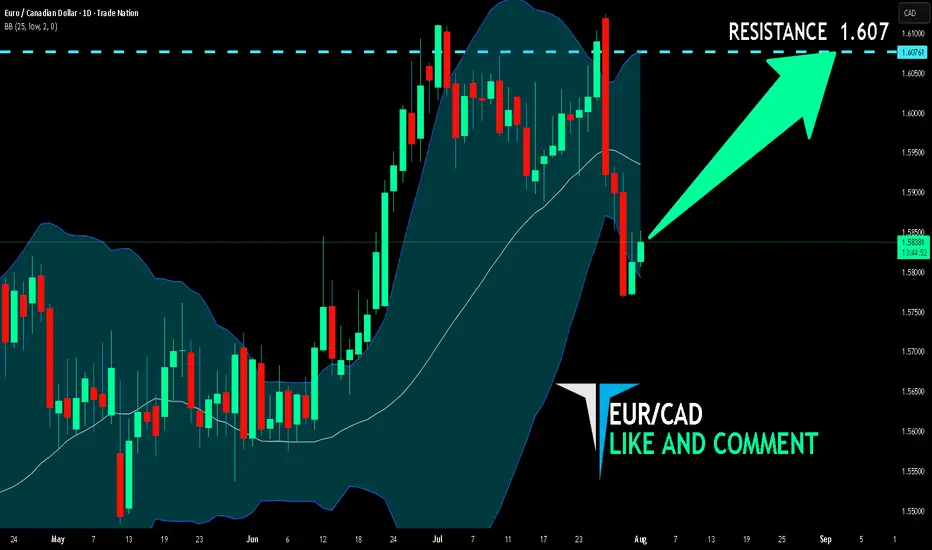
EUR/CAD BUYERS WILL DOMINATE THE MARKET|LONG
Hello, Friends!
We are going long on the EUR/CAD with the target of 1.607 level, because the pair is oversold and will soon hit the support line below. We deduced the oversold condition from the price being near to the lower BB band. However, we should use low risk here because the 1W TF is red and gives us a counter-signal.
Disclosure: I am part of Trade Nation's Influencer program and receive a monthly fee for using their TradingView charts in my analysis.
✅LIKE AND COMMENT MY IDEAS✅
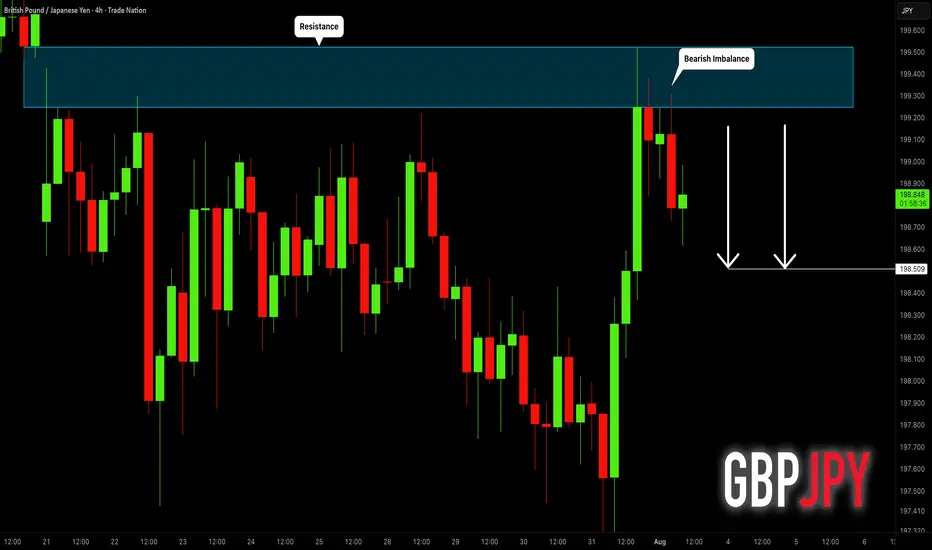
GBPJPY: Pullback From Resistance 🇬🇧🇯🇵
I think that GBPJPY will pull back from a wide
intraday supply area.
As a confirmation, I see a bearish imbalance candle that
is formed after its test.
Goal - 198.51
❤️Please, support my work with like, thank you!❤️
I am part of Trade Nation's Influencer program and receive a monthly fee for using their TradingView charts in my analysis.
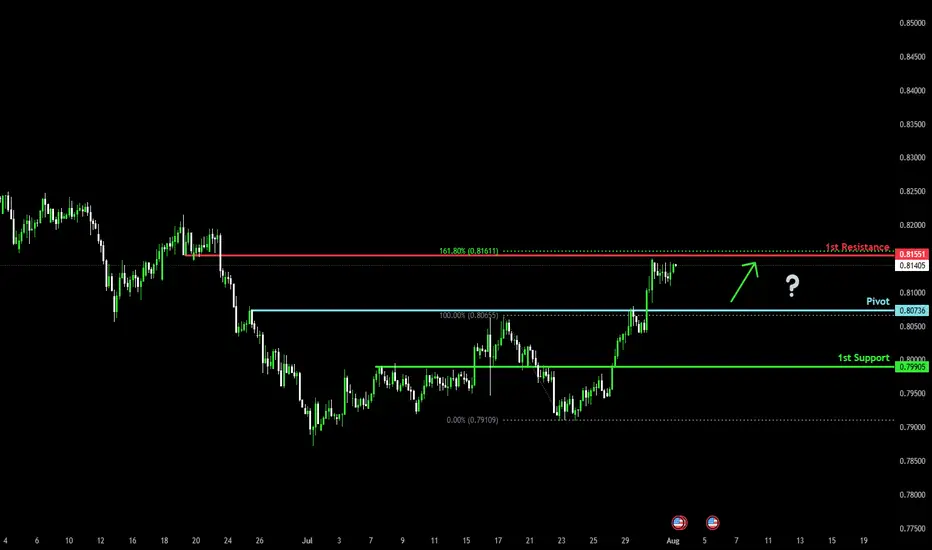
Bullish bounce off pullback support?The Swissie (USD/CHF) is falling towards the pivot, which acts as a pullback support and could bounce to the 1st resistance, which lines up with the 161.8% Fibonacci extension.
Pivot: 0.8073
1st Support: 0.7990
1st Resistance: 0.8155
Risk Warning:
Trading Forex and CFDs carries a high level of risk to your capital and you should only trade with money you can afford to lose. Trading Forex and CFDs may not be suitable for all investors, so please ensure that you fully understand the risks involved and seek independent advice if necessary.
Disclaimer:
The above opinions given constitute general market commentary, and do not constitute the opinion or advice of IC Markets or any form of personal or investment advice.
Any opinions, news, research, analyses, prices, other information, or links to third-party sites contained on this website are provided on an "as-is" basis, are intended only to be informative, is not an advice nor a recommendation, nor research, or a record of our trading prices, or an offer of, or solicitation for a transaction in any financial instrument and thus should not be treated as such. The information provided does not involve any specific investment objectives, financial situation and needs of any specific person who may receive it. Please be aware, that past performance is not a reliable indicator of future performance and/or results. Past Performance or Forward-looking scenarios based upon the reasonable beliefs of the third-party provider are not a guarantee of future performance. Actual results may differ materially from those anticipated in forward-looking or past performance statements. IC Markets makes no representation or warranty and assumes no liability as to the accuracy or completeness of the information provided, nor any loss arising from any investment based on a recommendation, forecast or any information supplied by any third-party.
EURusd short position 31/07/2025English : According to our analysis, we anticipate a bearish scenario.
Morocan Darija : kanchofo d'apres l'analyse dyalna antsanaw hboot
ATENTION : I only share my ideas, not signals
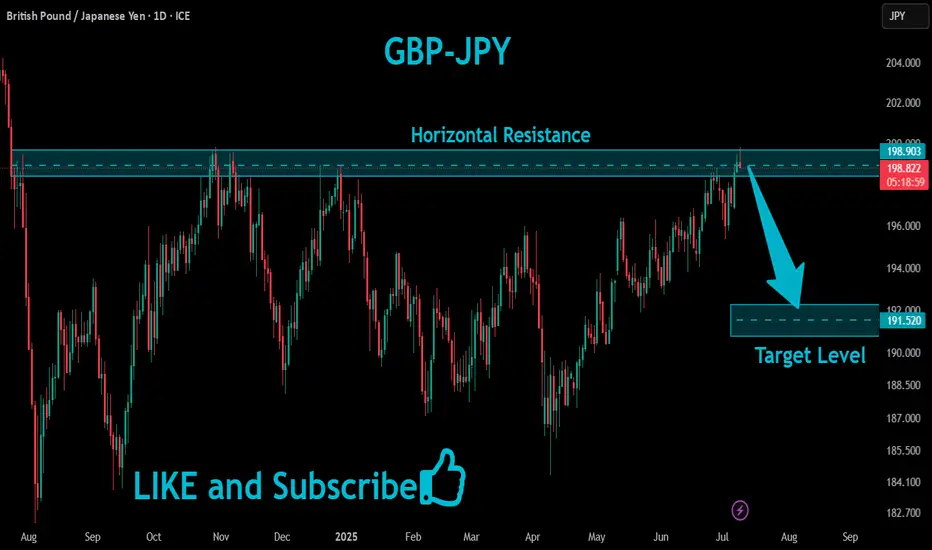
GBPJPY Will Fall!
HI,Traders !
#GBPJPY has retested a
Horizontal resistance level
Of 198.903 so we are
Locally bearish biased
And from the resistance we
We will be expecting a
Local bearish correction !
Comment and subscribe to help us grow !
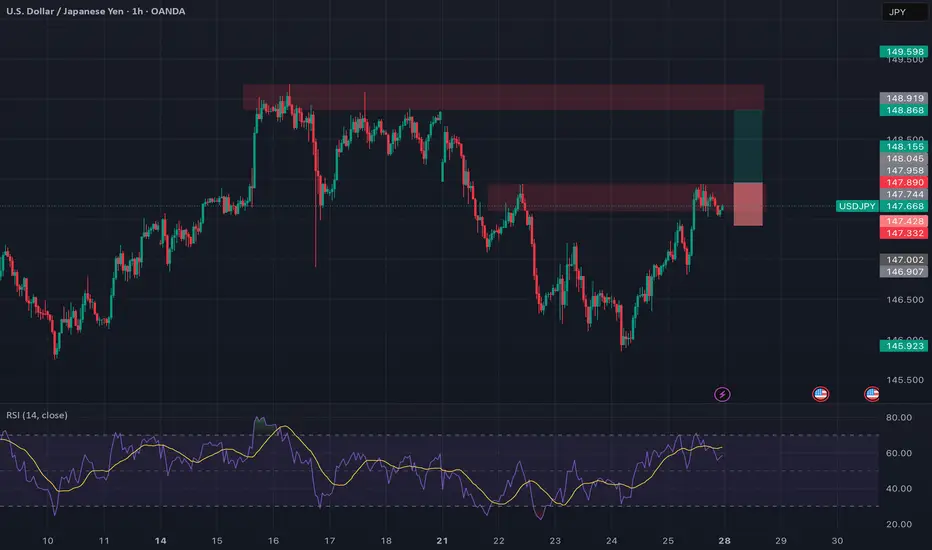
USDJPY: Breaking Out With Macro Backing 🟢 USDJPY | Breakout Opportunity Above Resistance
Timeframe: 1H
Bias: Bullish
Type: Break and Retest
📊 Technical Setup
USDJPY is currently consolidating at a key 4H resistance zone (147.75–147.90). A clean breakout and retest of this area will confirm bullish continuation.
• Entry: Above 147.90 (after confirmed candle close + retest)
• SL: Below 147.30
• TP: 148.90 / 149.60
• RR: ~1:2.5
• Indicators: RSI showing strong upside momentum, holding above 50
🧠 Fundamentals + Macro Confluence
• USD Strength: Strong macro & delayed rate cuts support USD upside
• JPY Weakness: BOJ remains dovish; risk-on sentiment weighing on JPY
• COT + Conditional Score: USD score increased to 17, JPY dropped to 8
• Risk Sentiment: VIX at 14.2 = RISK ON → bearish JPY bias
🧭 Gameplan
“Wait for confirmation above resistance before entering”
🔔 Set alerts around 147.90 and monitor lower timeframes for retest and bullish candle structure.
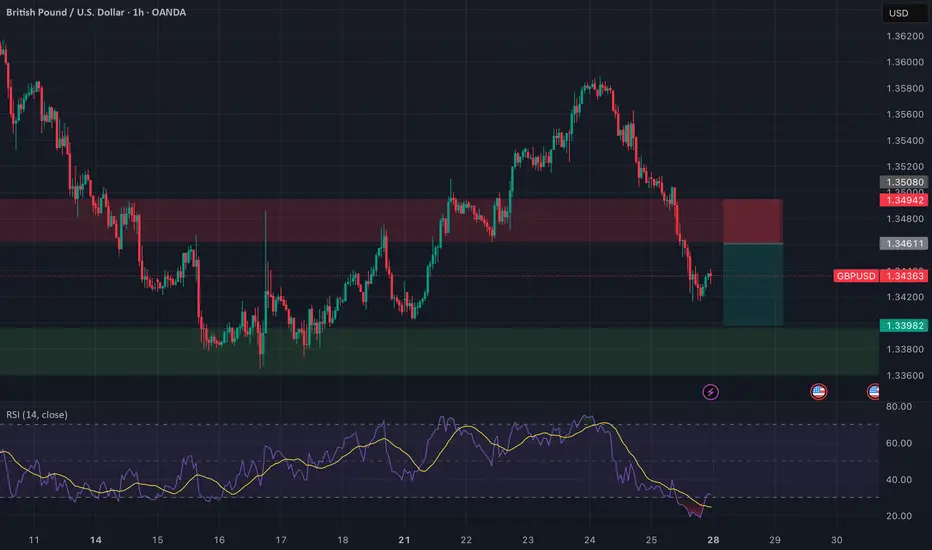
GBPUSD: Selling the Retest | Clean Break, Wait for Confirmation🔻 GBPUSD | Sell the Retest of Broken Support
Timeframe: 1H
Bias: Bearish
Type: Break and Retest
📊 Technical Setup
GBPUSD has broken a key 4H support zone (~1.3460–1.3494) which now acts as a turncoat resistance. Price is currently pulling back, offering a prime opportunity to sell the retest.
• Entry: 1.3460–1.3490 (after confirmation of rejection)
• SL: Above 1.3508
• TP: 1.3398
• RR: ~1:2
• RSI: Bearish momentum, RSI < 50 with mild recovery—ideal for a fade trade
📉 Macro & Fundamental Confluence
• GBP: Despite hawkish BOE tone, GBP is showing technical weakness and soft CFTC positioning
• USD: Strong macro bias with rising conditional score and delayed Fed cuts (still supporting USD strength)
• Seasonal Bias: GBPUSD marked bearish in seasonal chart
• COT Data: GBP positioning turning bearish after previous net build-up
🧭 Gameplan
“Wait for the retest of broken support-turned-resistance to reject before entering short. Stick to the zone.”
🔔 Set alerts around 1.3460–1.3490 and monitor for bearish engulfing or pinbar confirmation.
GBPJPY is in the Down Trend From Resistance LevelHello Traders
In This Chart GBPJPY HOURLY Forex Forecast By FOREX PLANET
today GBPJPY analysis 👆
🟢This Chart includes_ (GBPJPY market update)
🟢What is The Next Opportunity on GBPJPY Market
🟢how to Enter to the Valid Entry With Assurance Profit
This CHART is For Trader's that Want to Improve Their Technical Analysis Skills and Their Trading By Understanding How To Analyze The Market Using Multiple Timeframes and Understanding The Bigger Picture on the Charts
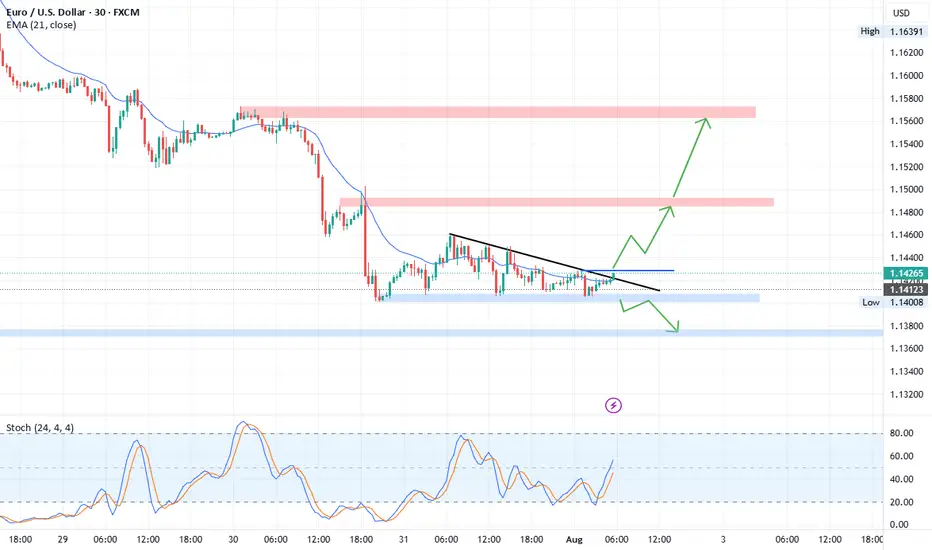
EUR/USD Technical OutlookEUR/USD is currently trading within a Descending Triangle formation. At present, the pair shows a higher probability of an upside breakout from this structure. A confirmed break above the immediate resistance zone at 1.1428 – 1.1430 could accelerate bullish momentum, opening the way toward the next key resistance level at 1.1485.
On the other hand, if the pair fails to sustain above the triangle and breaks to the downside, price may extend losses toward the 1.1375 – 1.1360 support area. From this zone, a potential corrective rebound could occur before the broader bearish trend resumes.
Overall, short-term direction hinges on the breakout of the descending triangle, with 1.1428 – 1.1430 as the critical level to watch for bulls, and 1.1375 – 1.1360 for bears. FOREXCOM:EURUSD
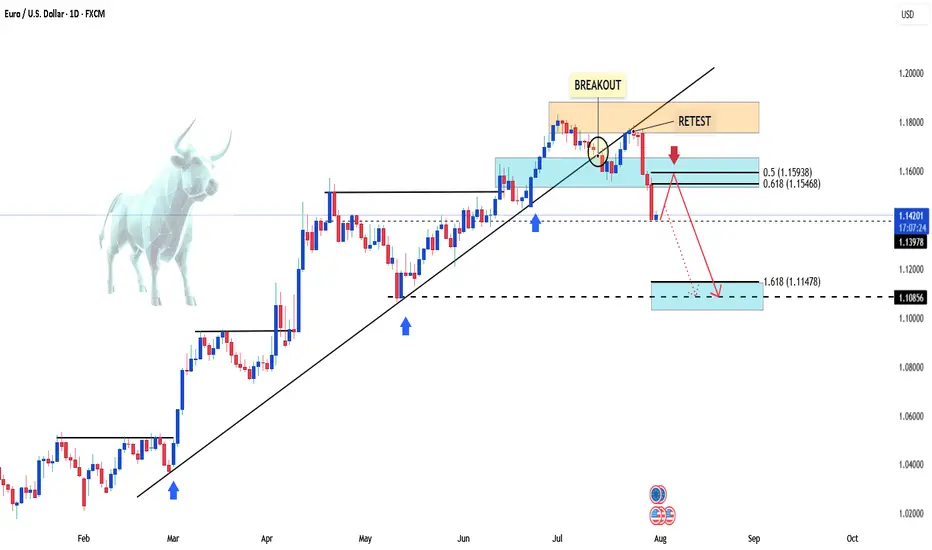
EURUSD – Retest Failed, Bearish Pressure RemainsHello, what’s your take on FX:EURUSD ?
After breaking the trendline, EURUSD attempted a retest but failed. The price is now hovering around 1.142, with selling pressure still evident.
This setup targets the 1.618 Fibonacci extension zone around 1.114. In the short term, a correction based on Dow Theory may unfold — the marked area could offer a perfect selling opportunity.
💡 Priority: SELL on RETEST – strict risk management with clear TP and SL.
Now it’s your turn — what’s your view? Share it in the comments below.
Good luck!
GBPUSD Will Go Down!
HI,Traders !
#GBPUSD keeps falling down
And broke the
Key wide horizontal level
Around 1.33938 which is now
A resistance and the breakout
Is confirmed so we are very
Bearish biased and we will
Be expecting a bearish
Continuation !
Comment and subscribe to help us grow !

How I’m Trading the EURJPY Break of Structure Setup📈 EURJPY Analysis Update 🔍
I'm currently watching EURJPY closely. On the weekly timeframe, the pair is clearly in a strong bullish trend 🚀. Price has recently tapped into a previous daily bullish order block 🧱 — a key zone of interest.
Now, I’m watching for a break of structure (BoS) 📉 followed by a bullish continuation, especially if price pulls back into the fair value gap (FVG) 📊 near the current low.
As always, this setup — along with all key details and trade considerations — is fully broken down in the 🎥 video.
⚠️ This is for educational purposes only and not financial advice.

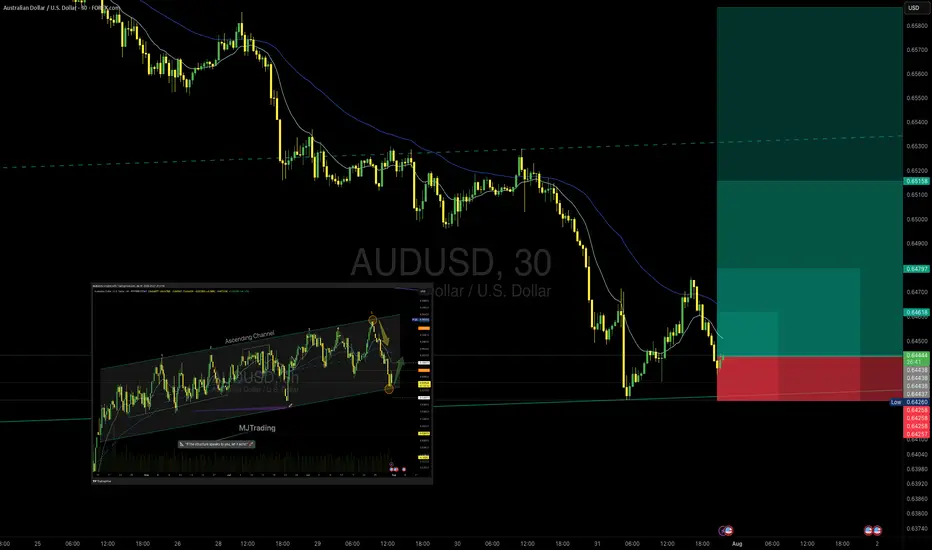
AUD/USD – Potential Bounce Buy SetupOANDA:AUDUSD
Timeframe: 30m
Type: Counter-trend / Bounce from Support
Risk Level: Medium to High
Possible Reward: 4+
🔹 Setup:
Price is testing the lower boundary of the recent support zone (0.6432 – 0.6420), aligning with the previous channel structure visible on the 8h chart. The descending move has shown initial signs of exhaustion, suggesting a potential bounce.
📈 Entry:
Current price zone 0.6432 – 0.6445
🎯 Targets (TP):
TP1: 0.64624
TP2: 0.64797
TP4: 0.65158
⛔ Stop Loss (SL):
0.64250 (below recent swing low and liquidity pool)
8H chart Overview:
Previous Position from top of Channel:
#AUDUSD #Forex #SmartMoney #PriceAction #MJTrading #ChartDesigner
Psychology Always Matters:
Seeking the nearest Sell SideThe image speaks for itself
this is an ict concept idea and from experience work that I have done over 7yrs
Eurusd techinical analysis.Eurusd techinical analysis next move posibale at h1 time frame not finchinal advice.
First possible for SELL After a long buy price need a correction movement and it can be a sell order