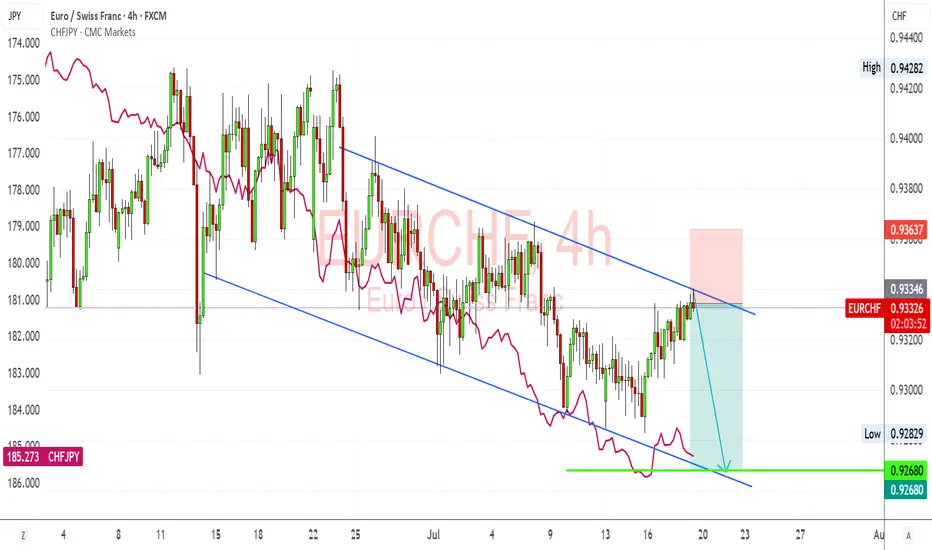
EURCHF – Bearish Channel Holds Firm, CHF Strength Set to ResumeEURCHF just tapped into the descending channel resistance again and is showing signs of rejecting. I'm expecting a bearish continuation here, especially given the strong CHF momentum recently, supported by safe-haven flows and Swiss inflation stability. If the pair fails to break above 0.9340, I’m watching for a downside push back toward 0.9270–0.9265, completing another leg within the structure.
🔍 Technical Setup (4H):
Channel Structure: EURCHF remains firmly within a downward-sloping parallel channel since mid-June.
Resistance Rejection: Price recently tested upper channel resistance (~0.9335–0.9340 zone), aligning with trendline rejection.
Target Support: 0.9270–0.9265 (channel base and key horizontal level).
Confluence: CHFJPY overlay (pink line) is rising again, suggesting renewed CHF strength—this usually weighs on EURCHF.
💡 Fundamental Insight:
EUR Side:
ECB officials remain cautious, but with recent EU data showing weaker growth (especially PMIs and sentiment), euro upside is capped.
The ECB is likely to pause further tightening, while other central banks like SNB remain firm on inflation risks.
CHF Strength:
The Swiss National Bank (SNB) still leans hawkish, with stable inflation giving room to hold rates steady or tighten if needed.
CHF benefits from risk-off flows amid global tariff headlines, China slowdown, and Middle East tensions.
Rising CHFJPY = clear CHF strength across the board.
⚠️ Risks:
If eurozone data surprises to the upside (e.g., inflation rebounds), EURCHF could break out of the channel.
A sudden drop in geopolitical tension or strong risk-on rally could weaken CHF as safe-haven demand falls.
SNB jawboning or FX intervention is always a wildcard.
🧭 Summary:
I’m bearish on EURCHF while it respects this well-defined descending channel. The technicals show consistent lower highs and lower lows, while the fundamentals continue to support CHF strength due to risk aversion, stable inflation, and a resilient SNB. My short bias is valid as long as price remains below 0.9340, with downside targets at 0.9270–0.9265. CHFJPY rising confirms franc leadership across FX markets, and EURCHF is likely a lagger following broader CHF strength.
Forex market
Trading the Pullback on EURJPY My Trade PlanThe EURJPY is clearly in a strong bullish trend 📈, as shown by a consistent pattern of higher highs and higher lows on the 1H timeframe ⏱️. In this video, I’m looking to capitalize on a pullback as a potential buy opportunity 🎯.
We dive into my entry strategy, explore how to align with the prevailing trend, and break down key concepts such as price action, market structure, and smart pullback zones 🧠📊.
⚠️ As always, this is for educational purposes only — not financial advice.

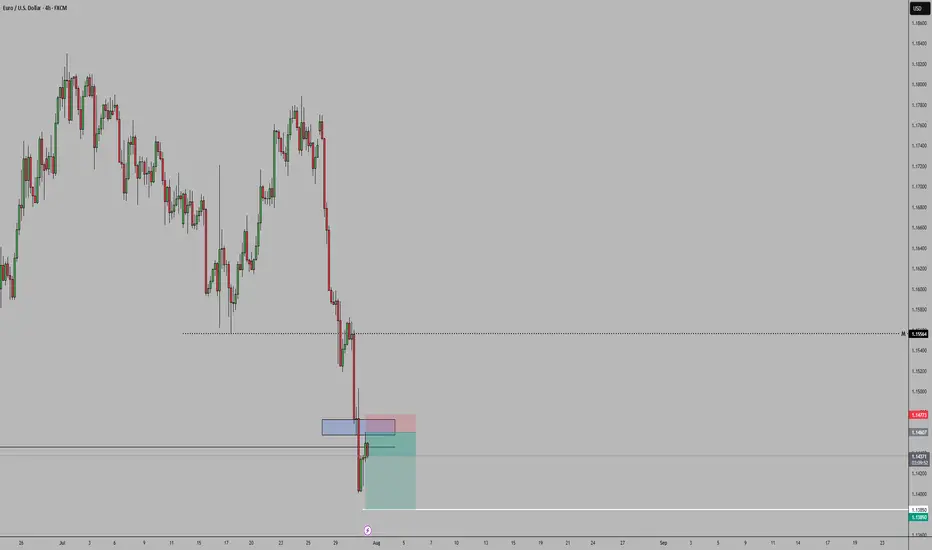
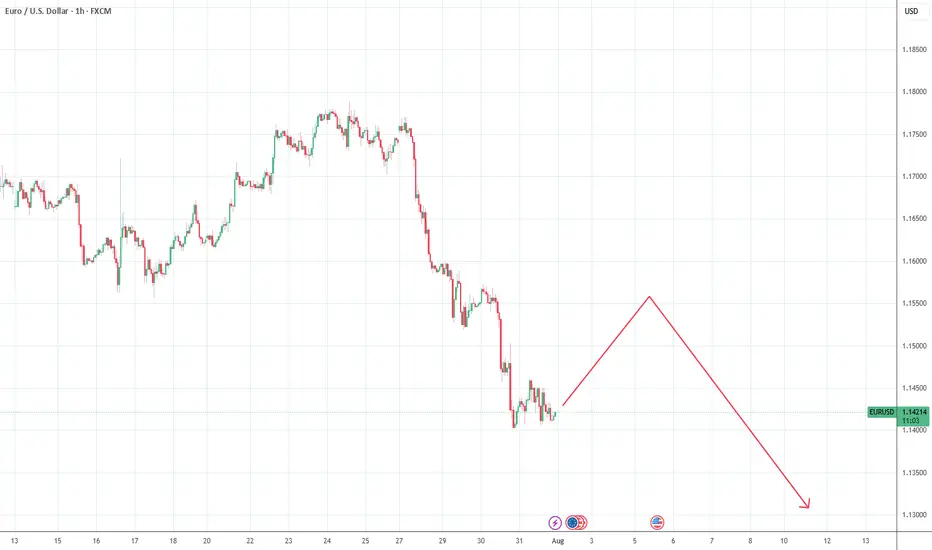
EURUSDWe have a strong bearish sentiment for EURUSD this week, so meaning big instituttions are selling the pair so we follow their lead. And we can see that we just broke below a support which is now acting as a resistance, more bearish momentum continuation can we expected
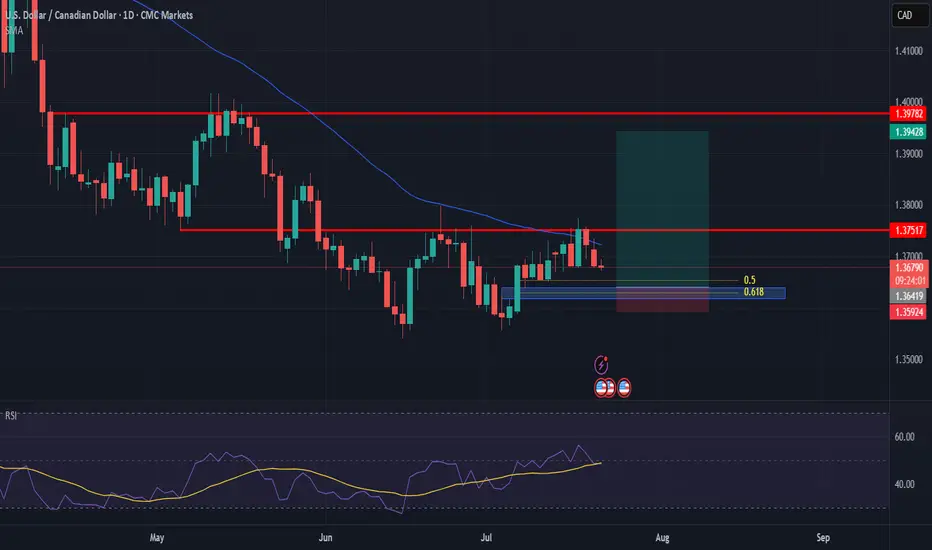
USDCAD possible 300pips ideaWe have this double bottom formation, re-tested the neckline at 1.3750
We could see a higher low forming around the 50% to 61% fib.
So area of interest to go long here would be at 1.3650 to 1.3620
Will update if oportunity to get in shows up.
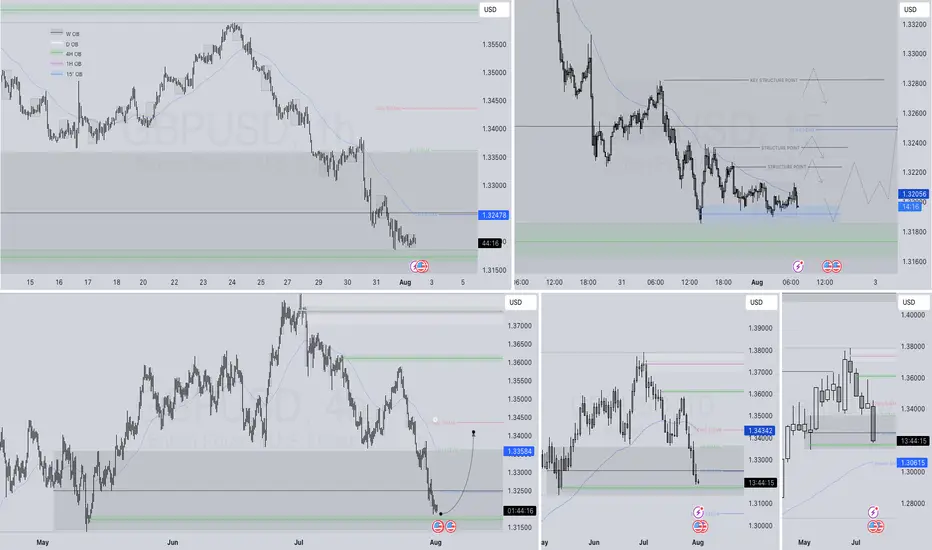
GBPUSD – DAILY FORECAST Q3 | W31 | D1 | Y25📊 GBPUSD – DAILY FORECAST
Q3 | W31 | D1 | Y25
Daily Forecast 🔍📅
Here’s a short diagnosis of the current chart setup 🧠📈
Higher time frame order blocks have been identified — these are our patient points of interest 🎯🧭.
It’s crucial to wait for a confirmed break of structure 🧱✅ before forming a directional bias.
This keeps us disciplined and aligned with what price action is truly telling us.
📈 Risk Management Protocols
🔑 Core principles:
Max 1% risk per trade
Only execute at pre-identified levels
Use alerts, not emotion
Stick to your RR plan — minimum 1:2
🧠 You’re not paid for how many trades you take, you’re paid for how well you manage risk.
🧠 Weekly FRGNT Insight
"Trade what the market gives, not what your ego wants."
Stay mechanical. Stay focused. Let the probabilities work.
FX:GBPUSD
USDCAD Analysis – July 16, 2025
Following the ceasefire between Iran and Israel, oil prices have weakened, reducing support for the Canadian dollar, which is closely tied to crude. As a result, CAD could remain among the weaker currencies over the next two weeks.
Meanwhile, the US dollar may gain strength following the CPI data released on July 15, 2025, potentially setting up a favorable swing opportunity for USDCAD bulls.
🟥 High-Risk Setup – R:R 7.0
This aggressive setup targets a sharp upside move with a tight stop loss, aiming for a high reward relative to the risk. It's suitable for traders comfortable with volatility and willing to accept a lower probability for a higher payout.
🟦 Moderate-Risk Setup – R:R 2.5
A more balanced scenario with a wider stop and a closer target, offering a higher probability of success and smoother trade management. This setup aligns well with swing trading strategies seeking consistent results.
Both setups are based on the current price action structure visible on the chart.
Trade safe, manage your risk, and follow your plan. ✅

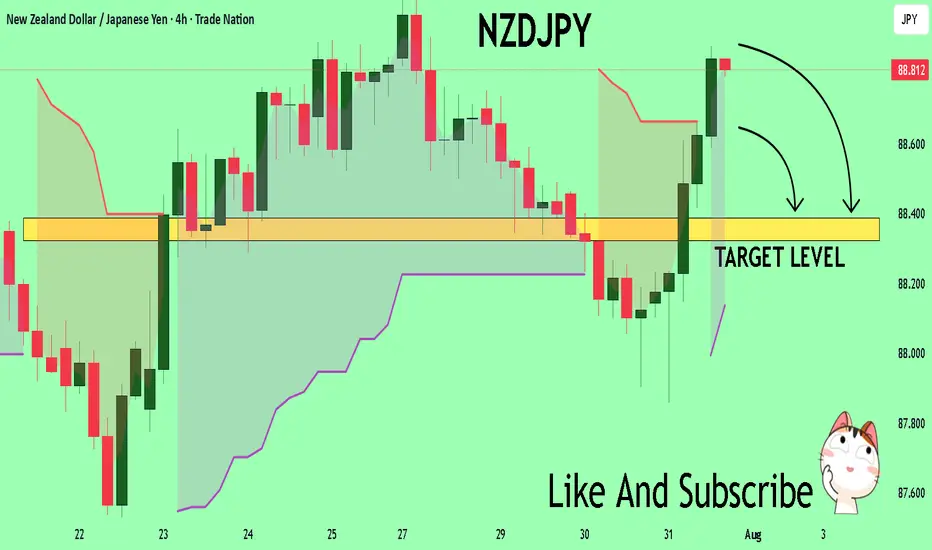
NZDJPY The Target Is DOWN! SELL!
My dear friends,
Please, find my technical outlook for NZDJPY below:
The price is coiling around a solid key level - 88.806
Bias - Bearish
Technical Indicators: Pivot Points Low anticipates a potential price reversal.
Super trend shows a clear sell, giving a perfect indicators' convergence.
Goal - 88.388
About Used Indicators:
The pivot point itself is simply the average of the high, low and closing prices from the previous trading day.
Disclosure: I am part of Trade Nation's Influencer program and receive a monthly fee for using their TradingView charts in my analysis.
———————————
WISH YOU ALL LUCK
Cadjpy sellCad jpy looks rdy for a pullback, I will sell at 108.810 and take profits at 108.432 happy trading be good humans. 🙏

AUD/JPY bulls eye 99, 100The yen is broadly weaker, which is even allowing a weaker Australian dollar to rise. And with a decent bullish trend on the daily chart, I am now seeking dips within a recent consolidation range in anticipation of a move to 99 or even 100.
Matt Simpson, Market Analyst at City Index and Forex.com

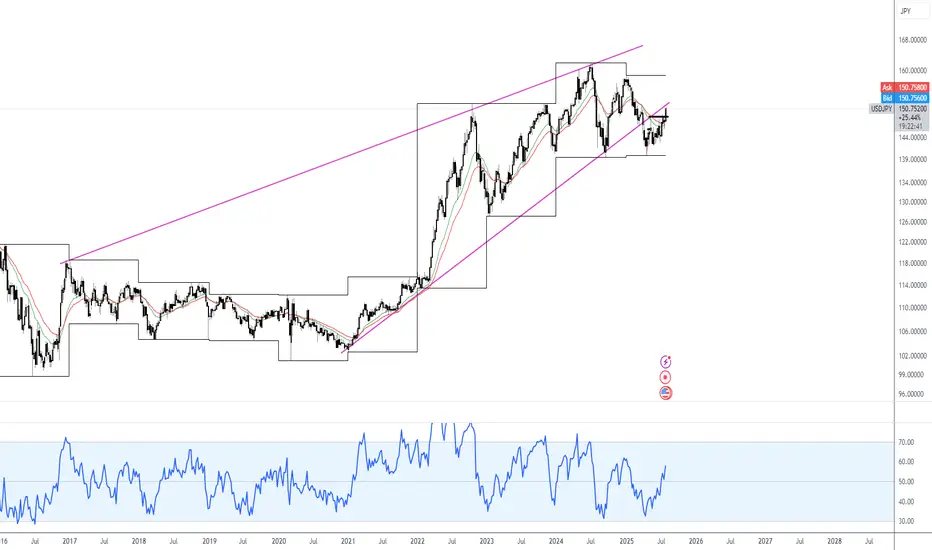
What we looking at heeeeeeeeeeere? My meaningful description is Im looking at this USDJPY pair and drawing magic lines, follow me for more meaningful insights.
TLDR possible long term down trend incoming, if confirmed, plentiful continuation shorts will be available to all.
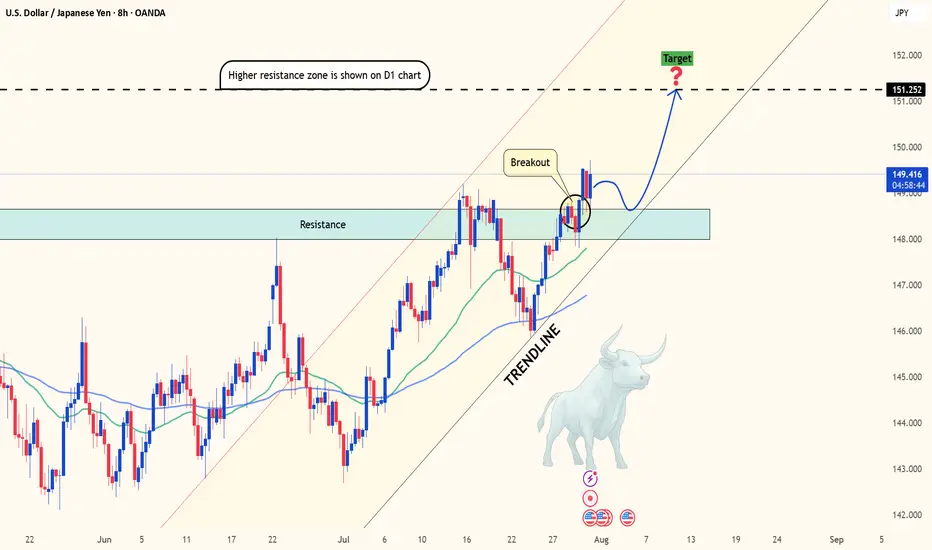
USDJPY breaks out as US data crushes forecastsHello traders! Do you think USDJPY will continue its upward momentum?
From a technical perspective, after several sessions of "building pressure," this pair has finally broken through a key resistance zone—opening the door to what could be the next bullish breakout.
Current price action suggests the uptrend remains firmly intact. The market continues to respect the rising trendline and finds strong support near the 34 & 89 EMA – a powerful technical combination that buyers often rely on. This isn’t just a typical breakout; it could be the start of a brand-new bullish cycle.
On the fundamental side, the U.S. dollar remains strong, supported by a string of solid economic data: employment, PCE, and consumer spending have all exceeded expectations. Meanwhile, the Japanese yen remains in “hibernation” as the Bank of Japan shows no sign of shifting away from its ultra-loose monetary policy. This divergence makes USDJPY one of the hottest pairs on the radar right now.
What’s next? If bullish momentum continues, the 151.25 level is likely the next short-term target. However, if the price encounters strong resistance at that level, a minor pullback could occur before the uptrend resumes.
So, what do you think? Is this the beginning of a major rally – or just a false breakout? Share your thoughts in the comments!
Wishing you successful and well-timed trades ahead!
GBPUSD IDEA The key is patience- from all the ideas, well wait for the clearest ones that give us confirmation... and then we jump in. lets goooooo

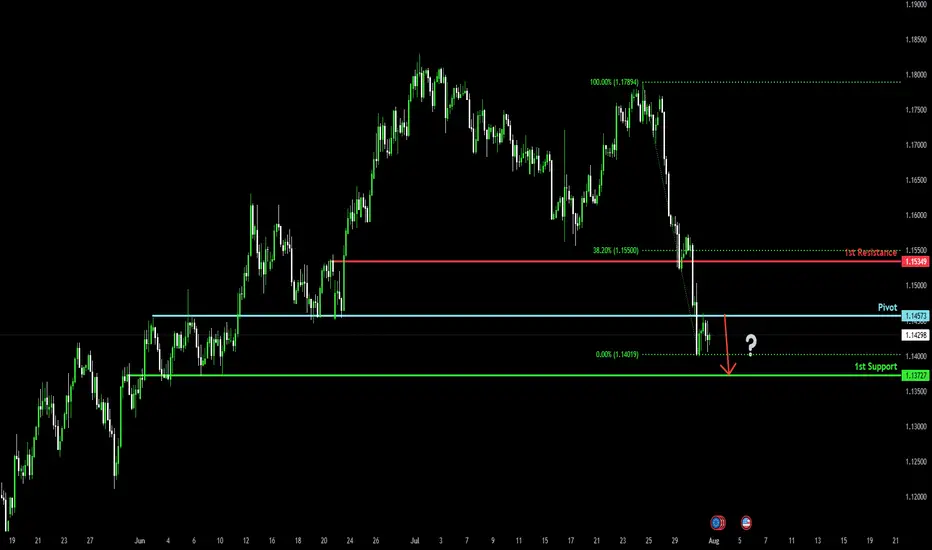
Bearish drop?The Fiber (EUR/USD) has rejected off the pivot and could potentially drop to the 1st support, which acts as an overlap support.
Pivot: 1.1457
1st Support: 1.1372
1st Resistance: 1.1534
Risk Warning:
Trading Forex and CFDs carries a high level of risk to your capital and you should only trade with money you can afford to lose. Trading Forex and CFDs may not be suitable for all investors, so please ensure that you fully understand the risks involved and seek independent advice if necessary.
Disclaimer:
The above opinions given constitute general market commentary, and do not constitute the opinion or advice of IC Markets or any form of personal or investment advice.
Any opinions, news, research, analyses, prices, other information, or links to third-party sites contained on this website are provided on an "as-is" basis, are intended only to be informative, is not an advice nor a recommendation, nor research, or a record of our trading prices, or an offer of, or solicitation for a transaction in any financial instrument and thus should not be treated as such. The information provided does not involve any specific investment objectives, financial situation and needs of any specific person who may receive it. Please be aware, that past performance is not a reliable indicator of future performance and/or results. Past Performance or Forward-looking scenarios based upon the reasonable beliefs of the third-party provider are not a guarantee of future performance. Actual results may differ materially from those anticipated in forward-looking or past performance statements. IC Markets makes no representation or warranty and assumes no liability as to the accuracy or completeness of the information provided, nor any loss arising from any investment based on a recommendation, forecast or any information supplied by any third-party.
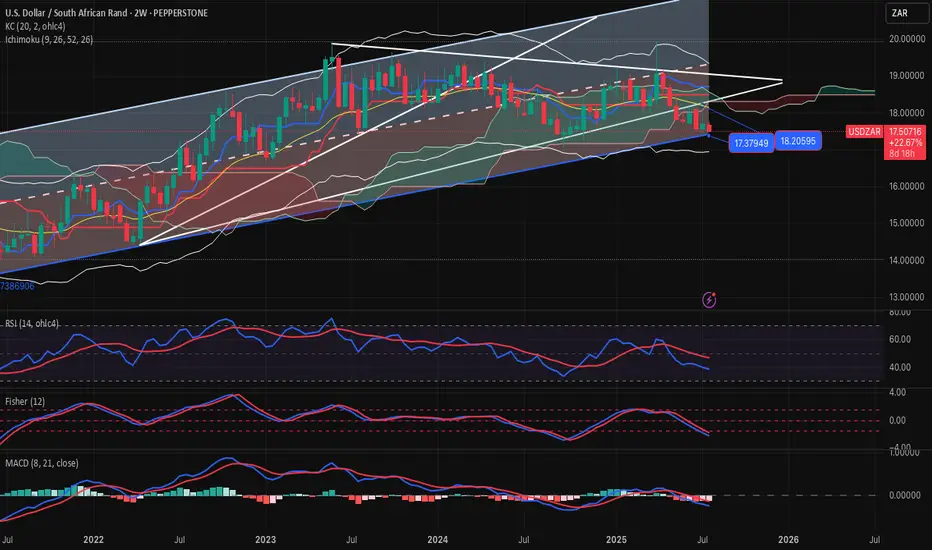
USDZAR-BUY strategy 2-weekly chart Reg. ChannelThe pair is overall on negative mode long-term basis. However, judging the bottom of the channel 17.3700 area or slightly below, BUY entry might look interesting for a recovery medium-term.
Gold is under pressure4 again and medium-term is is overbought, considering that, the pair may find benefit moving back towards 18.1000 area again.
Strategy BUY into 17.35-17.45 region for profit target 18.0975.
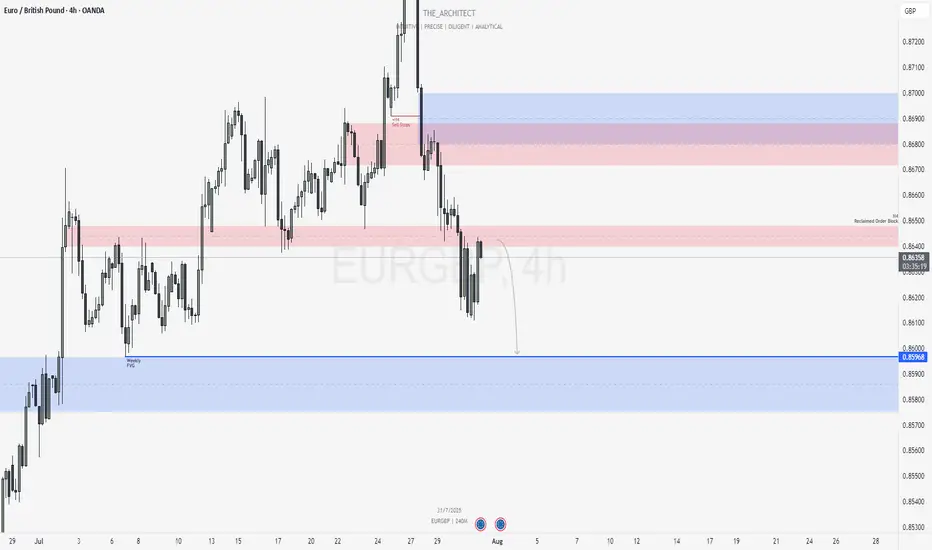
EURGBP: Bearish Continuation from Reclaimed Order Block!Greetings Traders,
In today’s analysis of EURGBP, we observe that institutional order flow on the H4 timeframe has recently shifted bearish. This provides us with a clear directional bias to look for shorting opportunities in line with the prevailing higher timeframe trend.
Higher Timeframe Context:
On the weekly timeframe, price action is currently drawing towards a Weekly Fair Value Gap (FVG). This bearish draw on liquidity confirms the macro-level bearish sentiment. With the recent bearish market structure shift (MSS) on the H4, we now have strong confluence between the weekly and intraday order flow, favoring continued downside.
Key Observations on H4:
Reclaimed Bearish Order Block: After shifting structure to the downside, price has retraced into a bearish reclaimed order block—a region previously marked by institutional selling. This return to the origin of prior sell-side imbalance offers institutions the opportunity to mitigate earlier positions and reinitiate shorts. The failure of price to break higher confirms bearish intent.
Confluence with Weekly Draw: The reclaimed order block aligns with the broader draw towards the weekly FVG, providing an optimal zone for bearish confirmation entries.
Trading Plan:
Entry Strategy: Look for lower timeframe confirmation entries within the H4 reclaimed order block.
Target: The short-term target remains the Weekly Fair Value Gap, supporting a discount-side delivery.
As always, remain disciplined in execution. Let the market confirm your bias before entering, and manage risk according to your rules.
For a detailed market walkthrough and in-depth execution zones, be sure to watch this week’s Forex Market Breakdown:
Kind Regards,
The Architect 🏛️📉
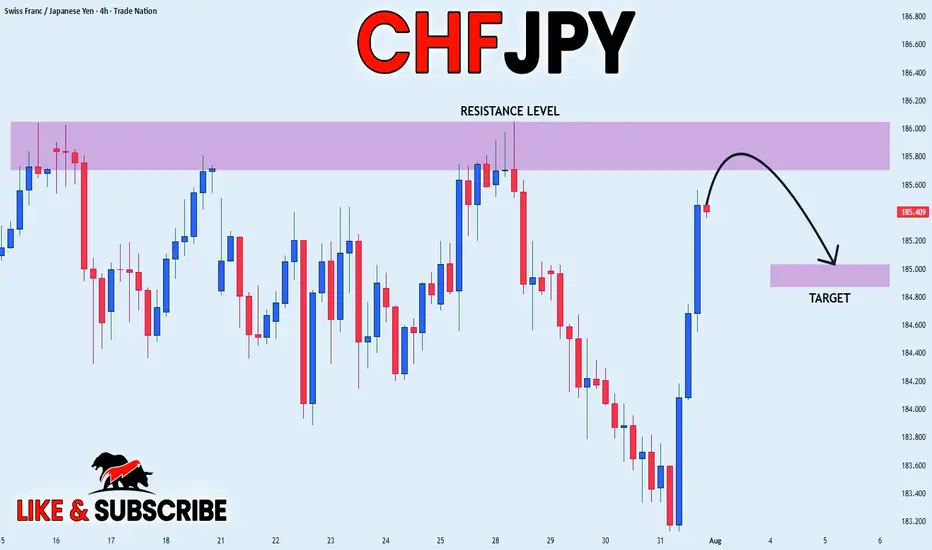
CHF_JPY LOCAL SHORT|
✅CHF_JPY has been growing recently
And the pair seems locally overbought
So as the pair is approaching a
Horizontal resistance of 186.000
Price decline is to be expected
SHORT🔥
✅Like and subscribe to never miss a new idea!✅
Disclosure: I am part of Trade Nation's Influencer program and receive a monthly fee for using their TradingView charts in my analysis.
NZDUSD Bearish towards .5925!1). Wave 5 drop needs a completion lower! 2). Risk is selling off! 3). Volume is falling! 4). Price appears to be heading towards lower market sentiment! 5). Trump is imposing more Tariffs, which is likely causing deeper corrections!

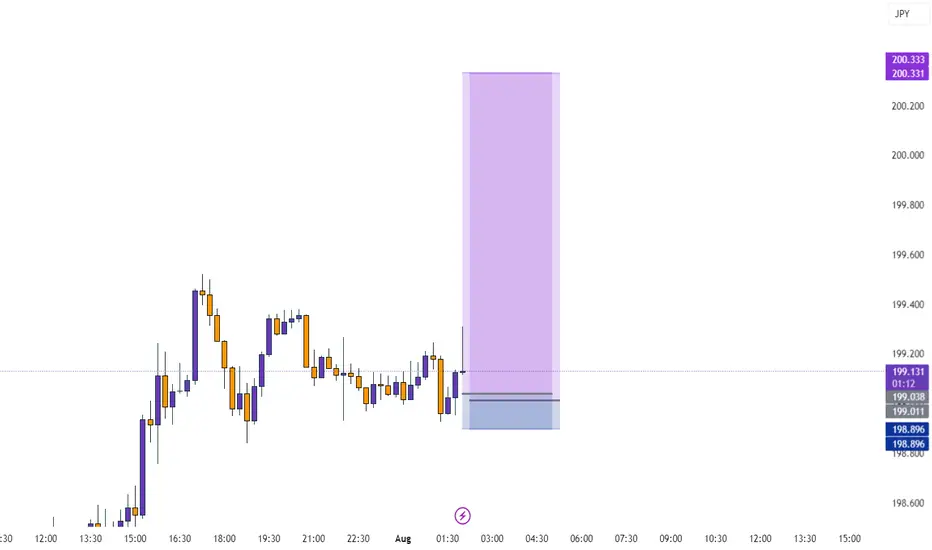
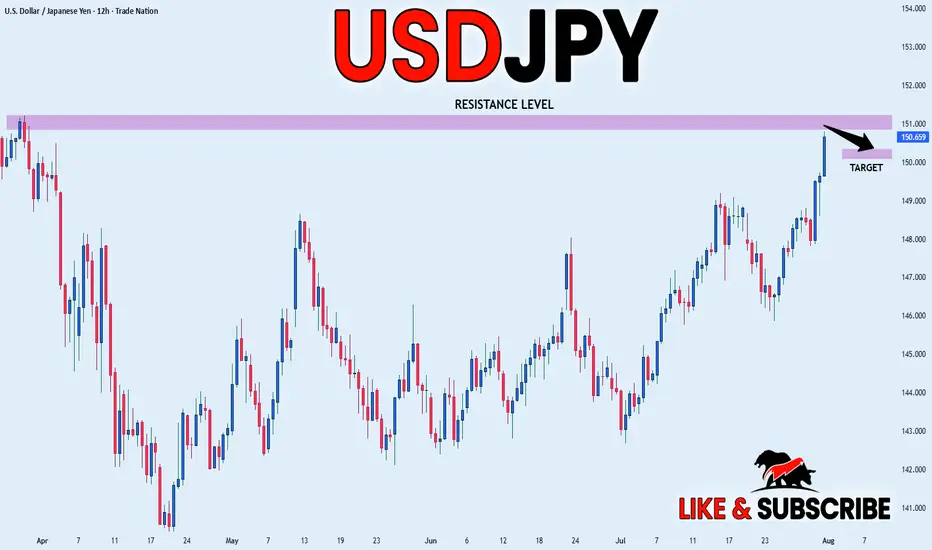
USD_JPY RESISTANCE AHEAD|SHORT|
✅USD_JPY is going up now
But a strong resistance level is ahead at 151.232
Thus I am expecting a pullback
And a move down towards the target of 150.368
SHORT🔥
✅Like and subscribe to never miss a new idea!✅
Disclosure: I am part of Trade Nation's Influencer program and receive a monthly fee for using their TradingView charts in my analysis.
31/07/25 Price break downSame again people although different model this time, kept it simple with a two stage SMT and a 4hr TPD although it arguably got indvalidated plus my 6hr tpd analysis was wrong but youll see when you hopefully watch

GBPAUDI’m confident in the short-term upward trend. I’ll monitor how the price reacts when it reaches my anticipated level, but until then, I need to remain precise and realistic about my targets.

AUDCADThe price is currently at a key level. We need confirmation on the 15-minute or 5-minute timeframe before considering a long entry.