Rates Coming Down?TLT could be a great trade here. I'm seeing signs that the low could be in. The RSI is coiling up and piercing the downtrend. We are also climbing above the 21 Week Moving average, which is has been firm resistance since the rate hiking cycle.
Bond yields are tanking, employment is weakening, pres
ETF market

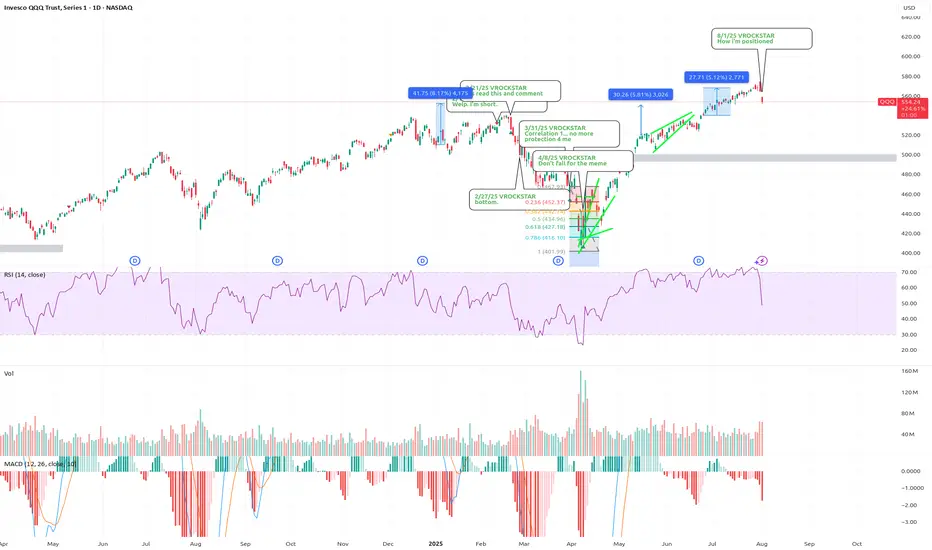
8/1/25 - $qqq - How i'm positioned 8/1/25 :: VROCKSTAR :: NASDAQ:QQQ
How i'm positioned
- 2x leverage on the whole book. 75% at risk so 150% gross
- so 25% powder
47% obtc
30% nxt (12.5% leaps)
36% deck (ST and leaps for 6.5%)
27% lulu (ST gas for 1% lol!)
8% mstr (ST gas for 80 bps lol!)
5% gme (ST gas for 40 bps!)
5% ses (cove
$UVXY Signaling Trouble — $SPY Could Drop 10%+ In this video, I discuss why August/September could bring serious downside for the market, despite my long-term bullish stance.
Right now, SPY is trading around $632, but I have a downside target of $573 in the short term. If we get volume beneath $573 — especially a break below the daily EMA — SPY

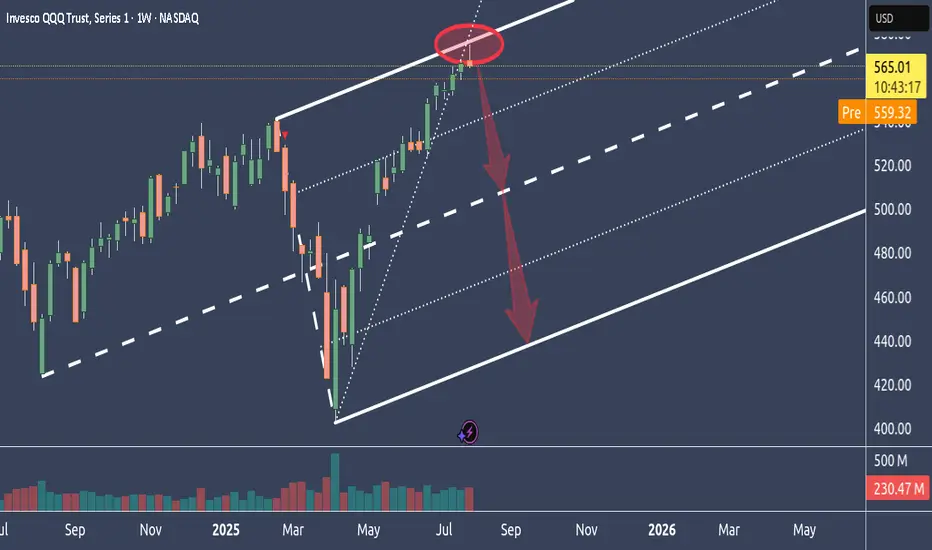
Why NQ is probably tanking big timeIn this weekly chart, we see QQQ, which represents the Nasdaq.
As we can see, it had a hell of a run up.
Too far too fast IMO, and it reached the stretch level at the Upper Medianline Parallel.
The natural move is now to let go, take a breath and trade down to center again, which is the Centerline
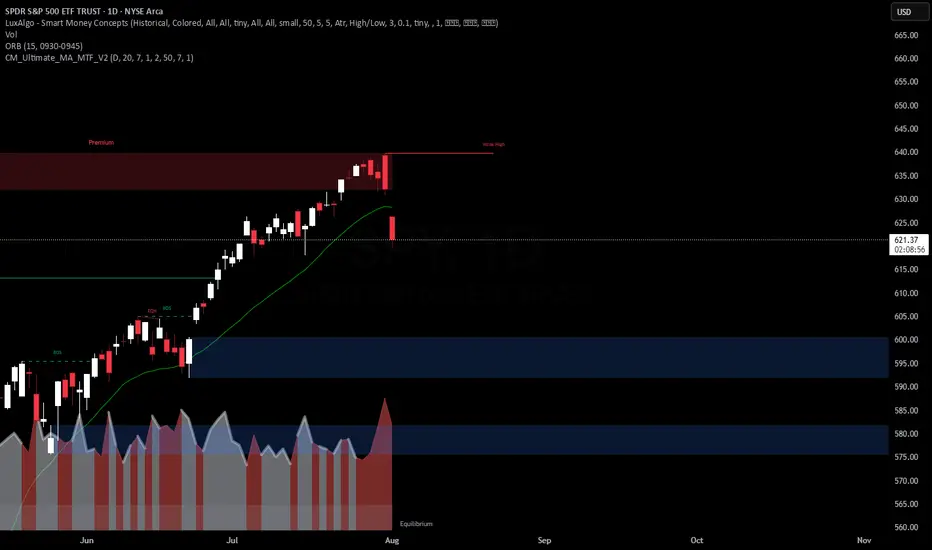
SPY: I think dollar milkshake is brewing, buying for long term📉 SPY Daily Breakdown – Aug 1, 2025 | VolanX Observations
🧠 Bot failed today, but the market taught more than any trade could have. Sitting out gave me the clarity to reassess structure and edge.
🔍 Market Structure Update:
Gap Down from Premium Zone: Today’s price action rejected the weak high and
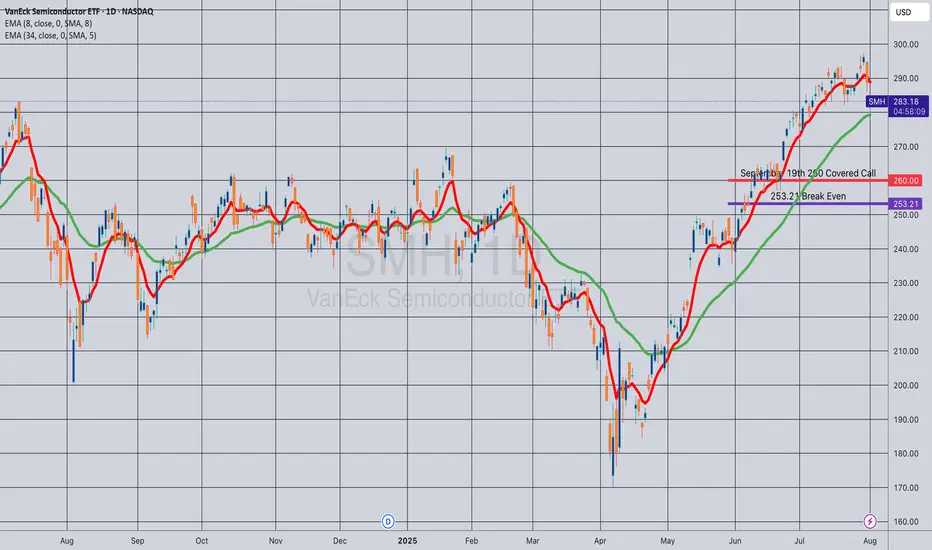
Opening (IRA): SMH September 19th 260 Covered Call... for a 253.21 debit.
Comments: One of the higher IV ETF's at the top of my board. Selling the -75 delta call against shares to emulate the delta metrics of a 25 delta short put, but with the built-in defense of the short call.
Metrics:
Break Even/Buying Power Effect: 253.21
Max Profit: 6.79
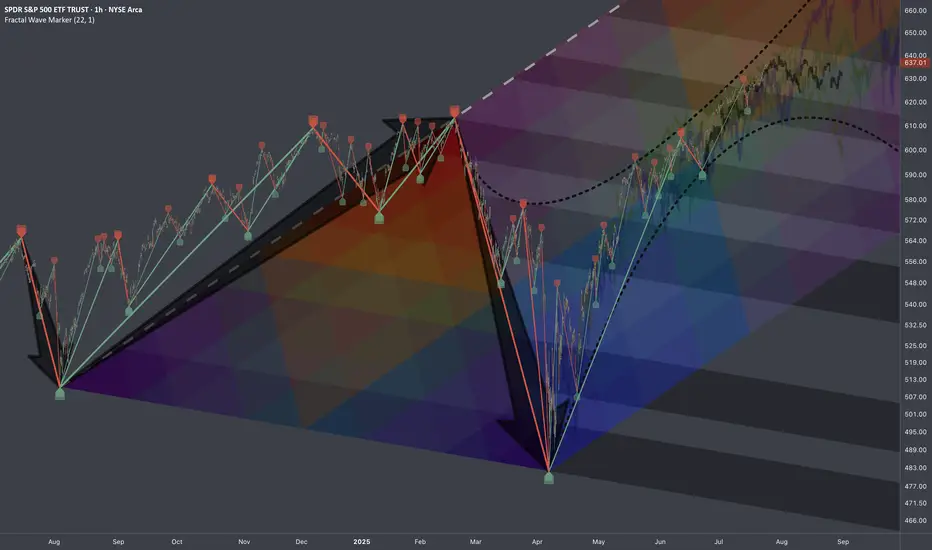
$SPY: Mapping Scenarios🏛️ Research Notes
Fractal Corridors
Shows recursive formations which indicates a full fractal cycle.
The angles of decline are parallel which is important for potential buildup.
To map a cycle we'd need to apply fib channel to the opposite direction In a way this should be sufficient to
THE STOCK MARKET IS BULLISH BUT NEEDS A SMALL CORRECTIONIn this video, we look at the weekly chart of the S&P 500 to determine if a correction is near and spoiler alert. Yes, it is. Here's what happens.

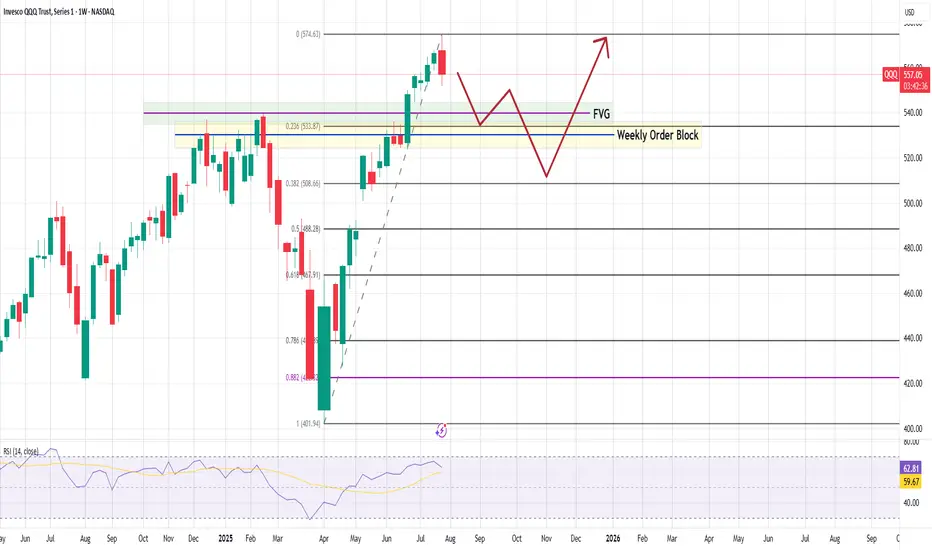
#QQQ Weekly Chart – Technical Breakdown As of August 1, 2025QQQ Weekly Chart – Technical Breakdown
🧠 Key Observations
Bearish Weekly Rejection
A red candle at the recent high ($574.63) suggests buyers are taking profits.
Short-term reversal likely in play.
First Reaction Zone:
0.236 Fib at $533.87 is the first potential bounce zone.
Aligned with:
Fair
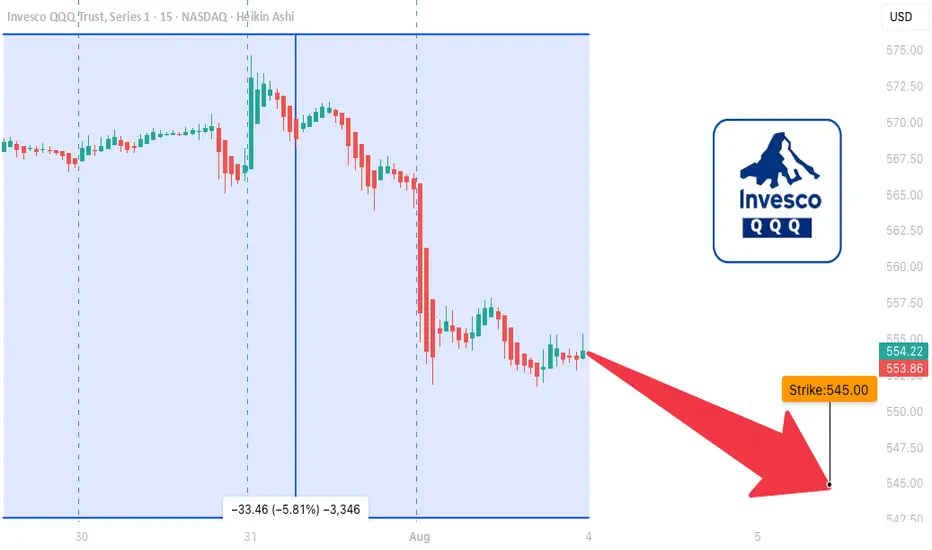
QQQ LEAP Trade Thesis – Aug 1, 2025
🧠 **QQQ LEAP Trade Thesis – Aug 1, 2025**
🎯 **Setup**: High-conviction LEAP PUT
📉 **Bias**: 🔻 *Moderate Bearish*
📆 Horizon: Long-Term (12+ months)
---
📊 **Multi-Model Intelligence Summary**
🧪 **Grok (xAI)**
• Monthly RSI = bearish 📉
• Trading near 52W highs = overvalued 💥
• Suggests: \$545 PUT
See all popular ideas
Community trends
SymbolPrice & chgNAV total return 1Y
SymbolNAV total return 1Y / Price
SymbolPrice & chgDividend yield FWD
SymbolDividend yield FWD / Price
ETF collections
LargestHighest AUM growthHighest returnsBiggest losersEquityBitcoinEthereumGoldFixed incomeReal estateTotal marketCommoditiesAsset allocationInverseLeveragedMost tradedLargest inflowsLargest outflowsHighest discount to NAVHighest premium to NAVHighest yieldDividendMonthly distributionsHighest diversificationActively managedSectorHighest betaLowest betaNegative betaHighest expense ratioAll-time highAll-time low52-week high52-week lowETFs of the USAETFs of CanadaETFs of the United KingdomETFs of GermanyETFs of JapanETFs of AustraliaSee all