$SPY $SPX Analysis, Key Levels & Targets 9.8.25
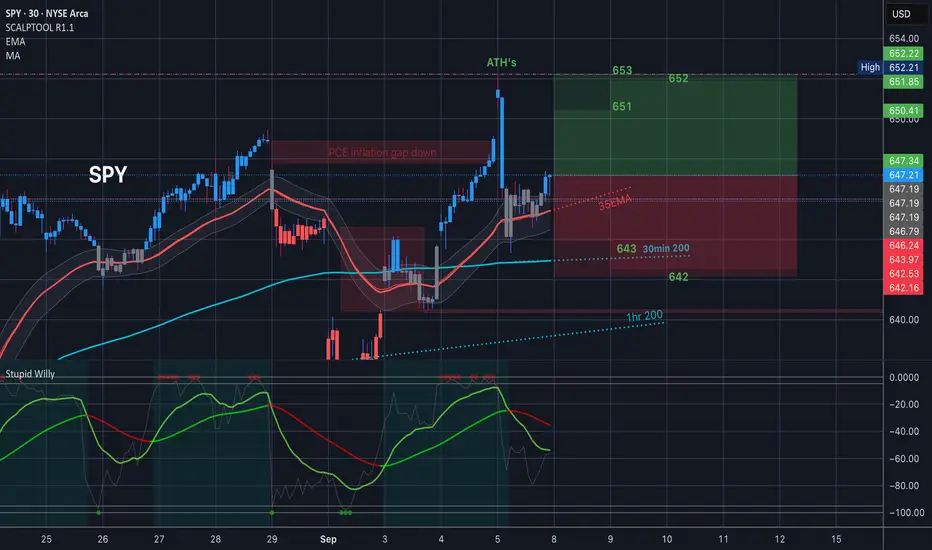
Alright, guys… it’s time to get to it again. The trading range for tomorrow has ATH’s at the extreme top of the trading range, then under that the 35EMA and then 30min 200MA. That’s it. That is all you need to know.
ETF market
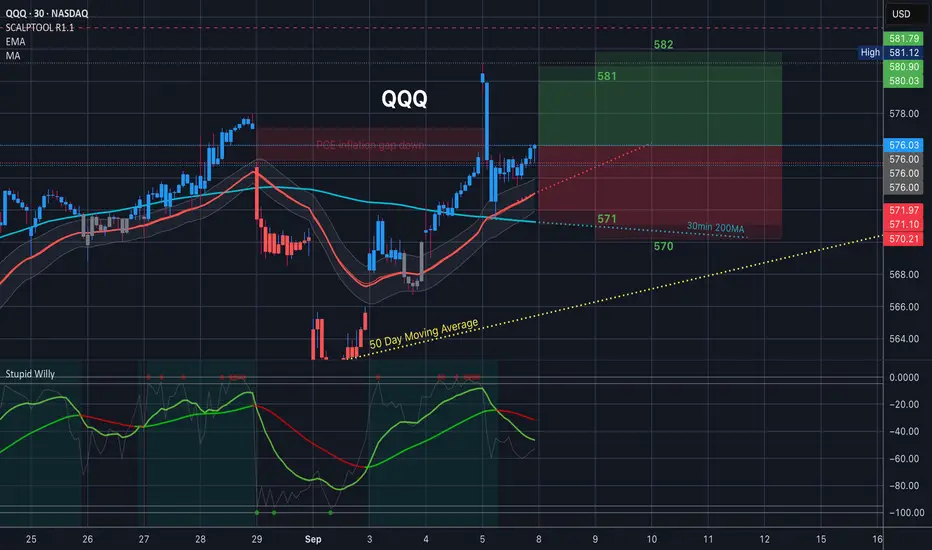
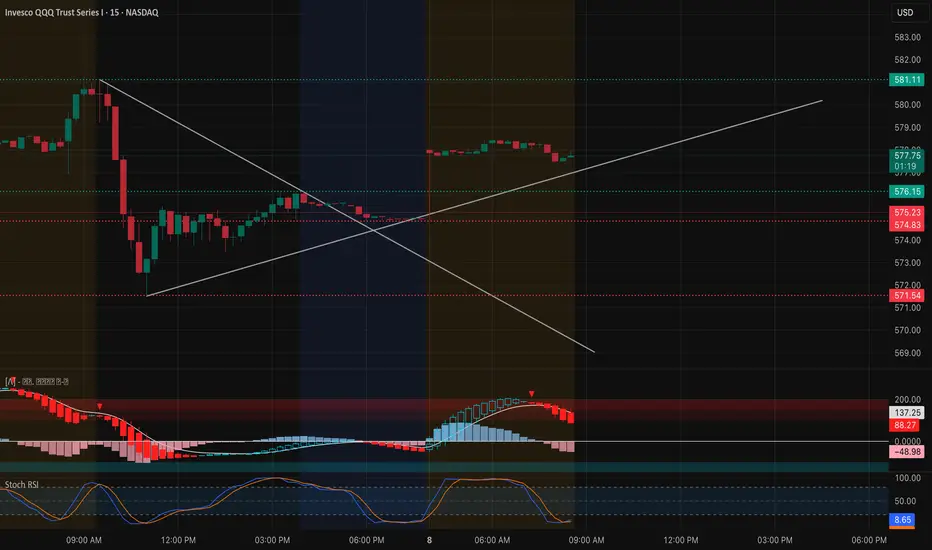
$QQQ Analysis, Key Levels & Targets 9.8.25
Watch that downward facing 30min 200MA - that looks like trouble.
35EMA and 30min 200MA are the only levels in tomorrow’s range so I would look down, personally
SPY Market Preview for Monday, September 8
Price Action & Market Structure
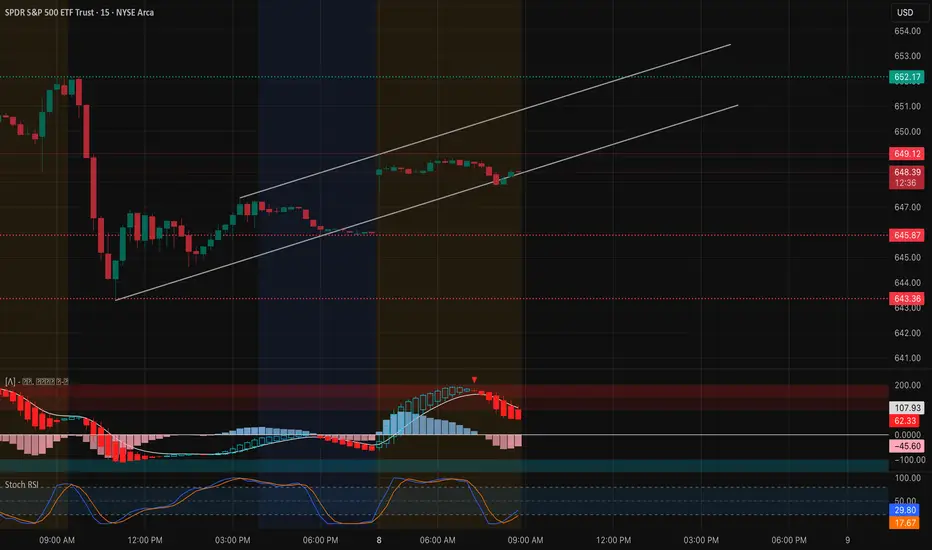
* SPY is trading around 648.4, consolidating inside a rising channel after bouncing from 644 HVL support.
* Momentum has slowed after rejecting near 649–650, but structure is still constructive as long as price holds above 646–645.
* Market bias remains neutral-to-bullish unless 644 breaks.
Key Levels
* Resistance (Upside Caps):
* 649–650 → Immediate resistance zone.
* 651–652 → Strong Call Wall / Gamma resistance.
* 653–655 → Higher extension levels.
* Support (Downside Floors):
* 646.0 HVL → Key balance level.
* 645.0–644.0 → Strong support cluster.
* 643.0–640.0 → Put Walls / deeper cushion.
Options Sentiment (GEX & IV)
* GEX: Bearish skew, with Puts 117.6% dominating positioning.
* IVR: 11.6, relatively low → options market not expecting extreme moves.
* Gamma Walls:
* 652–653 = Strong Call resistance.
* 646–644 = Strong support zone.
Indicators
* MACD (15m): Rolling bearish after early strength, showing momentum fading.
* Stoch RSI: Resetting lower, oversold zone nearing, could support bounce if 646 holds.
Scenarios for Today
Bullish Case (if 646–645 holds):
* Defend 646–645 support, push through 649–650.
* Targets: 651–652 → 653–655.
Bearish Case (if 646 fails):
* Breakdown under 646–645, move into 644 HVL.
* If 644 breaks → accelerated downside toward 643–640.
Trading Thoughts
* Longs: Buy dips near 646–645, targeting 650–652, stops below 644.
* Shorts: Fade rejection at 650–652, stops above 653.
* Stops:
* Longs → below 644.
* Shorts → above 653.
Summary
SPY sits at a pivotal mid-zone (646–650). Holding this range favors upside continuation into 652–655, but options positioning (Put heavy) warns of downside hedging pressure. A clean break under 646–644 flips momentum bearish into 640.
⚠️ This analysis is for educational purposes only, not financial advice. Always manage risk properly.
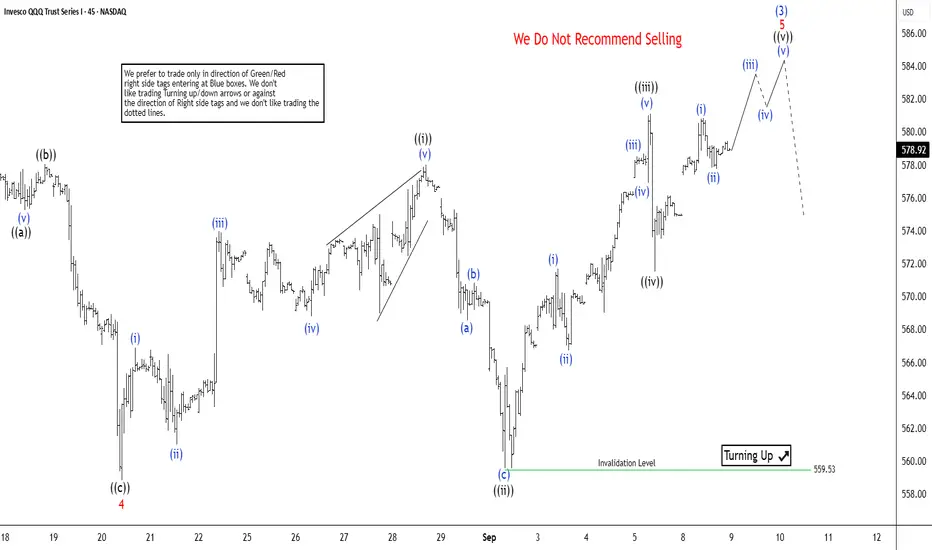
QQQ Nearing wave (3) Termination at 589The short-term Elliott Wave analysis for the Nasdaq 100 Index ETF (QQQ) indicates it is approaching the completion of wave (3) from its April 2025 low. This wave (3) unfolds as a five-wave impulse structure. Wave 1 concluded at 467.83, followed by a wave 2 pullback to 427.93. Subsequently, wave 3 surged to 583.32, and wave 4 retraced to 558.84, as illustrated in the 45-minute chart.
Currently, wave 5 is developing as a diagonal pattern. From the wave 4 low, wave ((i)) peaked at 578, with wave ((ii)) dipping to 559.53. Wave ((iii)) then climbed to 581.12, followed by a wave ((iv)) pullback to 571.53. As long as the ETF remains above 559.53, it is poised to extend higher in wave ((v)) of 5, which should also finalize wave (3) on a higher degree. The potential target for wave 5 lies between 589 and 598, calculated using the 123.6% to 161.8% inverse Fibonacci retracement of wave 4.
This analysis suggests a bullish near-term outlook for QQQ, with the ETF likely to reach the projected range before completing wave (3). Traders should monitor the 559.53 support level to confirm the continuation of this upward move. The structure remains intact, supporting further gains in the short term.
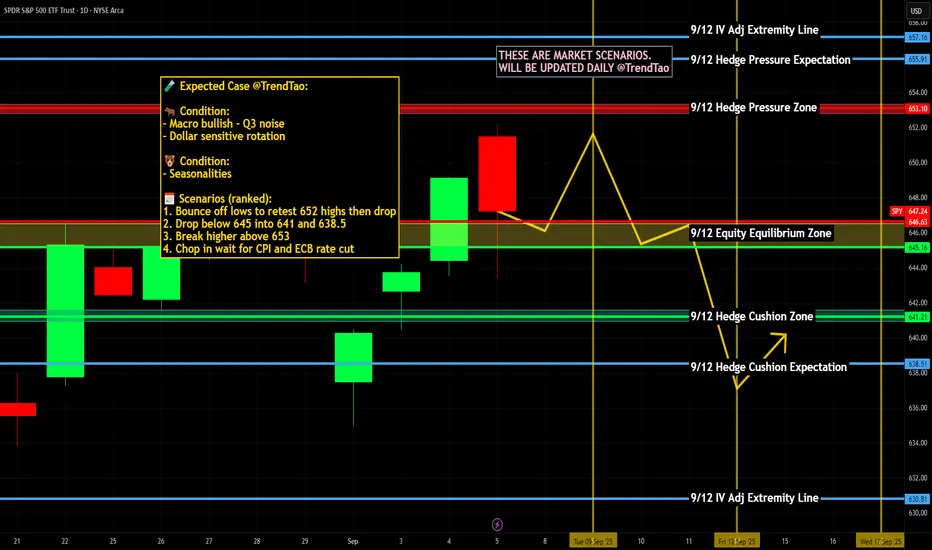
Weekly $SPY / $SPX Scenarios — Sept 8 → Sept 12, 2025🔮 Weekly AMEX:SPY / SP:SPX Scenarios — Sept 8 → Sept 12, 2025 🔮
🌍 Themes
🚩 Inflation week: PPI (Wed), CPI (Thu) drive the Fed path.
🏦 Fed watch: Data into the Sept FOMC; ECB decision adds global spillovers.
💬 Sentiment wrap: UMich (Fri) gives the consumer read.
📊 Key Data & Events (ET)
Mon 9/8
⏰ 3:00 PM — Consumer Credit (G.19)
Tue 9/9
⏰ 6:00 AM — NFIB Small Business Optimism (Aug)
Wed 9/10
⏰ 🚩 8:30 AM — PPI (Aug)
Thu 9/11
⏰ 🚩 8:30 AM — CPI (Aug)
⏰ 🚩 8:30 AM — Initial Jobless Claims (weekly)
⏰ 8:15 AM — ECB Rate Decision (global cross-asset driver)
Fri 9/12
⏰ 10:00 AM — UMich Consumer Sentiment (Prelim, Sep)
⚠️ Disclaimer: Educational/informational only — not financial advice.
📌 #trading #stockmarket #SPY #SPX #CPI #PPI #Fed #ECB #jobs #consumer #bonds #Dollar
QQQ Market Preview for Monday, September 8Price Action & Market Structure
* QQQ is trading around 577.7, stabilizing after a sharp morning dip toward 569.0 and a bounce back.
* Price is now consolidating between 576–578, showing indecision after recovering.
* Structure remains bullish above 576 HVL support, but bears will try to push it back toward 572–569 if that zone breaks.
Key Levels
* Resistance (Upside Caps):
* 578–580 → Immediate resistance / Gamma Wall.
* 582–583 → Next resistance cluster.
* Support (Downside Floors):
* 576 HVL → Key pivot support.
* 575–572 → Minor Put support zone.
* 569.0 → Strong support (recent low).
* 567 → Deeper Put Wall support.
Options Sentiment (GEX & IV)
* GEX: Bearishly skewed with Puts at 86.6%, suggesting hedging flows lean downside.
* IVR: 14.3, moderate but not extreme, showing some expected volatility.
* Gamma Walls:
* 580 = Major Call Resistance.
* 576 HVL = Key balance level.
* 572 / 569 = Put-heavy support.
Indicators
* MACD (15m): Rolling over after bounce, showing fading short-term momentum.
* Stoch RSI: Near oversold after pullback → could allow another push higher if 576 holds.
Scenarios for Today
Bullish Case (if 576 holds):
* Hold above 576 HVL, reclaim 578–580.
* Targets: 582–583 Gamma Wall zone.
Bearish Case (if 576 breaks):
* Drop back to 575–572 zone.
* If weakness persists → test 569.0, deeper downside toward 567.
Trading Thoughts
* Longs: Favor dip entries at 576–575 with bounce confirmation, targeting 580–582.
* Shorts: Fade rejection at 578–580, stops above 582.5.
* Stops:
* Longs → below 572.0.
* Shorts → above 582.5.
Summary
QQQ sits at a key balance zone (576 HVL). If support holds, bulls can push back to 580–582, but heavy Put exposure plus resistance at 580 may cap upside. A break below 576 flips bias bearish, targeting 572–569. Options sentiment is defensive, suggesting upside will be a grind unless bulls take control early.
⚠️ This analysis is for educational purposes only, not financial advice. Always manage risk carefully.
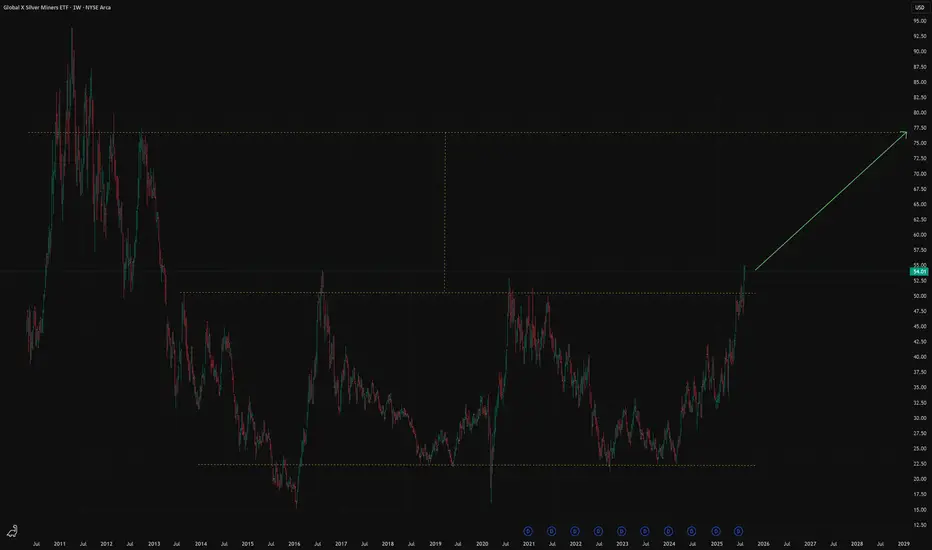
SIL ETF US- Silver Miners Mid Term ideaFollow us and don't miss a next idea on global markets
According to Mining Visuals Silver deficit is expected of 118 million ounces. At the same time strong industrial demand - driven by solar, electronics and green technologies.
Historically, mining stocks outperform the growth rates of the metals themselves. This hypothesis is confirmed by the fact that, starting in 2024, ETF SIL (silver miners) has outperform the metal itself.
From a technical point of view, ETF SIL has emerged from a long-term consolidation and there is a high probability of growth to the $80.
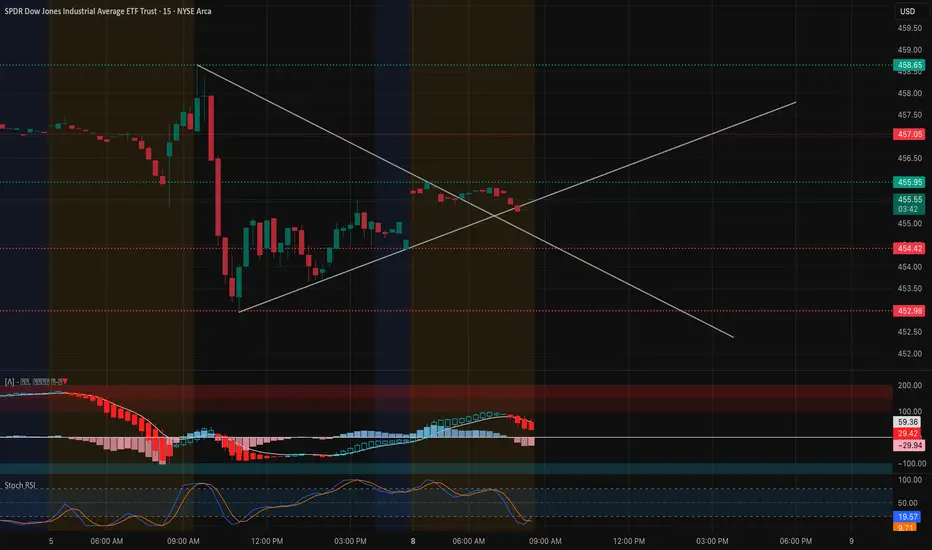
DIA Market Preview for Monday, September 8Price Action & Market Structure
* DIA is trading near 455.6, modestly down from Friday’s levels after rejecting 458.5.
* Price is consolidating between 452.5–458.5, forming a triangle structure.
* Intraday momentum is softening, but bulls are still holding the 455 HVL support zone.
Key Levels
* Resistance (Upside Caps):
* 456.9–458.5 → Immediate resistance zone.
* 461–463 → Gamma resistance cluster.
* 466 → Strong Call Wall (upside cap).
* Support (Downside Floors):
* 455.0 → HVL + intraday anchor support.
* 452.5 → Minor support.
* 450.0–448.0 → Strong Put Support.
* 443.0 → Secondary Put Wall support.
Options Sentiment (GEX & IV)
* GEX: Skewed toward Puts (80.9%), suggesting downside hedging flows.
* IVR: Low at 6.3, meaning options market isn’t pricing large volatility.
* Gamma Walls:
* 466 = Heavy Call resistance.
* 450 = Strong Put support.
Indicators
* MACD (15m): Bearish crossover, momentum fading after early push.
* Stoch RSI: Near oversold, possible relief bounce if 455 holds.
Scenarios for Today
Bullish Case (if 455 holds):
* Hold above 455 HVL, push through 457–458.5.
* Targets: 461 → 463, possible extension to 466 Gamma Wall.
Bearish Case (if 455 breaks):
* Lose 455, quick drop to 452.5.
* Further weakness → 450–448 Put Wall zone.
Trading Thoughts
* Longs: Favor bounce entries near 455–452.5, targeting 458–461.
* Shorts: Fade rejection at 458–461, stops above 463.
* Stops:
* Longs → below 452.0.
* Shorts → above 463.0.
Summary
DIA is at a decision zone around 455 HVL. Holding this support favors upside toward 458.5–461, but failure opens downside to 452.5 → 450. Options sentiment leans defensive (Put heavy), suggesting capped upside unless buyers reclaim momentum.
⚠️ This analysis is for educational purposes only, not financial advice. Always manage risk carefully.
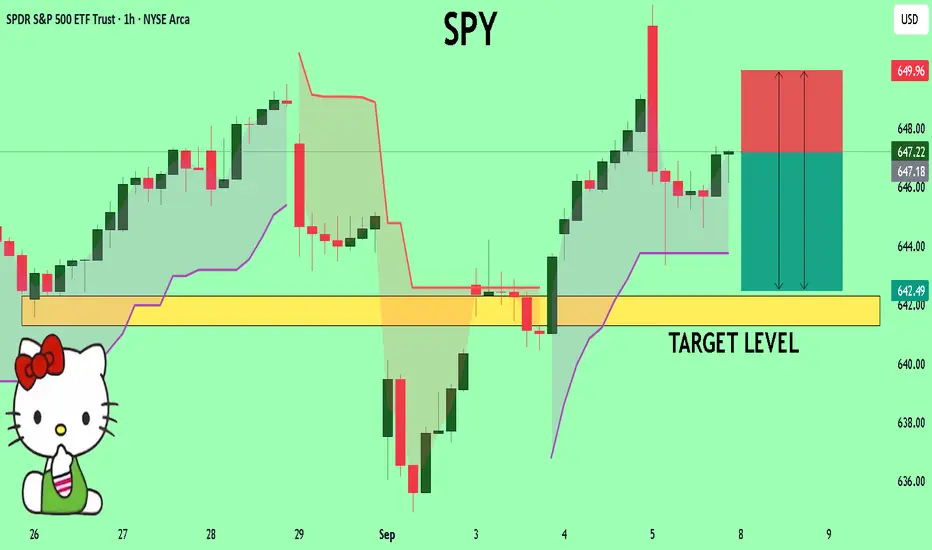
SPY A Fall Expected! SELL!
My dear friends,
Please, find my technical outlook for SPY below:
The instrument tests an important psychological level 647.22
Bias - Bearish
Technical Indicators: Supper Trend gives a precise Bearish signal, while Pivot Point HL predicts price changes and potential reversals in the market.
Target - 642.31
Recommended Stop Loss - 649.96
About Used Indicators:
Super-trend indicator is more useful in trending markets where there are clear uptrends and downtrends in price.
Disclosure: I am part of Trade Nation's Influencer program and receive a monthly fee for using their TradingView charts in my analysis.
———————————
WISH YOU ALL LUCK
QQQ Today’s Rally ≠ Bullish BreakoutToday’s rally into resistance doesn’t cancel the bearish structure - it just tested the ceiling again, like the ball bouncing off the ceiling one more time
Price bounced, yes, but it stopped right at the descending trendline and supply zone
Until QQQ clears $577–$580 on volume, this is just another lower high
RSI still under 60 on the daily
MACD still bearish crossover
Bearish setups need bounces since sellers actually want rallies into supply
Today’s move just brought price back to the spot where bears previously took control
The deciding factor is whether tomorrow’s NFP release causes a breakout above $580 (bullish) or a breakdown below $562 (bearish)
Descending triangles usually resolve downward (break of the flat base)
A clean daily close <$562 would trigger measured move targets
Until $562 breaks on volume, it’s still just compression
Sometimes triangles fake down, trap shorts & rip higher (especially with macro catalysts like NFP)
If $576 rejects, short to $562–$558
If $577–$580 breaks (bulls win), step aside or flip long toward $583+
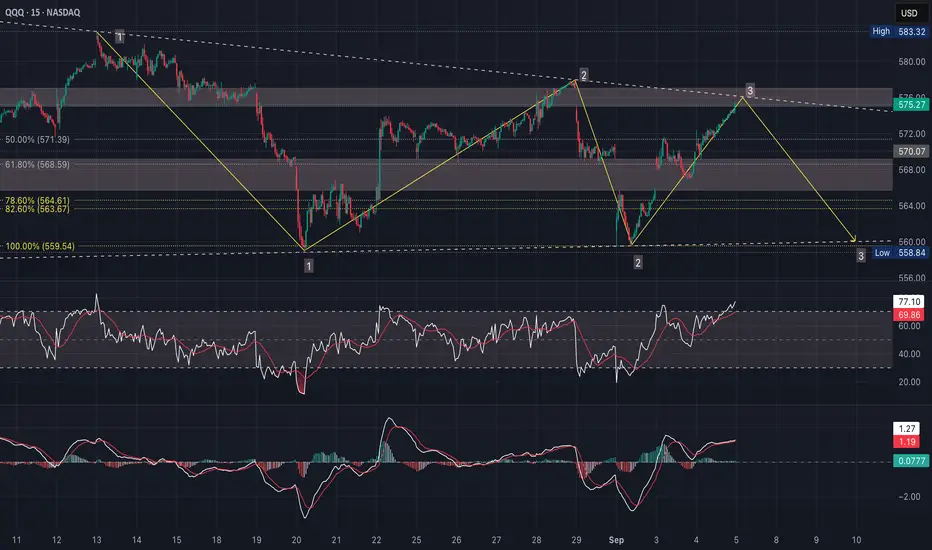
The Fib retracements line up neatly,
50% = $571.39
61.8% = $568.59 (sits right inside that shaded demand area)
78.6% = $564.61 & 82.6% = $563.67 (exactly where buyers defended)
100% = $559.54
This layering creates a ladder of potential supports, but also a measured path for shorts
The 1, 2 & 3 path into $559–$560 matches the 100% extension of the prior move
This is where measured move & Fibonacci confluence meet
Bears could take profit on the way down at $568.5 to $564.5 & $560
If $559 breaks with volume, extension opens toward $547 (200d SMA) which would be the larger “unwinding” target
Invalidation is simple, if daily close >$577–$580 trendline
While in-play, each Fib level gives you a chance to trail stops down
Trendline + Supply Zone + Symmetry + Fibonacci = high-probability short setup
Price = supply zone/descending trendline
RSI = overbought on the 15m & below the midline slope & capped under 60 on the daily
That’s a sign of weak momentum - each bounce fizzles out earlier
The RSI trendline itself is descending, which mirrors price
MACD = potentially topping on the 15m & still bearish crossover on the daily with it's histogram contracting slightly, so momentum is still in bear mode, with only a weak attempt at recovery
Momentum: RSI + MACD both confirm sellers are in control of the bigger picture
If NFP or another catalyst sends QQQ through $577–$580, watch for RSI breaking above 60 (momentum shift) & MACD histogram flipping positive with a bullish cross
That would negate the bearish triangle & turn this into a breakout squeeze toward $583+
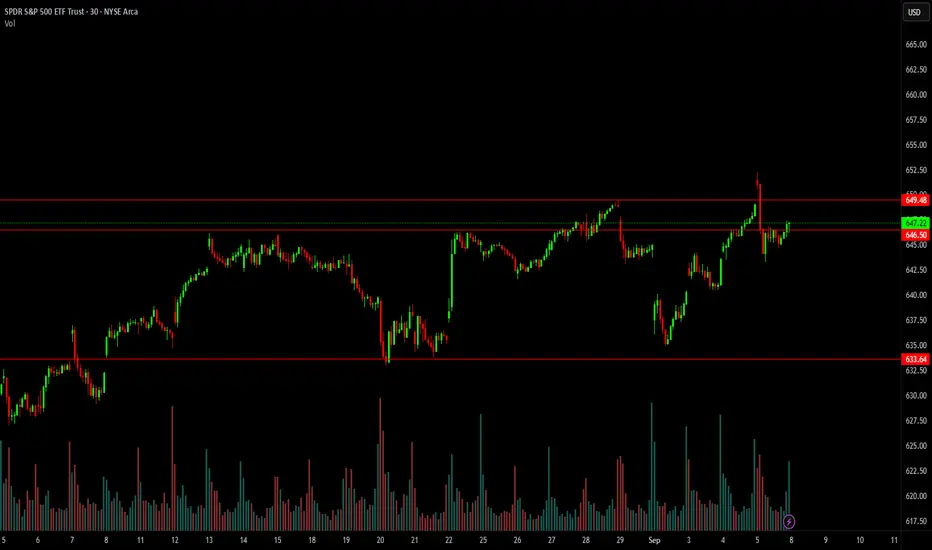
$SPY Watchlist Ticker: SPY (SPDR S&P 500 ETF Trust)
All-Time High Reference: SPY hit a record close at $649.12 on Sept 4, 2025, with an intraday peak around $652.21. That’s the level we’re watching.
Catalysts on Deck
Retail Sales (Mon, 6/17): Strong numbers = more fuel for the bulls. Weak print = pressure on consumer strength, could weigh on SPY.
Unemployment Claims (Tue, 6/18): Clean data here can push risk-on. A spike in claims could bring some hesitation into the market.
Why We Don’t Trade CHOP
If you zoom out to the 30m–1h, price has just been moving sideways. No clean trend, no conviction. Trading that kind of action is low probability:
Breakouts fail more often than not.
Noise > signal.
Risk/reward doesn’t make sense without direction.
Bottom line: we wait for momentum. If there’s no momentum, we don’t force it.
Game Plan
Bullish setup: Gap filled and bounced at 635.01. As long as we hold trend, look for calls back toward ATH. A clean break above ~652 with volume = room to run 655–660+.
Bearish setup: Only if we see a hard rejection near highs. Watch 635 as first support, then 620 if things pull back.
Bias remains bullish. We’re in an uptrend, we’re near highs, and catalysts this week will decide if we get continuation or stall out. Stay patient, let the levels play out.
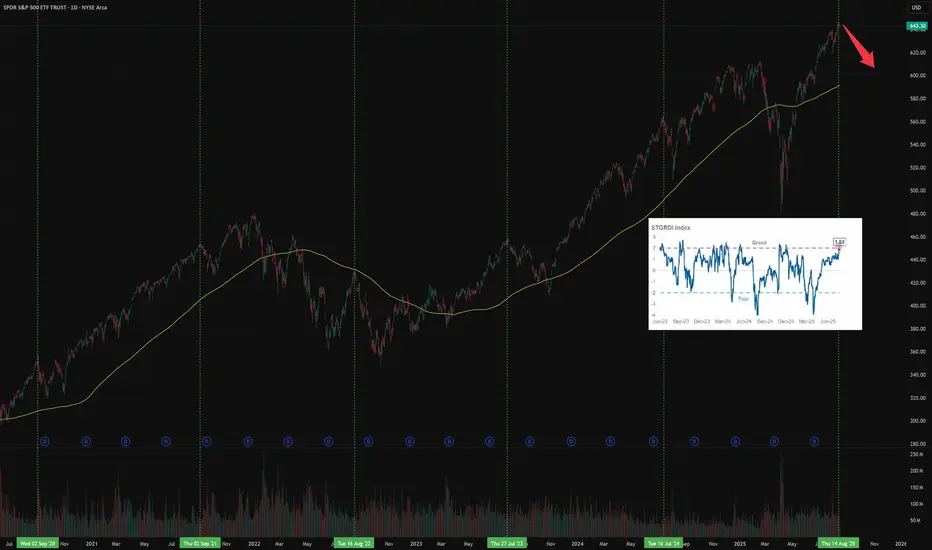
Stock Market is in Risk OnSubscribe and don't miss next ideas
The US market, as well as some assets, is in a risk-on mode.
Most assets have their own seasonality.
The chart above shows one of them:
In recent years, in the period July-September, a correction began on the US market.
A number of macro indicators also speak in favor of a correction and that it is overdue.
Risk appetite according to Morgan Stanley research has reached a historical maximum
Although seasonality does not guarantee a correction right here and now, but at least it gives reason to think about reducing long positions
Role of Central Banks in Global Markets1. Historical Evolution of Central Banks
1.1 Early Origins
The first central banks emerged in the 17th century, such as the Swedish Riksbank (1668) and the Bank of England (1694), to stabilize currencies and finance governments.
Initially, their role was limited to issuing banknotes and managing public debt.
1.2 Gold Standard Era
During the 19th and early 20th centuries, central banks were tasked with maintaining currency values under the gold standard.
Stability of international trade depended on these institutions’ ability to maintain fixed exchange rates.
1.3 Post-War Bretton Woods System
After World War II, the Bretton Woods agreement (1944) tied major currencies to the U.S. dollar, with the dollar convertible to gold.
Central banks became guardians of exchange rate stability.
1.4 Modern Role (Post-1971)
With the collapse of Bretton Woods in 1971, currencies floated freely.
Central banks shifted focus to inflation targeting, financial stability, and macroeconomic management.
Today, their influence extends beyond national borders into global capital flows and markets.
2. Core Functions of Central Banks in Global Markets
2.1 Monetary Policy
Central banks set interest rates and regulate money supply to achieve price stability and economic growth. Their policies influence:
Global capital flows: Higher U.S. interest rates often attract funds from emerging markets.
Exchange rates: Monetary tightening usually strengthens domestic currency.
Investment decisions: Global investors closely follow central bank policies to allocate capital.
2.2 Lender of Last Resort
During crises, central banks provide emergency liquidity to banks and financial institutions.
Example: During the 2008 Global Financial Crisis, the U.S. Fed and ECB provided trillions in liquidity through swap lines, stabilizing global markets.
2.3 Financial Stability Oversight
Central banks regulate banks and oversee payment systems to prevent systemic risks.
They monitor asset bubbles, excessive lending, and foreign capital volatility.
2.4 Exchange Rate Management
Emerging market central banks (e.g., RBI, PBoC) often intervene in forex markets to prevent excessive volatility.
Exchange rate policy impacts global trade competitiveness.
2.5 Reserve Management
Central banks hold foreign exchange reserves, including U.S. dollars, euros, gold, and bonds, to support their currencies.
Their demand for U.S. Treasuries or euro-denominated assets influences global bond yields.
3. Tools of Central Banks
3.1 Interest Rate Policy
Policy rates (Fed Funds Rate, ECB refinancing rate, RBI repo rate) influence borrowing costs worldwide.
Rate hikes in advanced economies often trigger capital outflows from emerging markets.
3.2 Open Market Operations (OMO)
Buying or selling government securities to manage liquidity.
Large-scale OMO, known as Quantitative Easing (QE), became prominent post-2008.
3.3 Reserve Requirements
Mandating banks to hold a percentage of deposits as reserves.
Impacts credit availability in domestic and global markets.
3.4 Forward Guidance
Central banks provide communication on future policy intentions to influence market expectations.
Example: The Fed’s signals about interest rates guide global equity and bond markets.
3.5 Currency Interventions
Buying or selling foreign currency to stabilize exchange rates.
Example: The Swiss National Bank intervenes to prevent excessive franc appreciation.
4. Influence of Major Central Banks on Global Markets
4.1 U.S. Federal Reserve (Fed)
The most influential central bank due to the U.S. dollar’s role as the global reserve currency.
Fed decisions on rates and QE directly affect:
Global bond yields
Commodity prices (oil, gold)
Emerging market capital flows
4.2 European Central Bank (ECB)
Oversees the euro, the second most traded currency.
ECB policies influence European bond markets, trade flows, and global investor sentiment.
4.3 Bank of Japan (BoJ)
Known for ultra-low interest rates and Yield Curve Control (YCC).
Impacts global carry trades, where investors borrow in yen and invest in higher-yielding markets.
4.4 People’s Bank of China (PBoC)
Manages the yuan and China’s monetary policy.
Its decisions affect global supply chains, commodity demand, and emerging markets.
4.5 Reserve Bank of India (RBI)
Plays a vital role in stabilizing one of the largest emerging economies.
RBI interventions impact Asian capital markets and forex stability.
5. Central Banks During Crises
5.1 Global Financial Crisis (2008)
The Fed cut rates to near zero and launched QE.
ECB and BoJ followed with liquidity measures.
Central banks coordinated globally, stabilizing markets.
5.2 Eurozone Debt Crisis (2010-12)
ECB’s “Whatever it takes” pledge by Mario Draghi restored investor confidence.
Prevented collapse of European bond markets.
5.3 COVID-19 Pandemic (2020)
Central banks injected unprecedented liquidity.
Rates were cut to historic lows.
Asset purchase programs kept markets afloat despite global lockdowns.
6. Challenges Faced by Central Banks
6.1 Balancing Inflation and Growth
Rising inflation post-pandemic forced central banks to hike rates aggressively.
Risk of recession vs. inflation control is a constant trade-off.
6.2 Global Spillovers
A Fed rate hike strengthens the dollar, hurting emerging markets through capital flight and debt pressures.
6.3 Political Pressures
Governments often pressure central banks to support growth, risking their independence.
6.4 Digital Currencies & Technology
Rise of cryptocurrencies and Central Bank Digital Currencies (CBDCs) is changing the financial landscape.
Central banks must balance innovation with regulation.
6.5 Geopolitical Tensions
Sanctions and de-dollarization efforts challenge the U.S. Fed’s dominance.
Energy shocks and wars complicate policy decisions.
7. Future of Central Banks in Global Markets
7.1 Greater Coordination
Global challenges like climate change, pandemics, and financial contagion may require more coordinated action among central banks.
7.2 Digital Transformation
Adoption of CBDCs could redefine cross-border payments, reducing reliance on the dollar.
7.3 Green Finance Role
Central banks may support climate-friendly investments by adjusting reserve requirements or collateral frameworks.
7.4 Rebalancing Power
Emerging market central banks like PBoC and RBI will gain more influence as their economies grow.
Conclusion
Central banks are no longer confined to their domestic economies—they are global market architects. Their monetary policies, interventions, and crisis-management tools shape the movement of capital, trade, and currencies worldwide.
From the Fed’s dominance in global finance to the ECB’s stabilizing role in Europe, and from the BoJ’s ultra-loose policies to the PBoC’s yuan management, these institutions collectively form the backbone of global financial stability.
However, their journey is fraught with challenges—rising inflation, geopolitical risks, digital disruption, and climate imperatives. The future role of central banks will demand not just economic stewardship but also global cooperation, adaptability, and resilience.
In essence, central banks remain the invisible hand guiding global markets, making them indispensable players in the world economy.
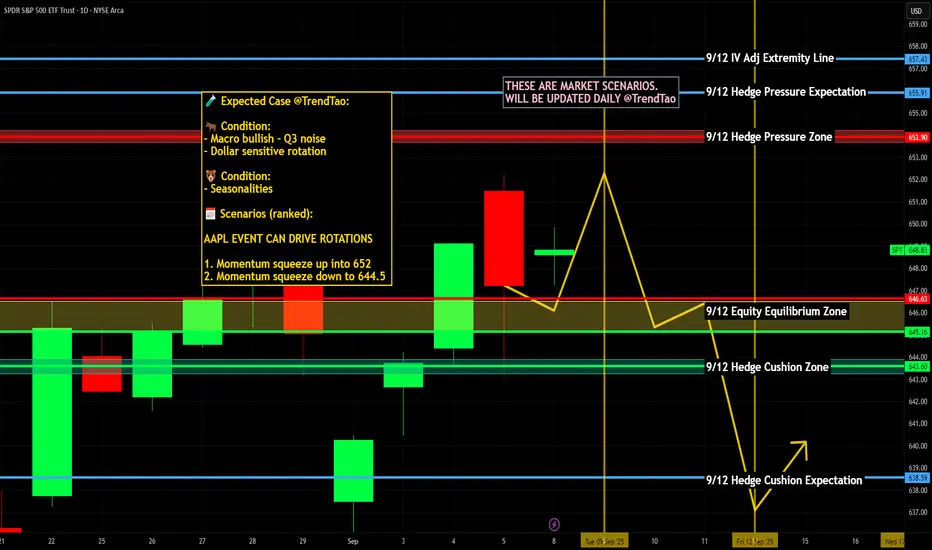
$SPY / $SPX Scenarios — Tuesday, Sept 9, 2025🔮 AMEX:SPY / SP:SPX Scenarios — Tuesday, Sept 9, 2025 🔮
🌍 Market-Moving Headlines
🚩 Small Biz Pulse: NFIB report before the open — insight into hiring & inflation expectations.
🍏 Apple Mega-Cap Event: 1 PM ET — expected iPhone 17 lineup, Apple Watch, AirPods updates. Mega-cap headline risk for NASDAQ:AAPL and $XLK.
📉 Tape Watch: Traders positioning ahead of 🚩 PPI (Wed) and 🚩 CPI (Thu).
📊 Key Data & Events (ET)
⏰ 🚩 6:00 AM — NFIB Small Business Optimism (Aug)
⏰ 10:00 AM — Wholesale Inventories (Jul, rev.)
⏰ 🍏 1:00 PM — Apple Product Launch Event
⚠️ Disclaimer: Educational/informational only — not financial advice.
📌 #trading #stockmarket #SPY #SPX #AAPL #AppleEvent #NFIB #inflation #tech #MegaCap
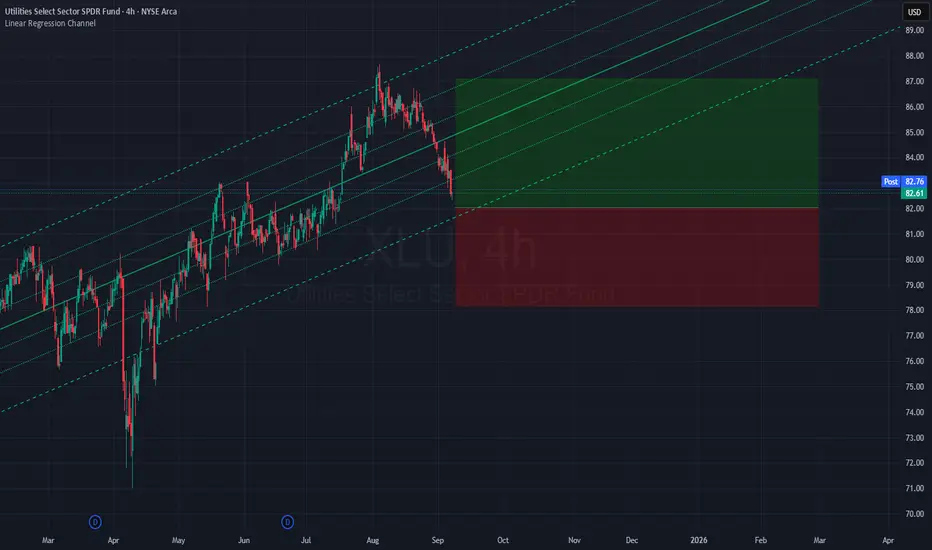
XLU Long trading opportunity(swing-trading) 1I expect a swing of about $4-$6 all the way up to $85+- within 2-5 months.
I am risking money in the form of a short put option to expire the 19'th of September (will be followed by a covered call opened if assigned).
My entry price is $82
This is a buy and hold trade in a lower risk lower volatility instrument, you might have to hold for 6+- months before it reaches the target, XLU rises slowly but rarely goes down 20%+ for no big reason (there has to be underlying market crash or severe macro negative events) so I don't see a lot of downside remaining, I do think it can go lower than $80 but that would then be 10% down from its peak, but at max I would place it around 15% down from its peak before it starts going up.
Also historically lower interest rates do benefit the utilities sector.
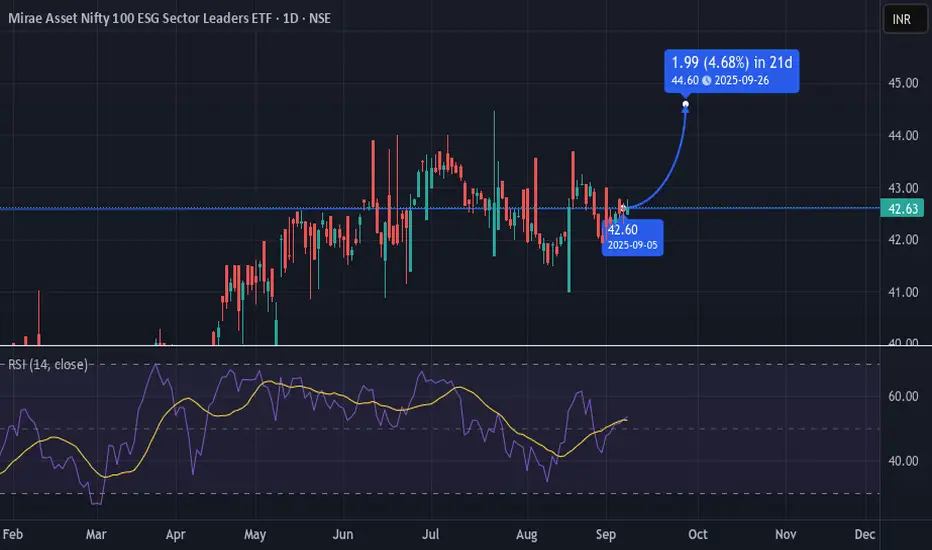
ETF ESG BullishETF ESG (Environment, social and Governance) sector is seen a rising trend based on government policies being implemented considering sustainability.
Also seeing confirmation by RSI indicator,
Can consider for short term and long term based on fundamentals
Long 🟢 position
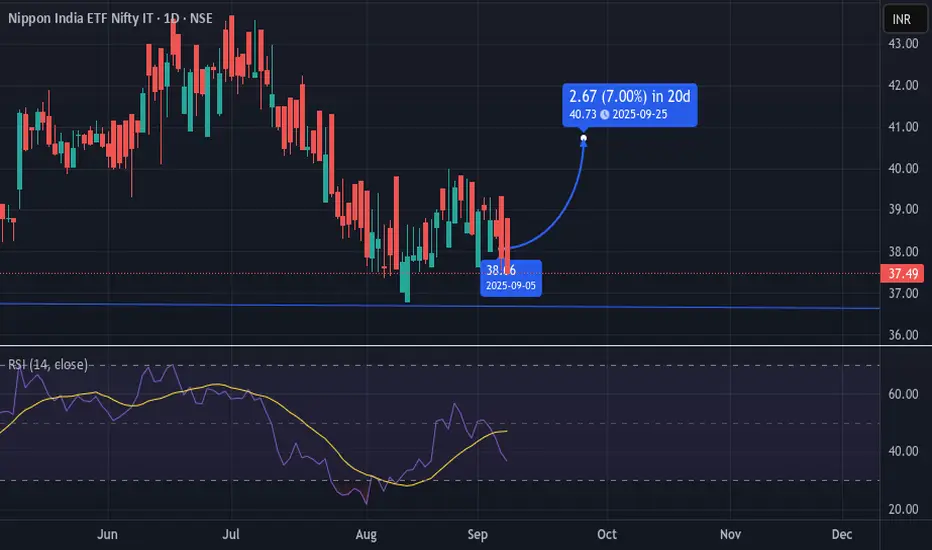
ETF ITBEES Bullish ETF ITBEES is seeing a positive RSI indicator moving in upwards trend, expect to rise in coming weeks.
Support levels tested
Long 🟢 trade expected
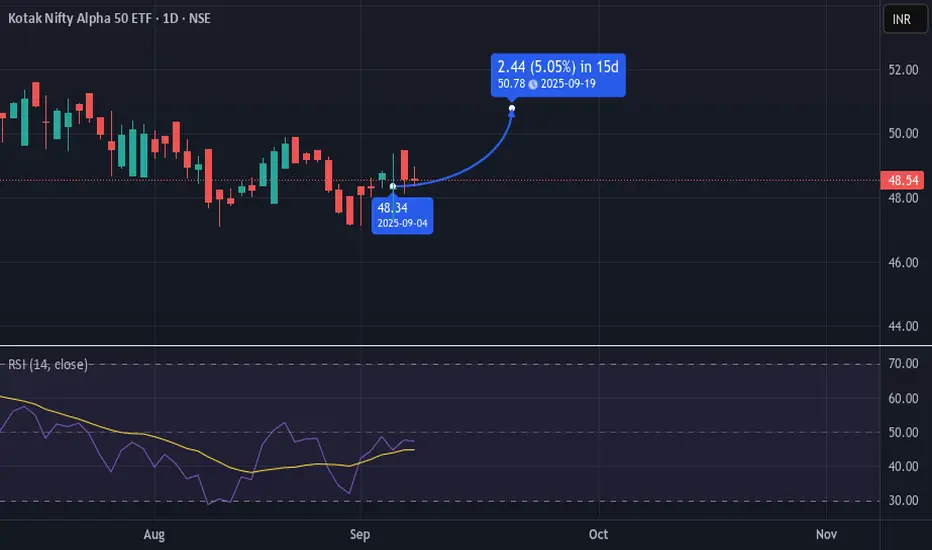
ETF ALPHA BullishExpect a short term long position based on RSI levels going strong.
Also tested support level two times.
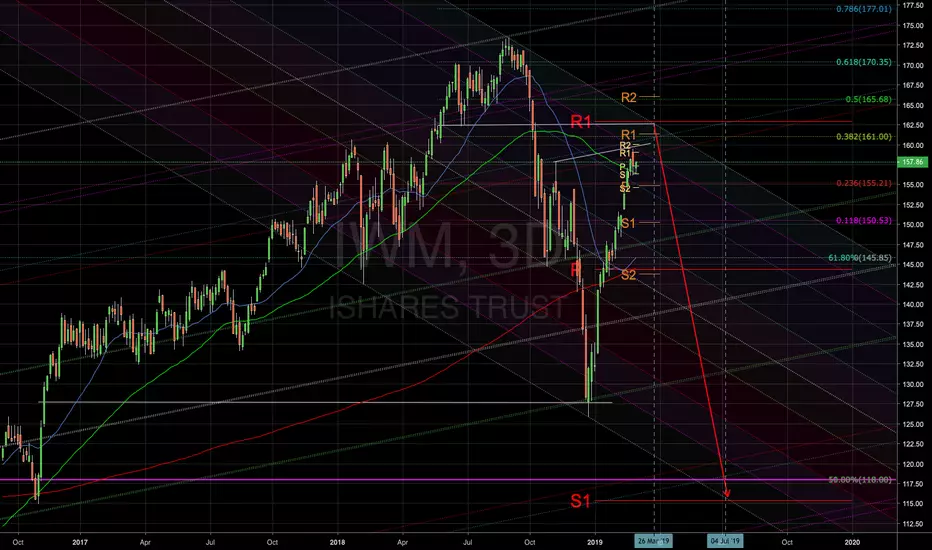
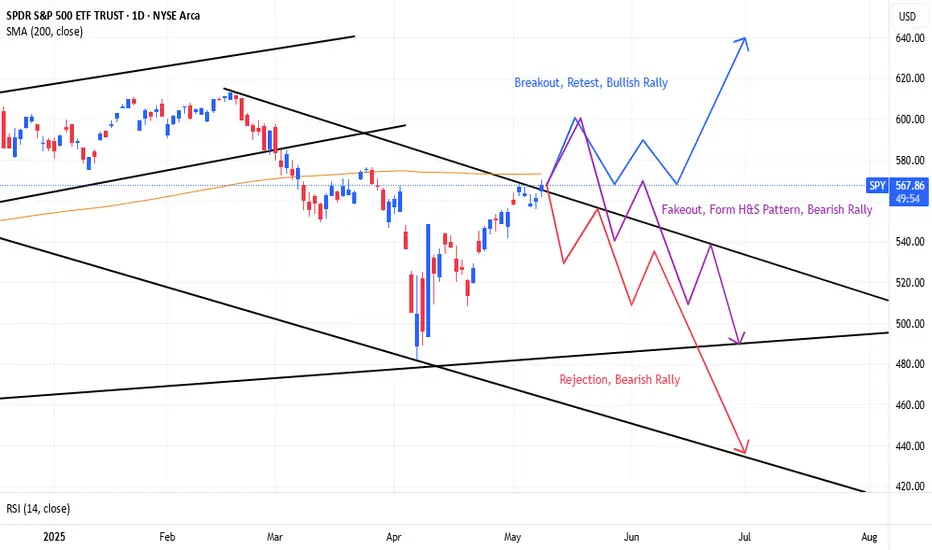
The Daily 200 MA Is The KeyRegarding how price action will play out over these next couple months, there's 3 likely scenarios, and it involves how price will interaction with the daily 200 MA:
BLUE: Price makes a convincing break above the daily 200 MA, retests it, and then surges onward, continuing the long-term bullish trend.
PURPLE: Price falsely breaks above the daily 200 MA and tests the 600 psychological level, rejects it, and falls back below the daily 200 MA and retests it, thus creating a H&S pattern and confirming the continuation of the bearish trend.
RED: Price rejects the daily 200 MA, and continues the bearish trend, ultimately forming a new low.
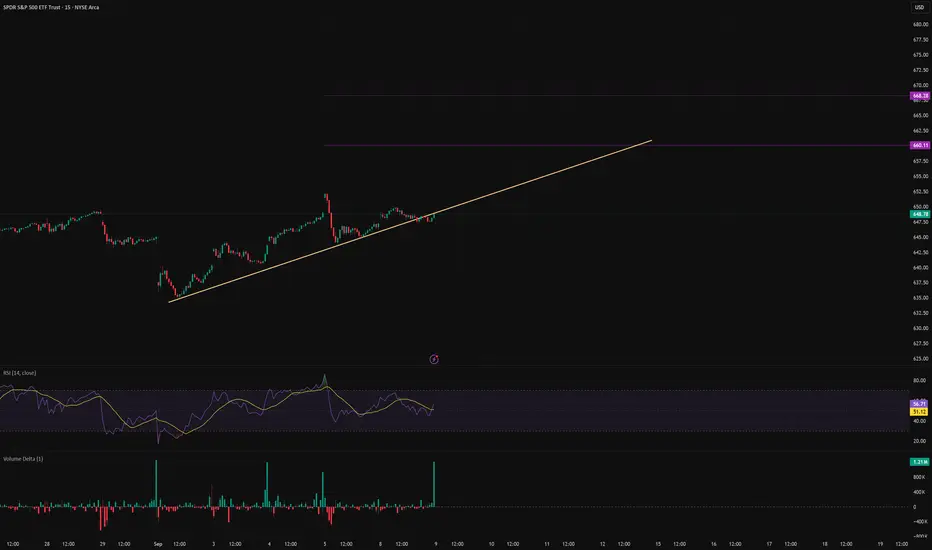
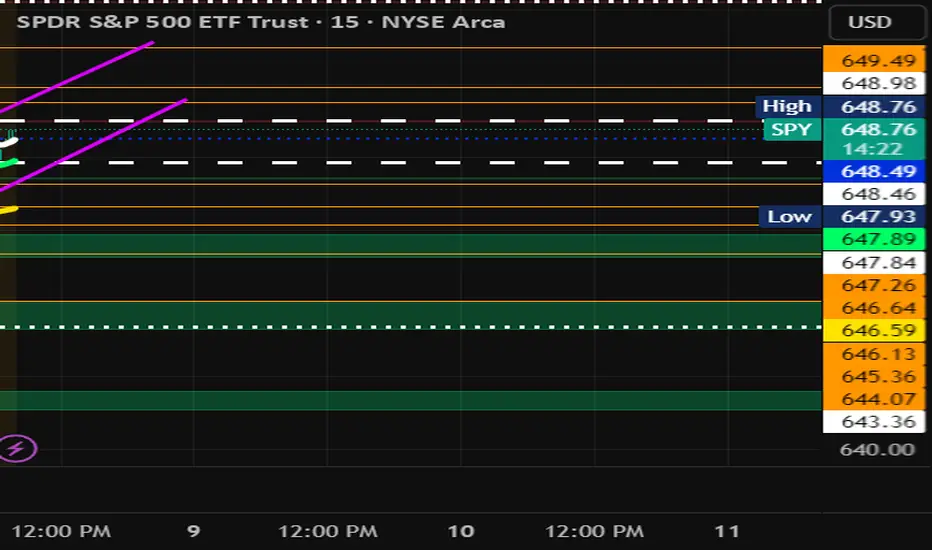
SPY Play 9/8/25Look for break of PMH and hold for CALLS and Break of PML for PUTS. It is also in a channel which provides more confirmation if it breaks either side. It appear to be forming a Bear Flag on the 15 min. So be cautious and wait first 15-30 mins. If PUTS look for SPY to come down to 646.17 if it breaks and hold that with volume SPY maybe headed to 643 territory. But in all things do your due diligence and be patient. Let the trade prove to you which direction. the range as of now is 647.84-648.98 - no trade between this range. If it decides to do calls look for 649.49-9 as first TP and if it go pass that look to recapture PDH. Let's Go. #YouGotOptions
“Discipline in trading is doing what your plan says even when your emotions scream otherwise. Consistency beats impulse every time.”
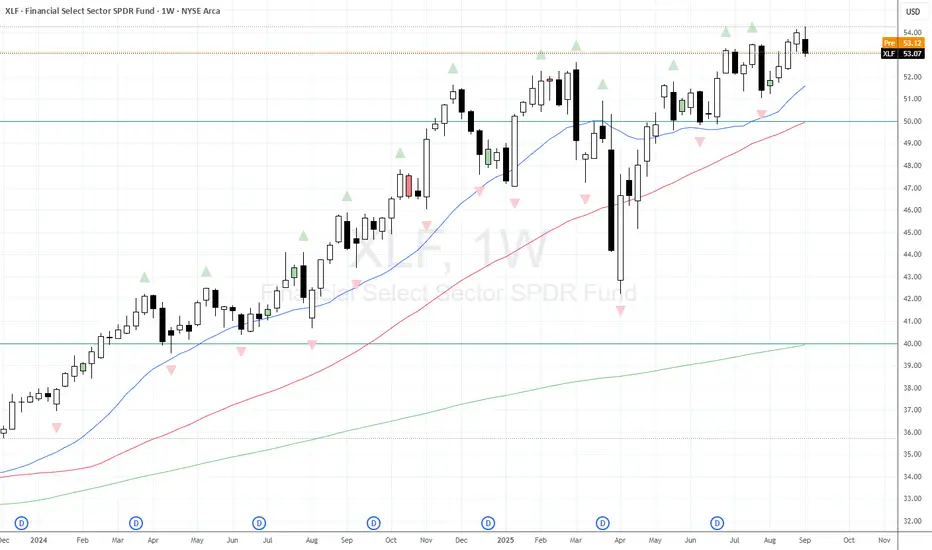
Weekly Bearish Key Reversal on XLFXLF has provided a great trend (and moral support) to the bullish trend we've seen recently. However a Weekly Bearish Key Reversal on XLF might be a moment for a pause before data later this week and FOMC the week after. Take a look at some of the US Banks weekly charts as well.