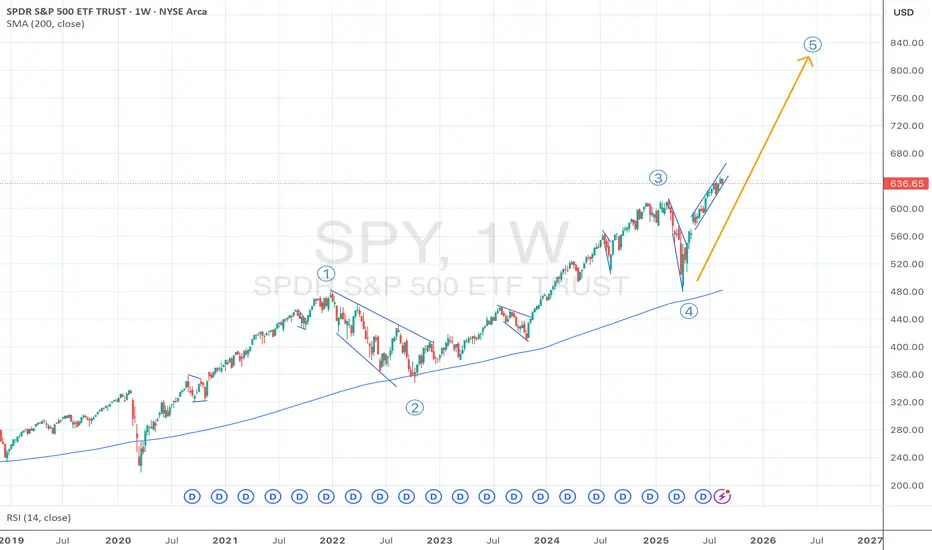
SPX Long Term TrendSPX seems to be in a 5 wave upward trend. We see alternation in waves 2 (subdividing) and 4 (sharp move down). We also see that 1 = 3 and 5 so far is 5 = 0.618*1 hence the pullback. Both 2 and 4 have retraced 1 and 3 exactly 50%. The target for wave 5 should either be 0.618*1 or 1.618*1 giving us a pretty bullish move ahead. Will publish short term view in a separate post.
ETF market
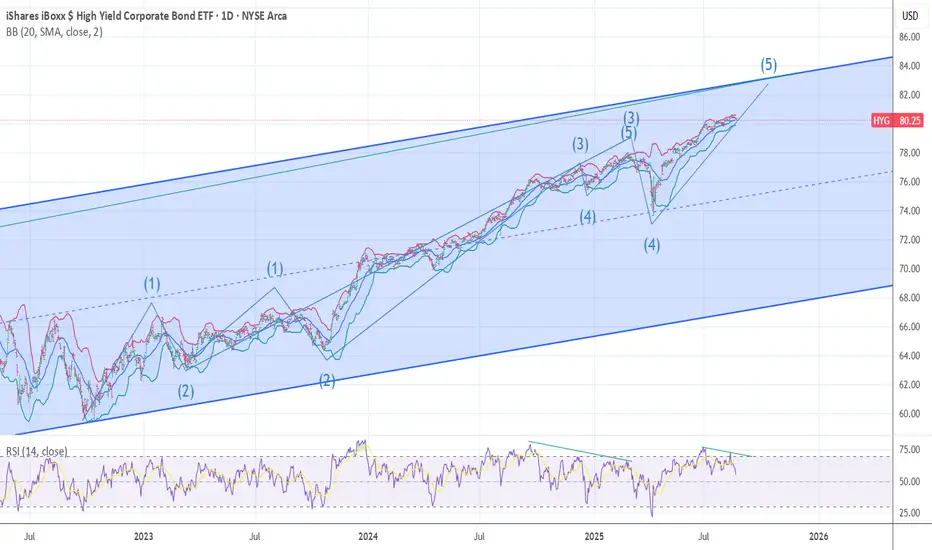
HYG =Liquidity Nearing the End of 5 Waves up from 2022 low The post posted is that of the high yield market ETF aka JUNK BONDS .As the chart posted we can see we are nearing the end of an Elliot Wave 5 waves up from oct 2022 . So if the markets are going to continue to rally aka SPY QQQ VT we will need for the Treasury to start to issue T.Bills rather soon . Best of trades WAVETIMER
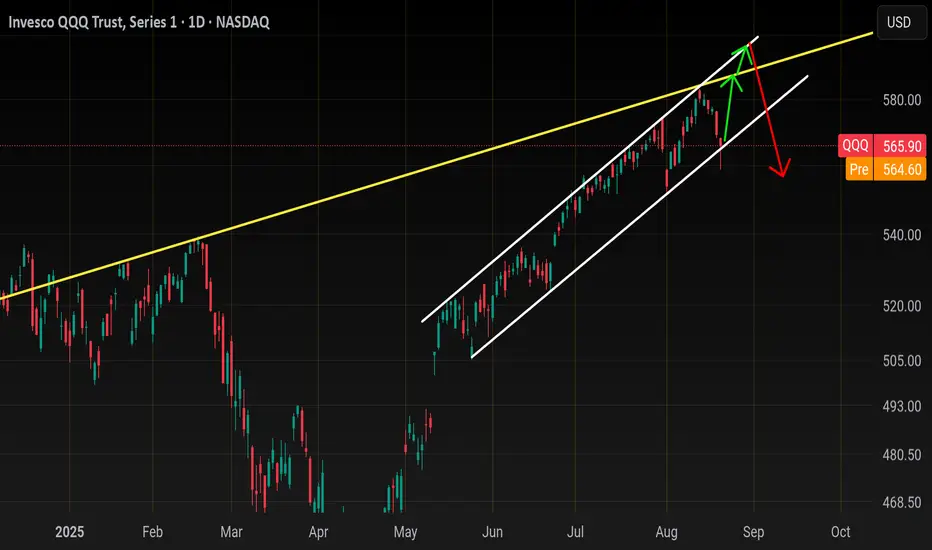
Qqq... Done or one more ?So in my previous post I mentioned
Qqq tagged its 16 year trendline resistance
Zoomed in and circled last 3 touches
From 583 to 559 in one week.
Now Zoomed to see the last 2month price action and you'll see we hammered off our summer channel support
So with Powell speaking tomorrow i think we will be at a cross roads where either we will make 1 more high before sept or the move is done already.
Let me explain
In my last post (See link)
I explained the tech Sectors and that they where signaling a top and here we are a week later.
The 2 biggest tech Sectors
NASDAQ:SMH (Chips)
AMEX:XLK ( aapl , msft)
Are both Showing a topping pattern called Wyckoff distribution..
This pattern is pretty much a conformation that Sept will be UGLY and Qqq will close gap at 530 minimum
But I've said all this before in my last post..
This post is about the possibility of a bounce to 589-600 in the last week of August.
It all comes down to Powell tomorrow.. if Qqq closes back over 571 or 20sma tomorrow then I would be leaning towards one more of 589-600..
589 would be a tag of that yellow trendline which is that 16yr resistance.
600 would be extreme fawkery and a push back up to the top of the summer channel.
Qqq has faked out twice before over that monthly trendline . I circled the last 2 fakeouts here
So if Qqq and tech Sectors push back over their 20sma and close the week above it then I'd flip long for the last week of August then come back after labor day weekend with puts in mind.
If Powell causes a sell and we close below 563 then disregard this post..
The next best short entry is below 557.00
Core pce and NVDA earnings are catalyst next week.
Risky longs below 20sma..
Either wait for a break above 570.00
Or long 563-564..
If you long 563 then be willing to add to your position up into 559.00
Stop loss below 558.00
If you long above 570 them be willing to add to your position up into 567
Stop loss below 566
Over 570 and 576.50 comes
Over 581 and we will head to a new high
Trade idea
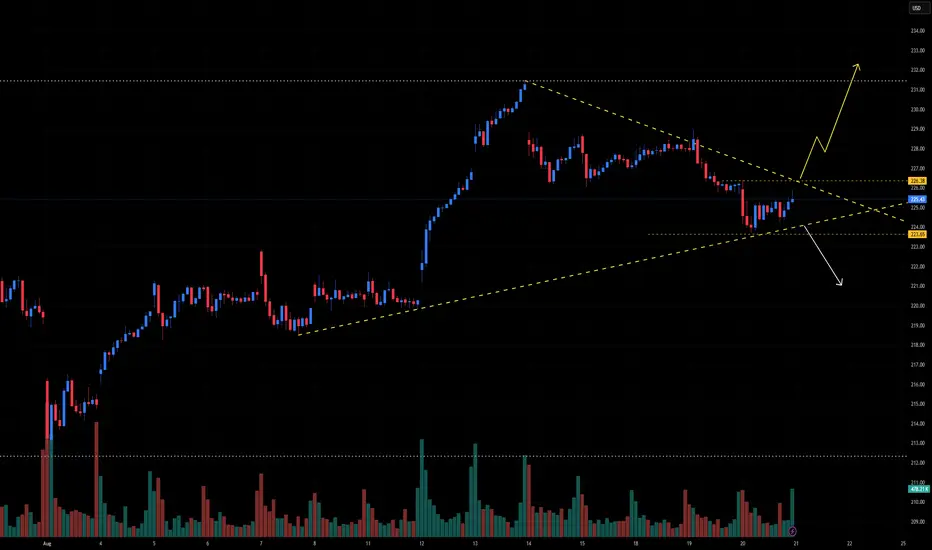
If this goes up then I like NASDAQ:GOOGL calls with a target of 210.00 for the last leg up. See my link
Entry above 197.50 (20sma)
Stop loss below 195.00
1st Target 202.50
2nd target 210.00
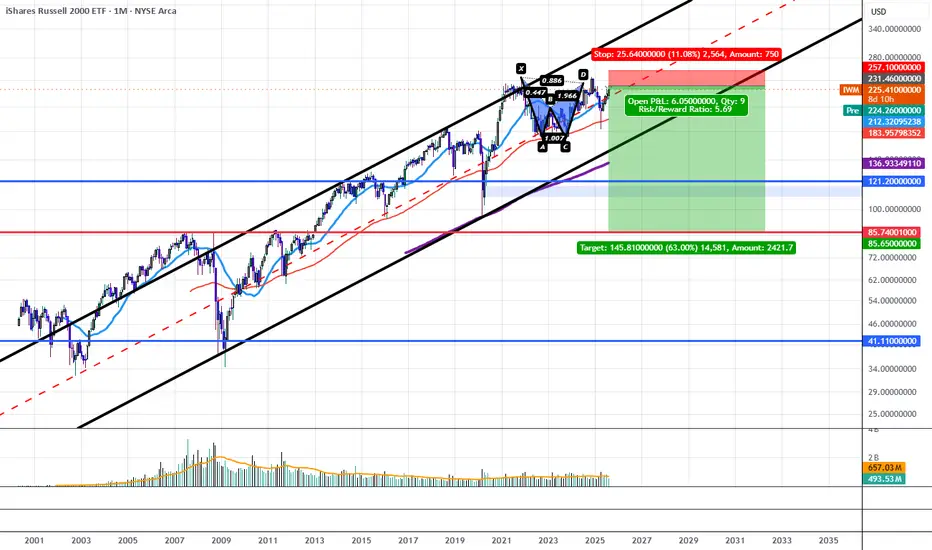
IWM Appears Due for a Minimum 40-60% Downside CorrectionOn the lower timeframes IWM has been treating $223 as short term support with much sold put leverage building at $220 and recently IWM has begun to retrace back down into those levels putting those sold puts at risk of expanding the volatility and of squeezing through these short puts as a result.
The short term the loss of this zone could likely squeeze down to $200.
However in the longer term we have been trading within this much larger parallel channel since the peak and bottom of 2008-2009 GFC and have started to form a potential peak paired with a Bearish Shark. I think that if we were to start to see some serious downside the IWM could trade back down to not just the bottom of the channel but down to one of the 3 major horizontal supports I have plotted on the cart down at $121, $85.74, or even $41.11 if things get real bad.
Personally I will be targeting one of the 2 upper horizontal supports in the longer dated positioning while targeting the $210-$200 levels in the short term.
I'd suspect this decline to come especially as Fed Rate cut expectations are completely priced out of the market, it is worth mentioning that fed funds futures around the start of the month dropped their expectations of rate cuts for the September meeting down to 0 and we may now be on the path to pricing in rate hikes as seen in the chart below.
Alternatively the expectations for rates going into the end of December has been on a fast trajectory of pricing out rate cuts as well, starting at 90BPS of rate cuts at the start of the year, now pricing in only 37.5BPS in rate cuts:
This ongoing shift in these fed futures spreads from positive to negative signifies the amount that Fed Funds Futures are expecting the Fed to hike rates with both the instance of rate hikes and rate cuts likely to cause a collapse in credit spreads as the bond market yield shift higher leaving the interest rate sensitive IWM to be one of the most negatively affected.
IWM Weekly Setup – Long OpportunitySpotted a promising long setup on the iShares Russell 2000 ETF (IWM) weekly chart. The price action is showing bullish momentum supported by volume and trend indicators.
🔹 Entry Zone: Current levels
🔹 Stop Loss: 196$ – below super trend line
🔹 Target: 260$
Technical indicators and moving averages are aligning for a potential breakout. Risk management is key – keep an eye on volume and macro sentiment.
Let me know your thoughts or if you're watching IWM too!
#IWM #Russell2000 #ETF #TechnicalAnalysis #SwingTrade #TradingSetup #Finance
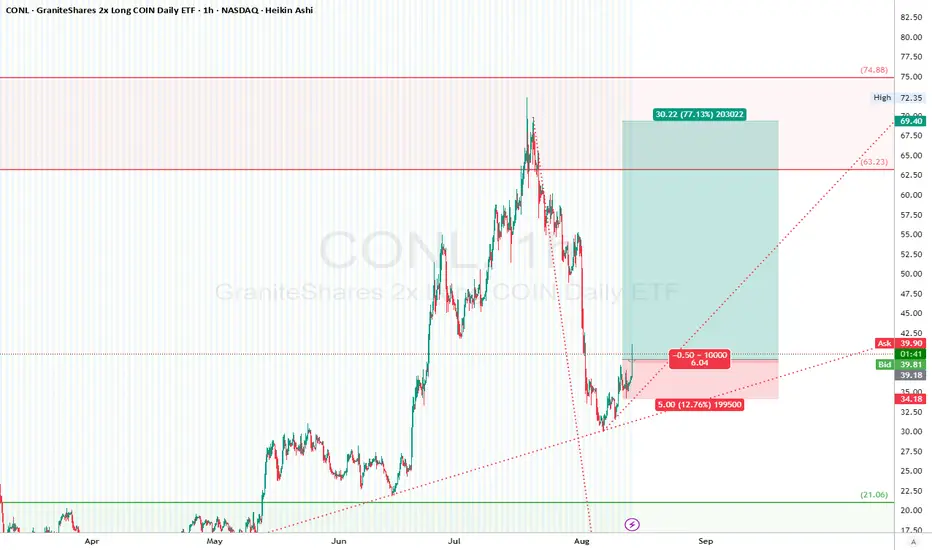
CONL – GraniteShares 2x Long COIN Daily ETF (1H)
**📊 CONL – GraniteShares 2x Long COIN Daily ETF (1H, Heikin Ashi)**
Bullish breakout continuation play
"CONL’s shaping up like a coiled spring after that brutal pullback—trendline held, structure’s tightening, and now we’re looking at a potential liftoff. Given the leveraged nature, volatility will be spicy—perfect for aggressive momentum players. Keep stops tight; when leverage works against you, it cuts deep."
After a massive parabolic rally to \$72.35, CONL got slammed in a steep corrective wave, retracing more than 50% of the prior impulse. The drop halted right on a multi-month ascending trendline and bounced. Buyers are now stepping back in, forming higher lows—a sign of early accumulation and a possible reversal continuation toward previous resistance.
* The July top looks like the end of a strong **Wave 3** in a larger cycle.
* The August drop is likely **Wave 4** corrective (ABC structure visible), now transitioning into **Wave 5** toward the highs.
* Target zones match Fibonacci extension levels aligning with previous swing highs.
### **Trade Setup**
* **Support Zone:** \~\$34.18 (Stop Loss level)
* **Intermediate Resistance:** \~\$63.23 (potential partial TP zone)
* **Major Target:** \~\$69.40 (Sell Limit), stretch to \~\$74.88 if bullish momentum accelerates
* **Entry:** \~\$40.43 (current bid)
* **Stop Loss:** \$34.18 (below recent higher low)
* **Take Profit:** \$69.40 (major supply)
* **Risk/Reward:** \~6:1
* **Trade Management:**
* Move SL to break-even at \~\$50
* Consider scaling partial profits at \$63.23 before final push to \$69.4–\$74.88
*"In trading, you can’t control the market, but you can control your risk."* — Paul Tudor Jones
**⚠ Disclaimer:**
This setup is for educational purposes only. Leveraged ETFs carry amplified risk—position sizing and risk control are critical.
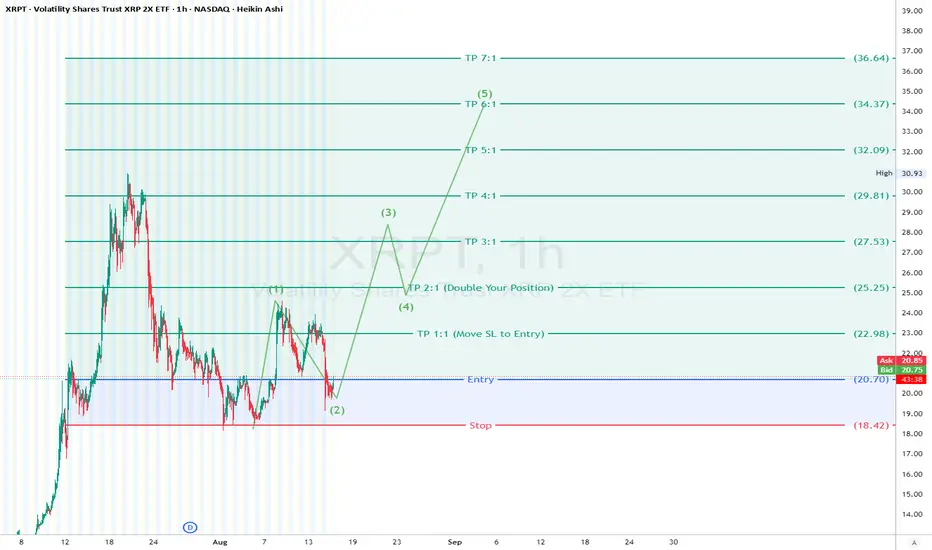
XRPT (XRP 2X ETF) 1H Buy setupXRPT had a good correction after impulsive move.
We are starting a new Elliot wave , wave 1 &2 are done, the impulsive wave 3 in play.
Trade setup is on the chart.
Trade safe!
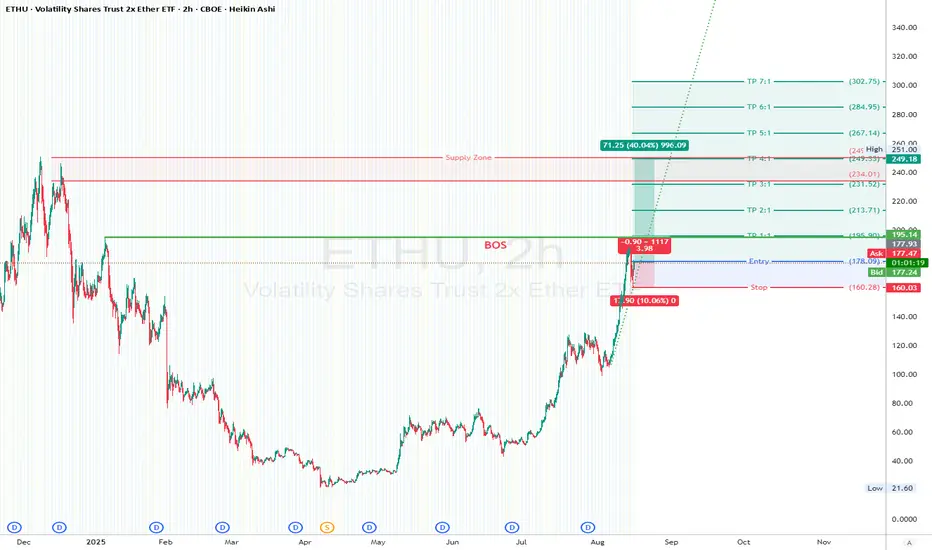
ETHU (2X Ethereum ETF)Targeting the end of the wave after a short correction.
Trade setup on the chart
Entry: 177.93
SL: 160.03
TP: 249.18 (4:1RR)
Trade safe!
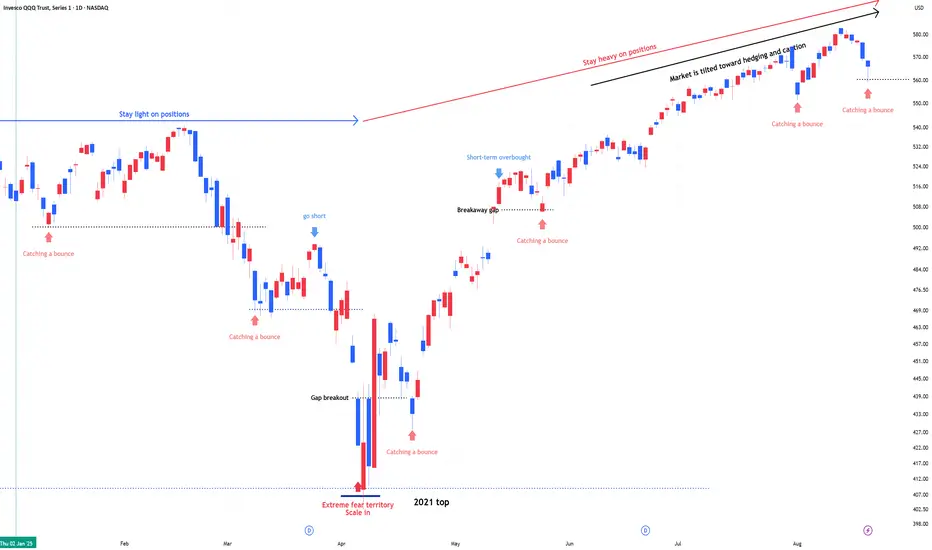
QQQ , Stay heavy on positions. QLD or TQQQ , Stay heavy on positions.
Same view as before. No change.
A signal for catching a bounce has emerged.
The bounce signal reflects a swing-to-intraday view and is not tied to the broader trend.
In stay light on positions zones, I hold QQQ and reduce exposure.
In stay heavy on positions zones, I increase allocation using a mix of QLD and TQQQ.
** This analysis is based solely on the quantification of crowd psychology.
It does not incorporate price action, trading volume, or macroeconomic indicators.
IWM is ready to make a larger move out of this wedge📈 IWM Technical Outlook – Wedge Break Imminent
Ticker: IWM (Russell 2000 ETF)
Timeframe: 30-minute candles
🔍 Current Setup
IWM has formed a symmetrical wedge, with price compressing between a descending resistance line (~227) and an ascending support line (~223.65). This pattern reflects a balance of buyers and sellers — and it’s nearing its apex, signaling that a decisive breakout is likely very soon.
📊 Breakout Levels
🚀 Upside (Bullish Scenario)
Trigger: Close above 227.00 with volume
Intermediate Targets:
231.50–232.00 → Prior swing high resistance
235.00–236.00 → Momentum continuation zone
Measured Move Target: 237.00
🔻 Downside (Bearish Scenario)
Trigger: Close below 223.65 with volume
Intermediate Supports:
221.00 → Local demand area
217.00 → Previous consolidation base
Measured Move Target: 213.50
📈 Volume Analysis
Recent candles show a pickup in volume, a classic sign that markets are preparing for a strong move.
Whichever side breaks first is likely to carry momentum, with follow-through expected.
⚖️ Probability Bias
Current price action suggests buyers are defending the rising trendline, but momentum has slowed since the last rally.
A strong close above 227 would put bulls firmly in control.
Conversely, failure to hold 223.65 opens the door for a deeper correction.
✅ Takeaway
The wedge is tight, and the breakout is imminent:
Bullish Break > 227: Look for 231.50 → 235 → 237
Bearish Break < 223.65: Look for 221 → 217 → 213.50
Stay alert — volume will confirm the true direction.
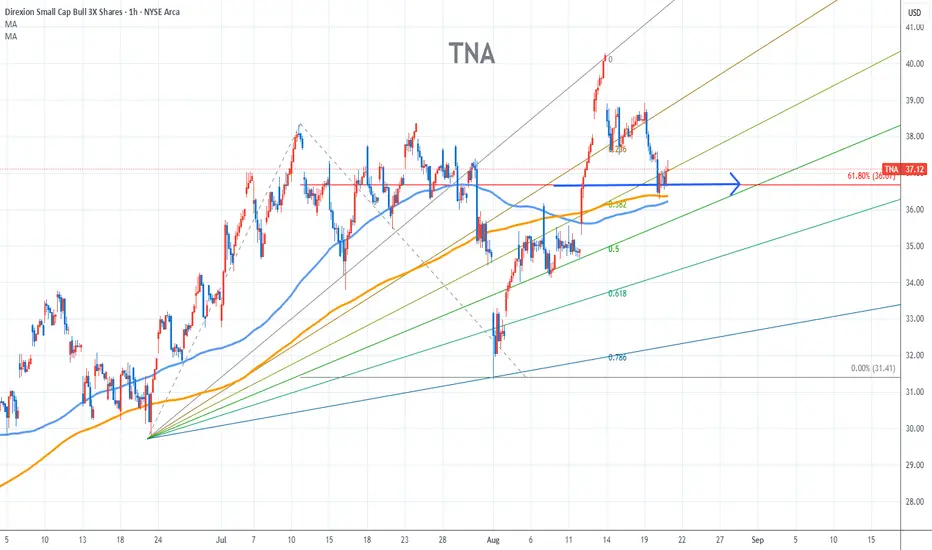
TNA Stock Chart Fibonacci Analysis 082025Trading Idea
1) Find a FIBO slingshot
2) Check FIBO 61.80% level
3) Entry Point > 36/61.80%
Chart time frame:B
A) 15 min(1W-3M)
B) 1 hr(3M-6M)
C) 4 hr(6M-1year)
D) 1 day(1-3years)
Stock progress:A
A) Keep rising over 61.80% resistance
B) 61.80% resistance
C) 61.80% support
D) Hit the bottom
E) Hit the top
Stocks rise as they rise from support and fall from resistance. Our goal is to find a low support point and enter. It can be referred to as buying at the pullback point. The pullback point can be found with a Fibonacci extension of 61.80%. This is a step to find entry level. 1) Find a triangle (Fibonacci Speed Fan Line) that connects the high (resistance) and low (support) points of the stock in progress, where it is continuously expressed as a Slingshot, 2) and create a Fibonacci extension level for the first rising wave from the start point of slingshot pattern.
When the current price goes over 61.80% level , that can be a good entry point, especially if the SMA 100 and 200 curves are gathered together at 61.80%, it is a very good entry point.
As a great help, tradingview provides these Fibonacci speed fan lines and extension levels with ease. So if you use the Fibonacci fan line, the extension level, and the SMA 100/200 curve well, you can find an entry point for the stock market. At least you have to enter at this low point to avoid trading failure, and if you are skilled at entering this low point, with fibonacci6180 technique, your reading skill to chart will be greatly improved.
If you want to do day trading, please set the time frame to 5 minutes or 15 minutes, and you will see many of the low point of rising stocks.
If you want to prefer long term range trading, you can set the time frame to 1 hr or 1 day
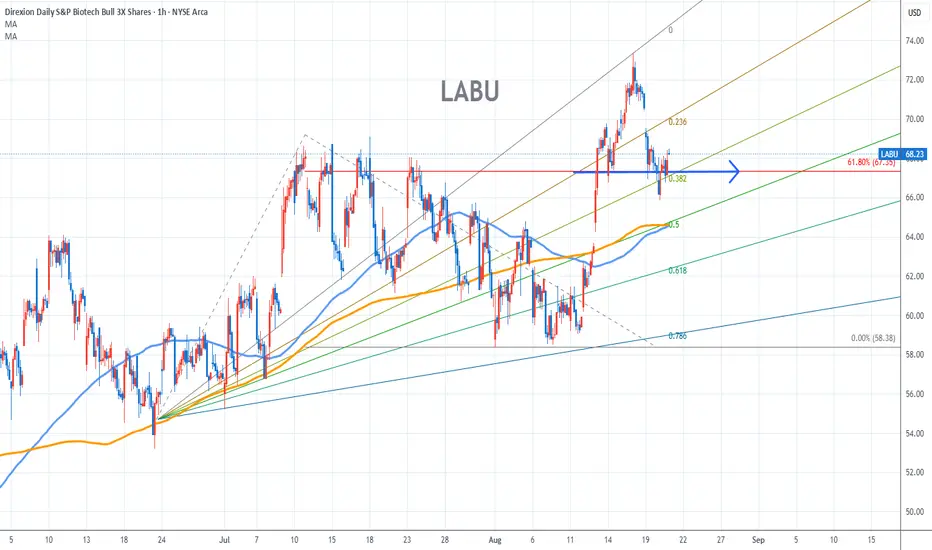
Labu Stock Chart Fibonacci Analysis 082025Trading Idea
1) Find a FIBO slingshot
2) Check FIBO 61.80% level
3) Entry Point > 67/61.80%
Chart time frame:B
A) 15 min(1W-3M)
B) 1 hr(3M-6M)
C) 4 hr(6M-1year)
D) 1 day(1-3years)
Stock progress:A
A) Keep rising over 61.80% resistance
B) 61.80% resistance
C) 61.80% support
D) Hit the bottom
E) Hit the top
Stocks rise as they rise from support and fall from resistance. Our goal is to find a low support point and enter. It can be referred to as buying at the pullback point. The pullback point can be found with a Fibonacci extension of 61.80%. This is a step to find entry level. 1) Find a triangle (Fibonacci Speed Fan Line) that connects the high (resistance) and low (support) points of the stock in progress, where it is continuously expressed as a Slingshot, 2) and create a Fibonacci extension level for the first rising wave from the start point of slingshot pattern.
When the current price goes over 61.80% level , that can be a good entry point, especially if the SMA 100 and 200 curves are gathered together at 61.80%, it is a very good entry point.
As a great help, tradingview provides these Fibonacci speed fan lines and extension levels with ease. So if you use the Fibonacci fan line, the extension level, and the SMA 100/200 curve well, you can find an entry point for the stock market. At least you have to enter at this low point to avoid trading failure, and if you are skilled at entering this low point, with fibonacci6180 technique, your reading skill to chart will be greatly improved.
If you want to do day trading, please set the time frame to 5 minutes or 15 minutes, and you will see many of the low point of rising stocks.
If you want to prefer long term range trading, you can set the time frame to 1 hr or 1 day
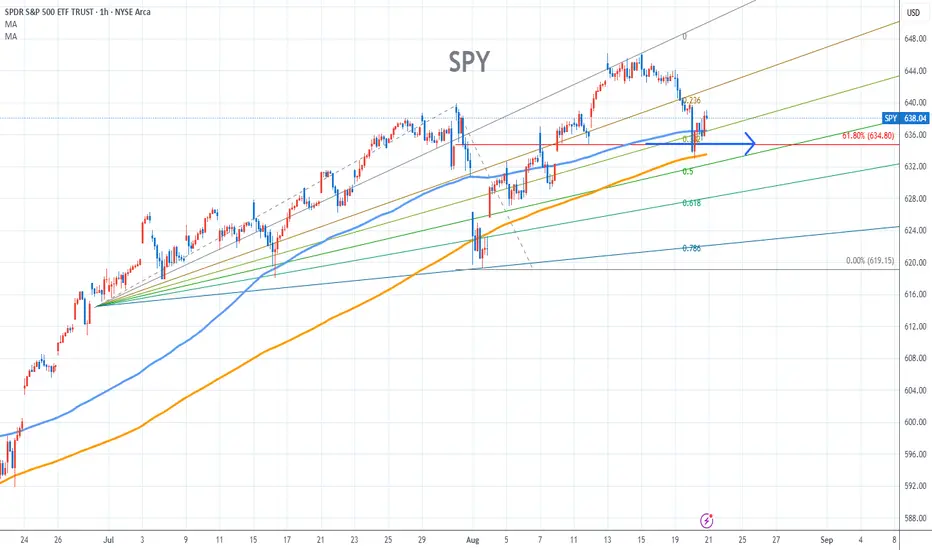
SPY Stock Chart Fibonacci Analysis 082025Trading Idea
1) Find a FIBO slingshot
2) Check FIBO 61.80% level
3) Entry Point > 634/61.80%
Chart time frame:B
A) 15 min(1W-3M)
B) 1 hr(3M-6M)
C) 4 hr(6M-1year)
D) 1 day(1-3years)
Stock progress:A
A) Keep rising over 61.80% resistance
B) 61.80% resistance
C) 61.80% support
D) Hit the bottom
E) Hit the top
Stocks rise as they rise from support and fall from resistance. Our goal is to find a low support point and enter. It can be referred to as buying at the pullback point. The pullback point can be found with a Fibonacci extension of 61.80%. This is a step to find entry level. 1) Find a triangle (Fibonacci Speed Fan Line) that connects the high (resistance) and low (support) points of the stock in progress, where it is continuously expressed as a Slingshot, 2) and create a Fibonacci extension level for the first rising wave from the start point of slingshot pattern.
When the current price goes over 61.80% level , that can be a good entry point, especially if the SMA 100 and 200 curves are gathered together at 61.80%, it is a very good entry point.
As a great help, tradingview provides these Fibonacci speed fan lines and extension levels with ease. So if you use the Fibonacci fan line, the extension level, and the SMA 100/200 curve well, you can find an entry point for the stock market. At least you have to enter at this low point to avoid trading failure, and if you are skilled at entering this low point, with fibonacci6180 technique, your reading skill to chart will be greatly improved.
If you want to do day trading, please set the time frame to 5 minutes or 15 minutes, and you will see many of the low point of rising stocks.
If you want to prefer long term range trading, you can set the time frame to 1 hr or 1 day
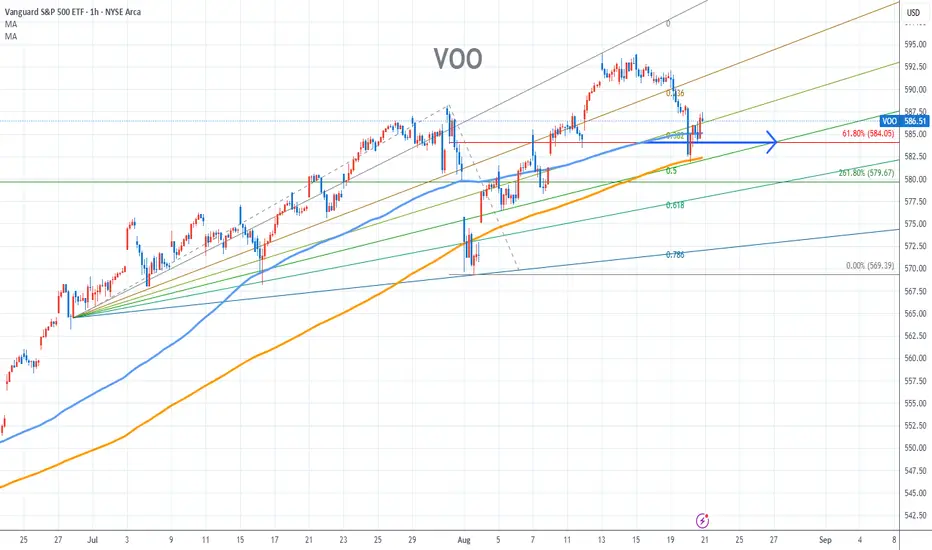
VOO Stock Chart Fibonacci Analysis 082025Trading Idea
1) Find a FIBO slingshot
2) Check FIBO 61.80% level
3) Entry Point > 584/61.80%
Chart time frame:B
A) 15 min(1W-3M)
B) 1 hr(3M-6M)
C) 4 hr(6M-1year)
D) 1 day(1-3years)
Stock progress:A
A) Keep rising over 61.80% resistance
B) 61.80% resistance
C) 61.80% support
D) Hit the bottom
E) Hit the top
Stocks rise as they rise from support and fall from resistance. Our goal is to find a low support point and enter. It can be referred to as buying at the pullback point. The pullback point can be found with a Fibonacci extension of 61.80%. This is a step to find entry level. 1) Find a triangle (Fibonacci Speed Fan Line) that connects the high (resistance) and low (support) points of the stock in progress, where it is continuously expressed as a Slingshot, 2) and create a Fibonacci extension level for the first rising wave from the start point of slingshot pattern.
When the current price goes over 61.80% level , that can be a good entry point, especially if the SMA 100 and 200 curves are gathered together at 61.80%, it is a very good entry point.
As a great help, tradingview provides these Fibonacci speed fan lines and extension levels with ease. So if you use the Fibonacci fan line, the extension level, and the SMA 100/200 curve well, you can find an entry point for the stock market. At least you have to enter at this low point to avoid trading failure, and if you are skilled at entering this low point, with fibonacci6180 technique, your reading skill to chart will be greatly improved.
If you want to do day trading, please set the time frame to 5 minutes or 15 minutes, and you will see many of the low point of rising stocks.
If you want to prefer long term range trading, you can set the time frame to 1 hr or 1 day
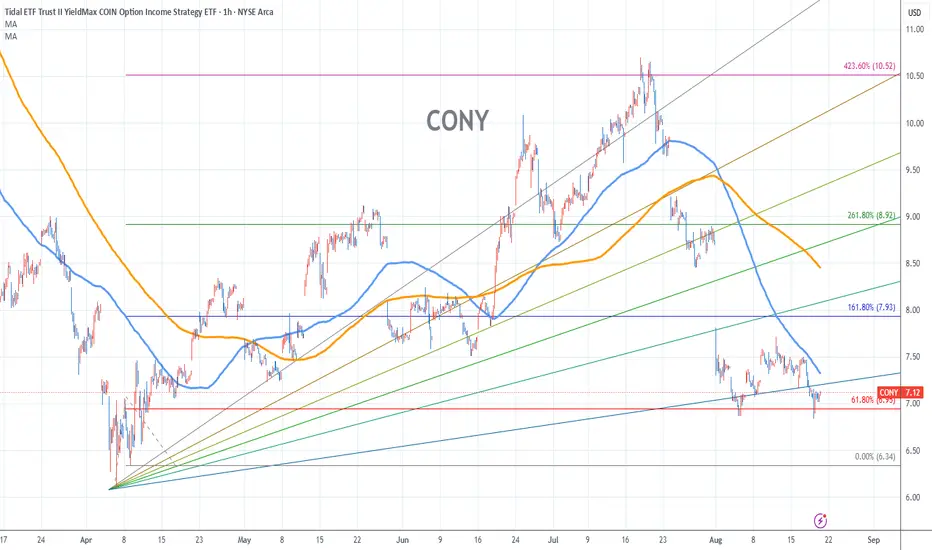
Cony Stock Chart Fibonacci Analysis 082025Trading Idea
1) Find a FIBO slingshot
2) Check FIBO 61.80% level
3) Entry Point > 7.0/61.80%
Chart time frame:B
A) 15 min(1W-3M)
B) 1 hr(3M-6M)
C) 4 hr(6M-1year)
D) 1 day(1-3years)
Stock progress:C
A) Keep rising over 61.80% resistance
B) 61.80% resistance
C) 61.80% support
D) Hit the bottom
E) Hit the top
Stocks rise as they rise from support and fall from resistance. Our goal is to find a low support point and enter. It can be referred to as buying at the pullback point. The pullback point can be found with a Fibonacci extension of 61.80%. This is a step to find entry level. 1) Find a triangle (Fibonacci Speed Fan Line) that connects the high (resistance) and low (support) points of the stock in progress, where it is continuously expressed as a Slingshot, 2) and create a Fibonacci extension level for the first rising wave from the start point of slingshot pattern.
When the current price goes over 61.80% level , that can be a good entry point, especially if the SMA 100 and 200 curves are gathered together at 61.80%, it is a very good entry point.
As a great help, tradingview provides these Fibonacci speed fan lines and extension levels with ease. So if you use the Fibonacci fan line, the extension level, and the SMA 100/200 curve well, you can find an entry point for the stock market. At least you have to enter at this low point to avoid trading failure, and if you are skilled at entering this low point, with fibonacci6180 technique, your reading skill to chart will be greatly improved.
If you want to do day trading, please set the time frame to 5 minutes or 15 minutes, and you will see many of the low point of rising stocks.
If you want to prefer long term range trading, you can set the time frame to 1 hr or 1 day
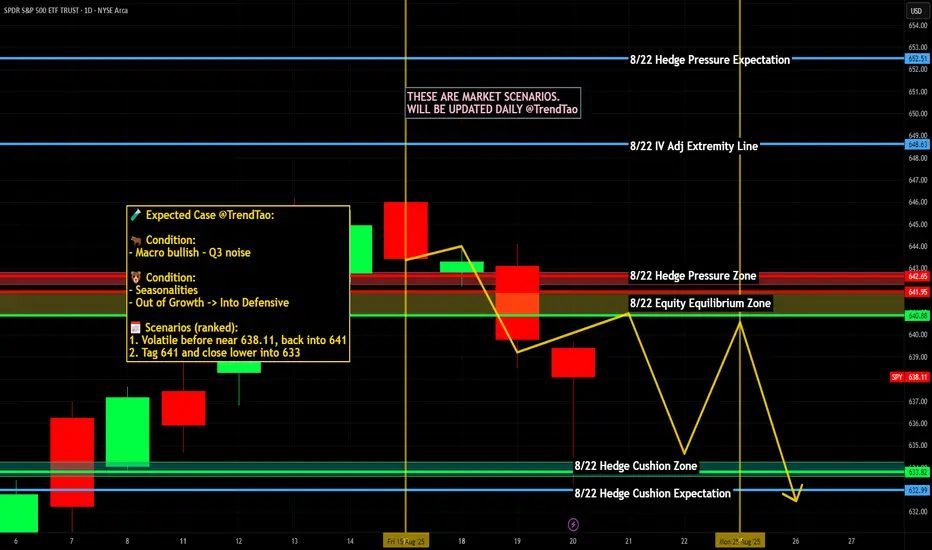
Nightly $SPY / $SPX Scenarios for Thursday, August 21, 2025 🔮 Nightly AMEX:SPY / SP:SPX Scenarios for Thursday, August 21, 2025 🔮
🌍 Market-Moving Headlines
Tech jitters spill as Jackson Hole kicks off. Global equities slipped following a tech sell‑off driven by concerns over U.S. intervention in chipmakers, while traders await Fed Chair Powell’s policy cues. AMEX:SPY and NASDAQ:TLT under pressure as rate‑cut expectations waver.
Sony hikes PS5 prices amid tariffs. Effective August 21, PlayStation 5 models in the U.S. see a $50 price increase—tariff impact spilling into consumer electronics. Raises inflation whispers amid already elevated tech cost narrative.
Healthcare activism heats up. Boards at firms like Medtronic, Pfizer, and Novo Nordisk shift under investor pressure—governance shake‑ups adding a layer of corporate risk and potential M&A signals.
⏱ Key Data Releases & Events (ET)
10:00 AM — Advance Services Report (Q2) (Census bureau). Quarterly weight of service economy—strong print supports Pro side of markets; weak could dial back rate‑cut hopes.
10:00 AM — Summer Youth Labor Force Survey (Annual). Goes with job‑market narrative from July—may tweak Fed sentiment depending on labor softening/stability.
Jackson Hole Symposium begins. Markets now fully focused on Powell; tone could make or break short‑term equity and bond positions.
⚠ Disclaimer: Educational/informational only — not financial advice.
📌 #trading #stockmarket #Fed #JacksonHole #SPY #SPX #TLT #Sony #tech #tariffs #services #labor #activism #healthcare
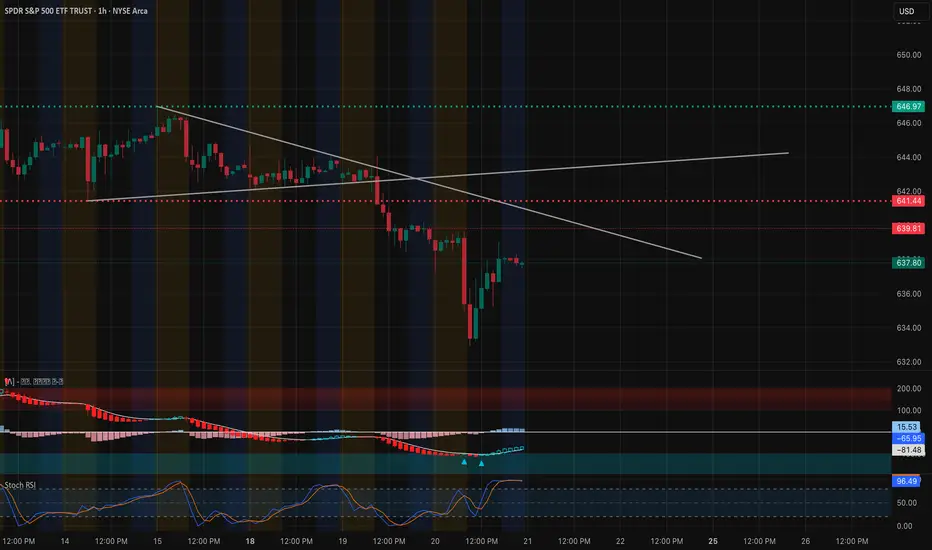
SPY at a Decision Point – Aug. 21SPY at a Decision Point – Will 639 Hold or Break? 📉📈
Technical Analysis (1H Chart)
SPY is showing a classic bounce attempt after the sharp selloff. Price is sitting around 637–638, just under the downtrend resistance line. The chart highlights:
* Trendline Pressure: Multiple touches of the descending trendline; rejection risk remains high unless bulls reclaim 641–642.
* Key Support: Buyers defended the 635 zone, with the next strong support down at 632–633. Losing this area could trigger another wave lower.
* Momentum Indicators:
* MACD is trying to curl bullish from oversold, but momentum is shallow.
* Stoch RSI is already extended near overbought — suggesting rallies may stall soon if not confirmed with volume.
* Structure: If SPY fails to clear 641.5–642, we may see another lower-high formation and retest of 635.
Trading View (Intraday):
* Bullish case → Clear break + hold above 642, targeting 646–647 supply zone.
* Bearish case → Failure under 639–641 could drag SPY back toward 635–633.
GEX / Options Sentiment
Options positioning confirms this tight battle zone:
* Call Walls / Resistance:
* 640 → First big resistance, aligning with HVL zone.
* 642–644 → Multiple call walls (9–10% concentration).
* 647–648 → Extreme upside wall, likely gamma cap.
* Put Walls / Support:
* 637 (GEX7 / -11%) → First downside magnet.
* 635 (2nd Put Wall / -20%) → Strong support cluster.
* 632 (GEX10 / -5%) → Deeper downside target if selling extends.
* Net Options Flow:
* Puts dominate ~87% (bearish tilt).
* IVR low (14.4) → cheap options pricing, directional plays favored.
* GEX heavily negative at 639, meaning dealer hedging could accelerate volatility around this pivot.
Thoughts & Suggestions
* Market is heavily leaning bearish, but intraday scalps can flip quickly if bulls reclaim 642.
* For options traders:
* Bullish scalp setup → Calls only if breakout above 642 with momentum confirmation.
* Bearish setup → Favor puts on rejection under 639–641, with 635/632 as profit zones.
* Risk management is key here: chop is possible between 637–641 before a decisive move.
🔔 Conclusion: SPY is at a tight inflection between 639 support and 641–642 resistance. Dealer flow favors downside, but if bulls can reclaim 642, a short squeeze toward 646–647 opens up. Until then, bias stays slightly bearish.
Disclaimer: This analysis is for educational purposes only and not financial advice. Always do your own research and manage risk before trading.
PLTR Bouncing Off Capitulation Zone-Aug 21PLTR Bouncing Off Capitulation Zone – Can Bulls Reclaim Control? 🚀
🔹 Technical Analysis (1-Hour Chart)
PLTR sold off sharply, finding a temporary bottom around $149–150, which aligned with high volume support. The rebound has been strong, with price now pressing into the $159–160 resistance shelf. This zone is critical because it coincides with a previous breakdown level.
* Trend: Still bearish overall, but the sharp bounce shows buyers defending the $150 zone.
* Momentum: Stoch RSI is turning up from oversold, while MACD shows early bullish momentum.
* Resistance Levels: $160 (current HVL and breakdown shelf), then $162.5 and $167.5.
* Support Levels: $155 (minor shelf), then $150 (major support). A loss of $150 opens the door toward $145.
If $160 is reclaimed and held, PLTR can attempt a short-term recovery back into the mid-$160s. Failure at this resistance risks another leg lower toward $150.
🔹 GEX / Options Sentiment
Options positioning highlights the same pivot:
* Call Resistance: Heavy walls at $162.5 (45%) and $167.5 (26%), with another layer at $170 (41%). Dealers are short here, so breakouts above $162.5 could squeeze.
* Put Support: Strongest put wall around $155, with extreme negative GEX at $150 and $145. If $150 breaks, downside could accelerate.
* IV & Sentiment: IVR 25.9 with calls only 7.9% → options sentiment still leans bearish/hedged.
Interpretation: GEX suggests a tug-of-war between $155–160. Bulls must clear $160 to ignite call wall hedging up toward $167+. Bears will defend this zone aggressively, and a rejection here drags us back toward $150.
🎯 Trade Thoughts
* Bullish Setup: Break & hold above $160 → entry long with targets $162.5 → $167.5. Stop under $155.
* Bearish Setup: Rejection at $160 → short targeting $155 → $150. Stop above $162.5.
Conclusion:
PLTR is at a decision point. $160 is the key battleground for bulls vs bears. Options data aligns with the chart — reclaiming $160 could spark a gamma squeeze higher, while rejection keeps pressure back to $150 support.
Disclaimer: This analysis is for educational purposes only and not financial advice. Always do your own research and manage risk accordingly.
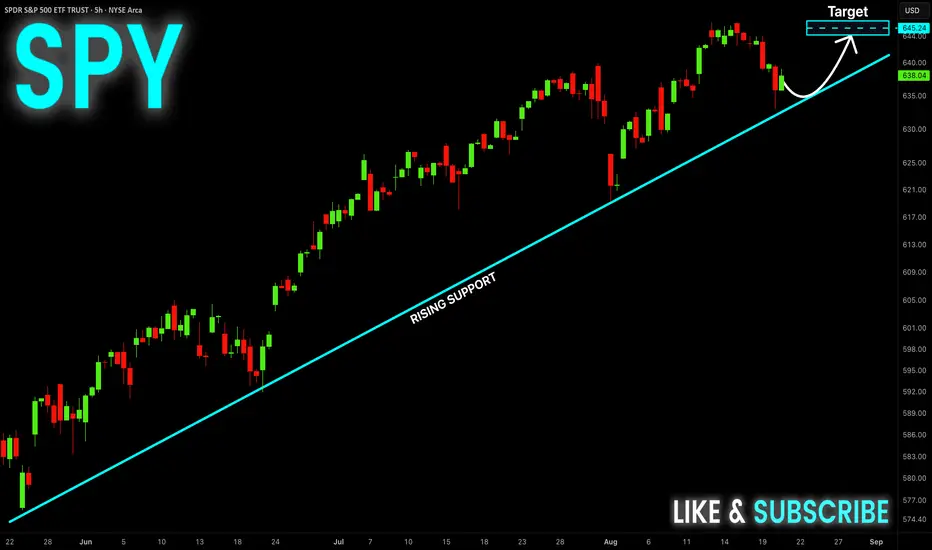
SPY Long From Rising Support! Buy!
Hello,Traders!
SPY is trading in an
Uptrend along the
Rising support and we
Are already seeing a
Bullish rebound from
The line so we will be
Expecting a further
Bullish move up
Buy!
Comment and subscribe to help us grow!
Check out other forecasts below too!
Disclosure: I am part of Trade Nation's Influencer program and receive a monthly fee for using their TradingView charts in my analysis.
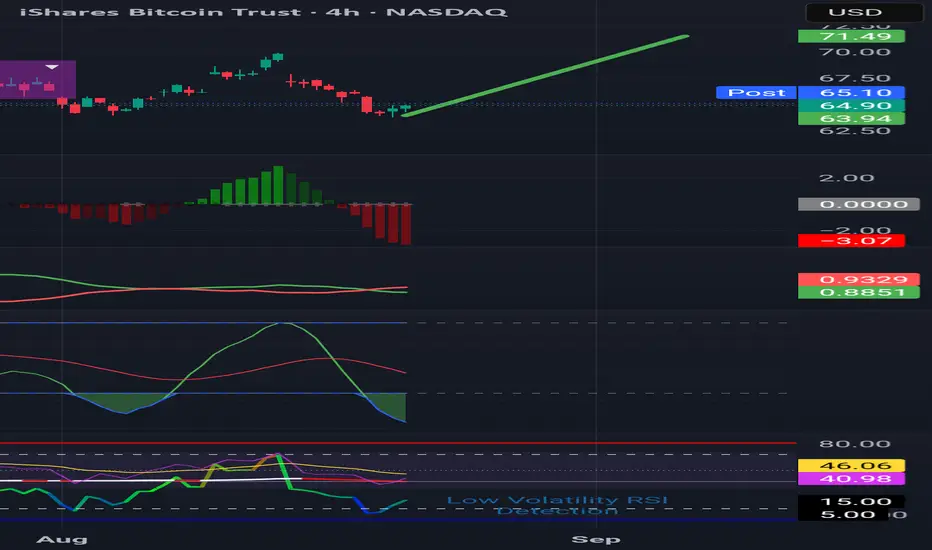
ibit Bitcoin ETF LONG now is a good time to invest. If you go on Google and type in far side Bitcoin and click the link that goes to the farside uk Bitcoin site. You'll see the daily money flows into or out of all of the different Bitcoin ETFs. If you do the same thing but type ethereum instead you'll see all of the different inflows and outflows of money into the ethereum ETF.
This is important because with the Bitcoin ETFs you'll see that there's been hundreds of million dollars in inflows in the past week. Yet both the 19th and the 20th had outflows of money. 1 and 1/2 weeks ago the same thing happened there were two days without flows of money and then it continued with major inflows of money.
In my opinion I believe this is because the large corporations and investors put too much money in to the ETFs in order to manipulate it so that it will gain a higher value.
They also talk to each other and plan these events so that they can profit from them. So let's take five fake companies that we just call 1 2 3 and 4 and 5. These five companies will all talk to each other on the phone and tell each other well we want to put in 200 million over the course of the week well we want to put in 300 million over the course of the week.
Over the course of one week
Company 1 wants to put in 200 million
Company 2 wants to put in 300 million
Company 3 wants to put in 400 million
Company 4 wants to put in 250 million
Company 5 wants to put in 300 million
Total 1.45 billion, they want that money to stay in Bitcoin at their investment.
Like I said they all plan this to manipulate Bitcoin in my opinion.
This is what happens:
Company 2 puts in 600 million
Company 2 puts in 700 million
Company 3 puts in 800 million
Company 4 puts in 450 million
Company 5 puts in 600 million
Total real investment 3.15 billion
Why do they do it?
This is only an example but over the course of one week these companies wanted to put in 1.45 billion but they ended up putting in 3.15 billion.
3.15 billion
1.45 billion -
-------
1.70 billion + surplus
So they put in 1.70 billion dollars over the amount that they were supposed to in order to get a rally going where Bitcoin goes up in value by a lot.
They are also in contact with the stock market listed Bitcoin mining companies so that the Bitcoin mining companies do not sell the Bitcoin. Instead they Bogart the Bitcoin (keep it) so that they can sell at a higher price when the companies get back in touch with them to say it's time to sell.
All of silicon valley is involved as well I believe in my opinion. All the tech companies and private investors with a lot of money and who knows maybe Mr SpaceX and Mr Amazon are also involved.
It's like a cabal. (Private political group) But for cryptocurrency.
So when this rally happens of course other people buy into the ETF like your average Joe. Hoping to profit.
What happens?
The ETF goes higher in value which means Bitcoin goes a lot higher in value. Maybe it will go up to 125,000 this time? Or maybe it will go up to 130,000 this time before going down?
What's the point?
The point is they are going to be selling that 1.7 billion dollar surplus because they only had 1.45 billion that they were going to put in.
That 1.7 billion dollar surplus that got the rally going and when it's time to sell could possibly be worth 7% to 8.5% more. Plus they're all putting in their own money into it because it's like insider trading. When you're putting your money into a stock as an institutional investor of course you're going to put your own money into it too so these people are putting 50 million dollars by themselves, 500 million by themselves. Who knows?
So surplus of 1.7 billion + 7% is now worth 1.819 billion or a gain of 119,000,000 million dollars. So they sell and they make $119 million for their company. Plus how much do they make for themselves and all of their cohorts that they are in contact with?
Insider trading at its finest.
This happens with all companies. Take for instance an airline. Companies know that maybe airlines will go up in the summer. Or they know that it will go up in the travel season for the holidays Thanksgiving and Christmas. So all the different companies they get in touch with each other and they say hey we're going to buy $5 billion of airline one and then the other company tells them okay we're going to buy 2 billion of airline one. Of course again they're all putting in their own money as well.
The Bitcoin rally is not over. We may see as high as 138,000 this rally. Before the bear market hits.
Some say we could see 420,000. I'm not sure about that I wonder if that's for the next rally in 2028 after the halving?
Will you take a leap of faith and do the right thing for humanity and leave a comment under this post with what your opinion is?
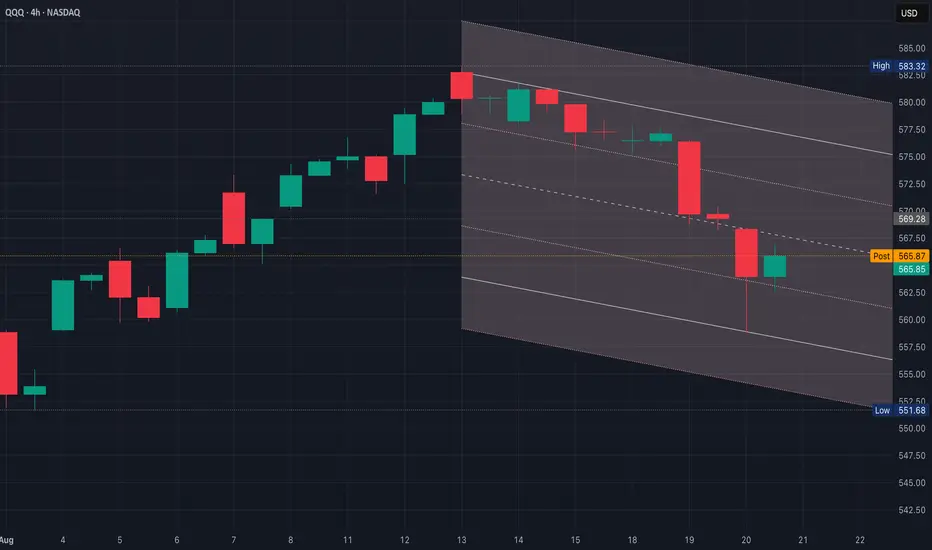
QQQ Bearish ContinuationFade into resistance at $567–$569, cover into $559–$555 & flip bullish only if $570+ is reclaimed
If QQQ rejects $568–$569 & rolls, target $562, then $559–$558 (channel bottom)
Breakdown below $558 opens $555–$553 extension
If QQQ can reclaim and close above $570, it breaks the channel mid-line and attacks $575–$577 (upper channel)
Only above $577+ do bulls get control back
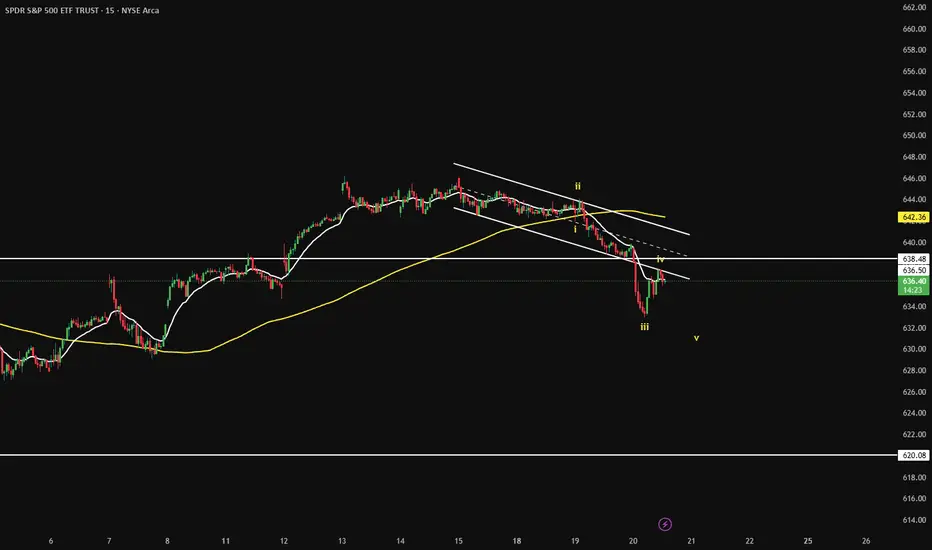
SPY wave 5 to 630ishSPY should complete wave 5 to 630 area which will complete higher degree wave 1, you can also use channels to determine where waves will begin and end