ETF market
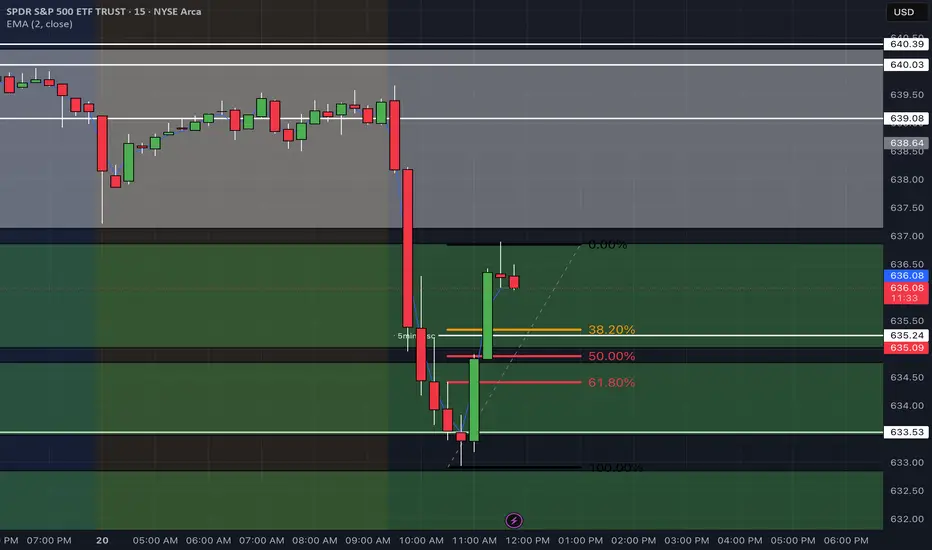
Scalp Trade
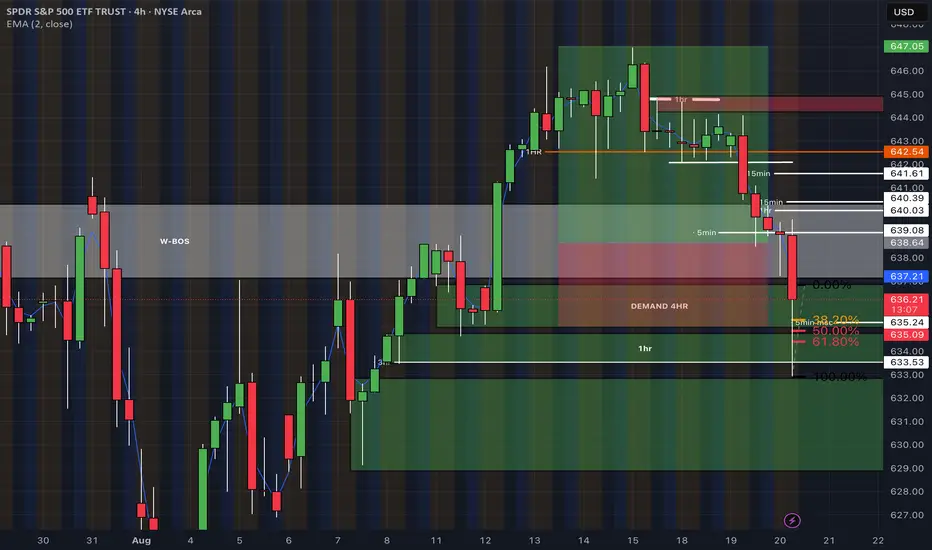
Price flushed down hard into demand and multiple timeframe demand zones overlap.
May take a quick bullish scalp today looking for confirmation on reversal on lower timeframes (15 - 5min) entry somewhere between 635 and 636 with a TP at 638.50.
Risk management due to high volatility around these zones
if price slices below 633.50 scalp will be invalidated and next leg may be lower.
look for next post for lower timeframe chart
SHORT | SPYAMEX:SPY
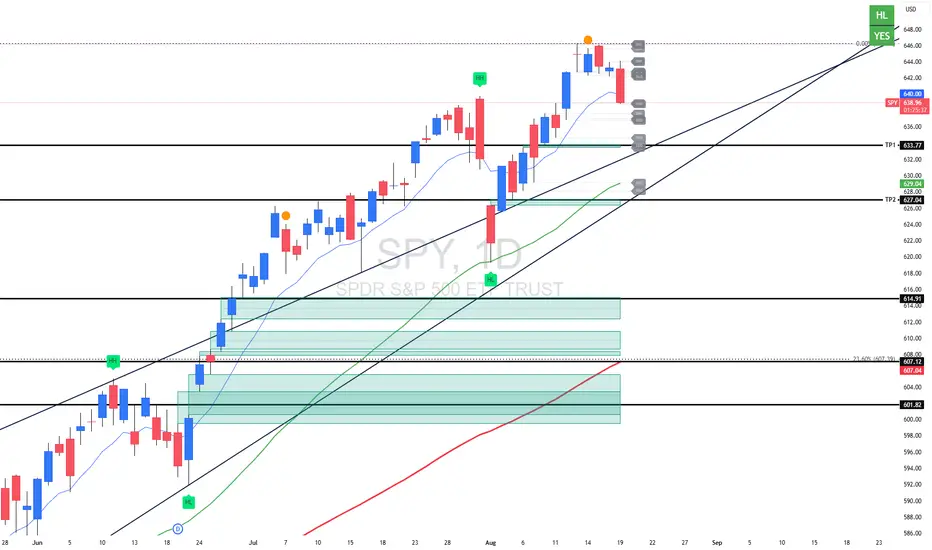
SPY Daily – Bearish Setup Developing
Trend Structure
SPY recently printed a Higher High near 646 but failed to hold momentum.
Current structure remains bullish overall, but the short-term is weakening.
A break below 627 would put the Higher Low sequence at risk.
EMA Context
Price rejected under the 9 EMA, signaling short-term weakness.
The 35 EMA around 629–630 is the first key support.
The 100 EMA near 607 aligns with demand/FVG zones and represents a major inflection.
Targets
TP1: 633.77
TP2: 627.04
Invalidation
A daily close above 646 would negate the bearish bias and re-open upside continuation.
Bias
Short-term bearish, expecting tests of 633.77 and 627.04.
If 627 breaks, next levels are 614–607.
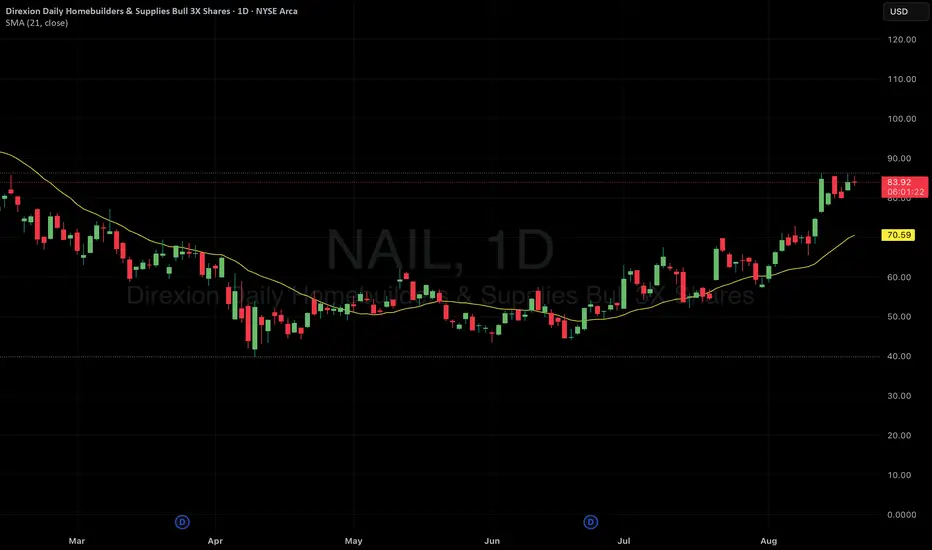
Homebuilders about the only bright spotAMEX:NAIL Looks like the homebuilders are about the only bright spot in the market. We will see if there is any sell off prior to the Jackson Hole meeting with Powell. If he still continues to say "we will follow the data" :) and does not impact the perception of a rate cut in September, then we should be off to the races....
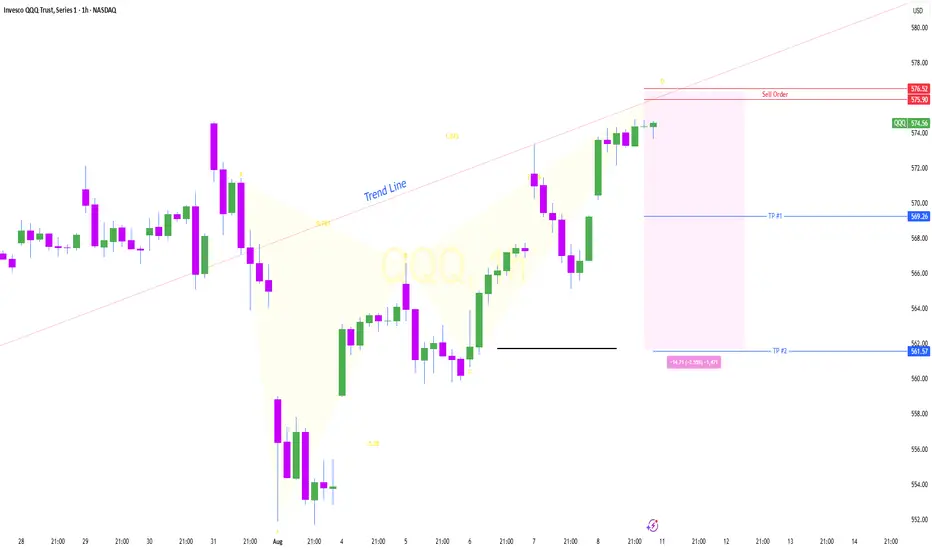
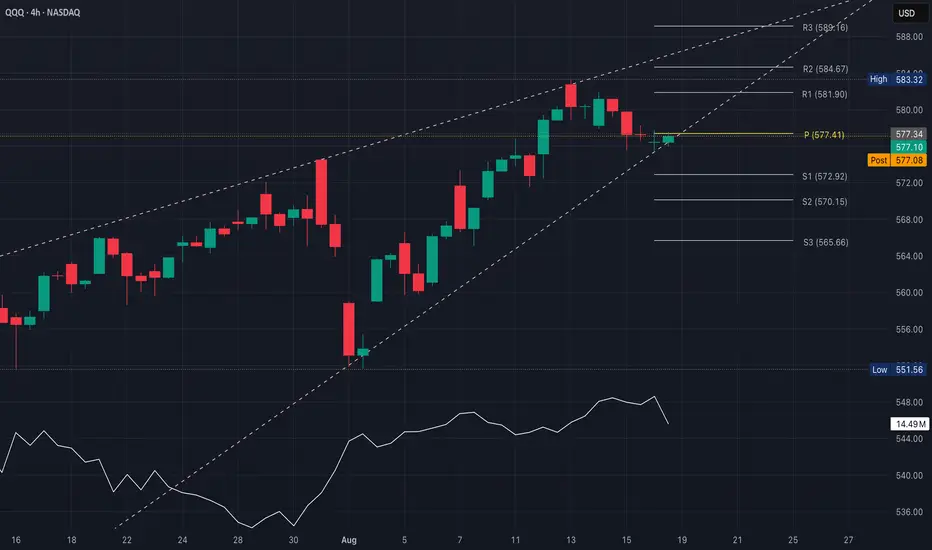
QQQ ShortThe QQQ is likely to decline from the 576 level, influenced by the Butterfly Pattern, and may move toward its anticipated target.
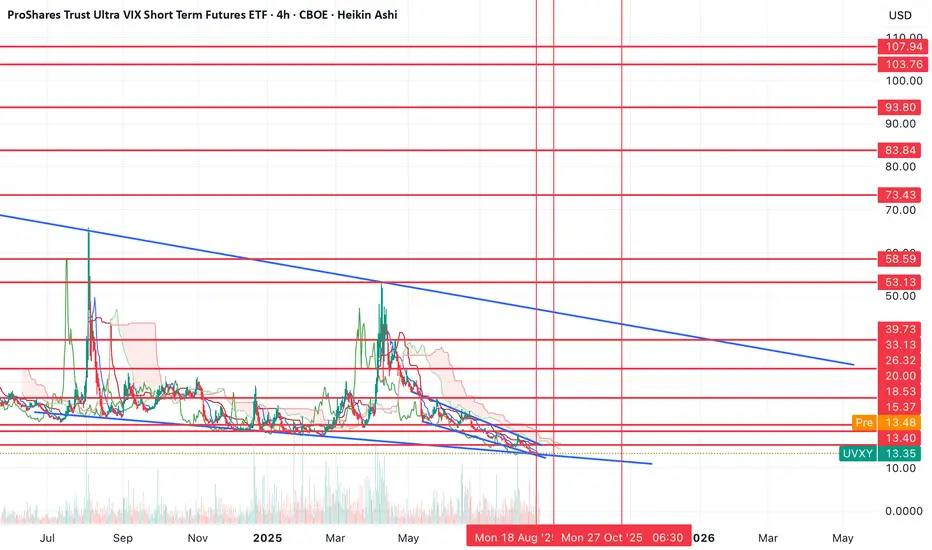
Finally time for UVXY again?As you can see from the chart, we've been in a downtrend channel since mid-May.
Price seems to be bottoming here. If price can break out above the channel (around the $16), we can see the start of a larger move.
The first hurdle to break will be breaking above the $46 level. If UVXY can do that, then I think it potentially has a clear path to the higher resistances on the chart.
I've long thought we were going to get a move up to the $80-100 level.
The last spike didn't fully materialize, which makes me think that if we see the move break out above the levels from April and last August, that we might finally get the massive moves to the top of the range.
Let's see if it plays out.
GDXJ up and awayBack to all time highs area in the next year and a half.
While DXY moves back to 87-88 and gold could reach the 2800 level.

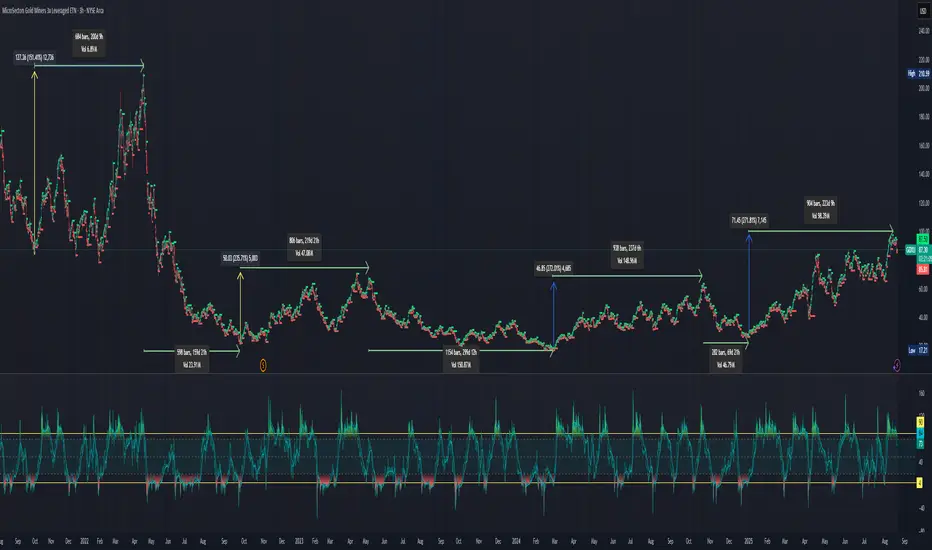
SHORT: Short term GDXU 2X pull back, is it now time to go GDXDI've laid out the major run ups and pull backs. The last 3 run ups have lasted 219 - 237 days. If the last peak was put in by GDXU it would put it at 225 days. I'm looking at this as a potential repeating pattern. Note the GDXU run ups based on a % gain from the bottom, assuming, the most recent peak was the final high in this run up. The run ups were +241%, +270%, and +279%. The run up also reasonable for the peak.
Big question, what about the draw downs. The last 2 have been -54%, -42%, and-60%. In GDXD, the inverse gold miners ETF 2X levered resulted in a gain of +90%, +58%, and +95%. The run up on the inverse side lasted 53, 20, and 22 days. GDXD is currently up +13% in the last 7 days.
Take aways, reduce/eliminate position in long GDXU and wait for a better buy in position and potential upside in the inverse gold miners etf.
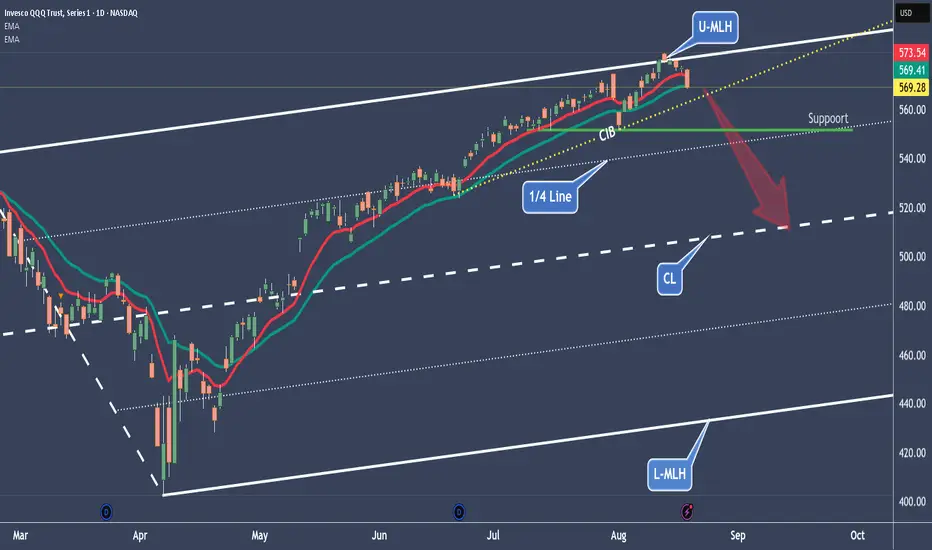
NQ – Nasdaq follows the witch’s SPY prophecyNot only is the S&P 500 following the oracle in the SPY, but the Nasdaq has also given us a short signal. So, the scenario is the same as with SPY: short down to the Centerline.
For the indicator traders, I’ve also added the EMA(10) and EMA(20). Look at how well they’ve provided support so far. If the EMA(20) cracks, things will get hot. And if the CIB line (Change In Behavior) also breaks, then all hell breaks loose!
As already mentioned in the SPY post, it wouldn’t be a shame to take at least 50% of the profits you’ve accumulated so far. Because if it goes further up, e.g. above the U-MLH, you still have 50% left to benefit. If it goes down, we’ve already bagged 50%.
BTW: At the 1/4 line, we can usually expect support.
Exciting times, when maybe it’s better to sit still and keep your hands to yourself.
I’ll create the YT video with details tomorrow.
Happy profits to you all!
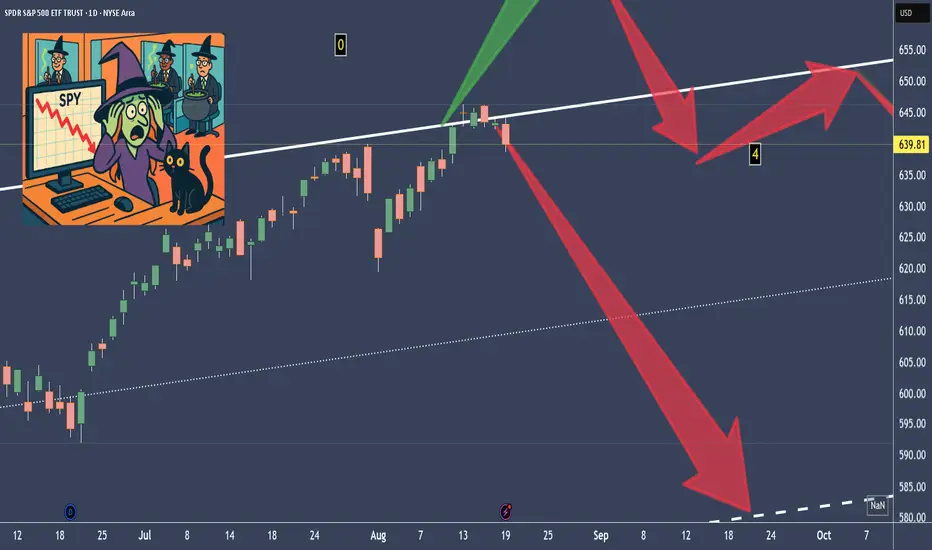
SPY – No hocus-pocus – Now the witch is hunting the bullsHappy Hump-Day y'all!
In the last post (see linked chart), I explained what the witch sees in the future.
A possible scenario that is long overdue: the markets are letting out air.
With the candles from yesterday and the day before, we have confirmation that the S&P 500 is heading south. That has consequences that not many want to see right now.
The bulls will be overrun, panic selling will kick in and drive the markets into the ground even faster. The current profit target is still the Centerline, as marked with the red arrow.
Whoever doesn’t cash in at least 50% of their gains now will end up in the witch’s cauldron §8-)
Let’s see how this develops.
The YT Video will be up tomorrow - gotta feed the witches cat §8-)
May the broom be with you!
Nightly $SPY / $SPX Scenarios for Wednesday, August 20, 2025🔮 Nightly AMEX:SPY / CBOE:SPX Scenarios for Wednesday, August 20, 2025 🔮
🌍 Market-Moving News
Jackson Hole in focus; dollar firms. Traders lean ~84% odds of a 25bp cut in September; watch TVC:DXY vs. $SPY/ NASDAQ:TLT as Powell risk approaches.
Retail baton passes from HD to LOW/TGT. After HD’s hold-guidance rally, attention shifts to Lowe’s/Target for read-throughs on DIY vs. pro spend and tariff pass-through.
Risk tone jittery into minutes. Tech led a pullback Tuesday; positioning lightens ahead of Fed minutes and Jackson Hole.
📊 Key Data Releases & Events (ET)
7:00 AM — MBA Mortgage Applications (weekly). Prior: +10.9% w/w (8/13). Why it matters: housing demand pulse → rates/affordability → AMEX:XHB and growth tone.
10:30 AM — EIA Weekly Petroleum Status. Prior crude change: +3.036M bbl. Why it matters: oil balance → gasoline/diesel → inflation & AMEX:XLE path.
1:00 PM — U.S. 20-Year Treasury Auction. Typical close: 1:00 ET; also 17-week bill today. Why it matters: term-premium & risk appetite; tails/stop-throughs can shake $TLT/$TNX.
2:00 PM — FOMC Minutes (July 29–30). Watch for: depth of cut debate, tariffs → inflation, labor cooling. Why it matters: reprices path-of-rates across curve and equities.
Earnings (before open): LOW, TGT, TJX, ADI (+ others). Why it matters: U.S. consumer & capex reads; category mix shifts. Lowe’s call 9:00 AM.
⚠️ Disclaimer: Educational/informational only — not financial advice.
📌 #trading #stockmarket #SPY #SPX #Fed #FOMCMinutes #JacksonHole #DXY #TLT #XLE #LOW #TGT #TJX #ADI
QQQ Bounce or Bleed?!The key question now is whether QQQ bases at $569 and bounces, or whether this was just the first flush before continuation
Above $572 (long bounce)
Below $569 (short bleed)
Between $569–$571 (chop zone, wait for break)
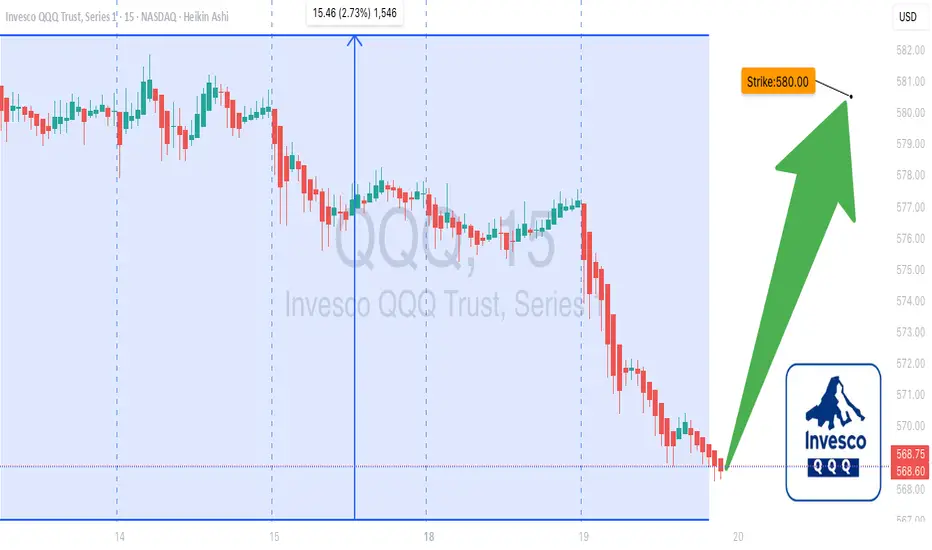
QQQ $580 Call Alert: Moderate Bullish Setup – Trade Smart!
# 🚀 QQQ Weekly Options Alert – \$580 Call (Aug 19, 2025) 💎🔥
### **Market Snapshot**
📊 **Daily RSI:** 63.8 ⬇️ (cooling momentum)
📈 **Weekly RSI:** 71.0 ⬆️ (bullish trend)
📉 **Volume:** Weak (0.8–1.1x prior week) 🚨
⚖️ **Options Flow:** Neutral (1.00 C/P ratio)
✅ **Volatility:** Favorable (VIX 15.8)
💡 **Overall Bias:** Moderate Bullish, but cautious due to weak volume & mixed momentum
---
### **Model Highlights**
* **Agreement:**
* Weekly RSI trending bullish 📈
* Weak volume signals institutional caution 🚨
* Low VIX supports directional plays 💎
* **Disagreement:**
* Grok, DeepSeek, Claude: moderate bullish entry possible 💡
* Gemini, Llama: advise avoiding trades due to unclear signals ❌
---
### **💥 Trade Recommendation**
🎯 **Strategy:** Cautious Call
* 🏦 **Instrument:** QQQ
* 💵 **Strike:** \$580
* 🗓️ **Expiry:** Aug 19, 2025
* 💰 **Entry Price:** \$1.30
* 🎯 **Profit Target:** \$1.40
* 🛑 **Stop Loss:** \$0.75
* ⏰ **Entry Timing:** Market Open
* 📈 **Confidence:** 65%
⚠️ **Key Risks:**
* Weak institutional support 📉
* Potential consolidation ⚖️
* Market volatility ⛈️
---
### **Trade JSON**
```json
{
"instrument": "QQQ",
"direction": "call",
"strike": 580.0,
"expiry": "2025-08-19",
"confidence": 0.65,
"profit_target": 1.40,
"stop_loss": 0.75,
"size": 1,
"entry_price": 1.30,
"entry_timing": "open",
"signal_publish_time": "2025-08-19 15:01:00 UTC-04:00"
}
```
📊 **Quick Trade Recap:**
🎯 CALL \$580 | 💵 \$1.30 → 🎯 \$1.40 | 🛑 \$0.75 | 📅 Aug 19 | 📈 65% Confidence
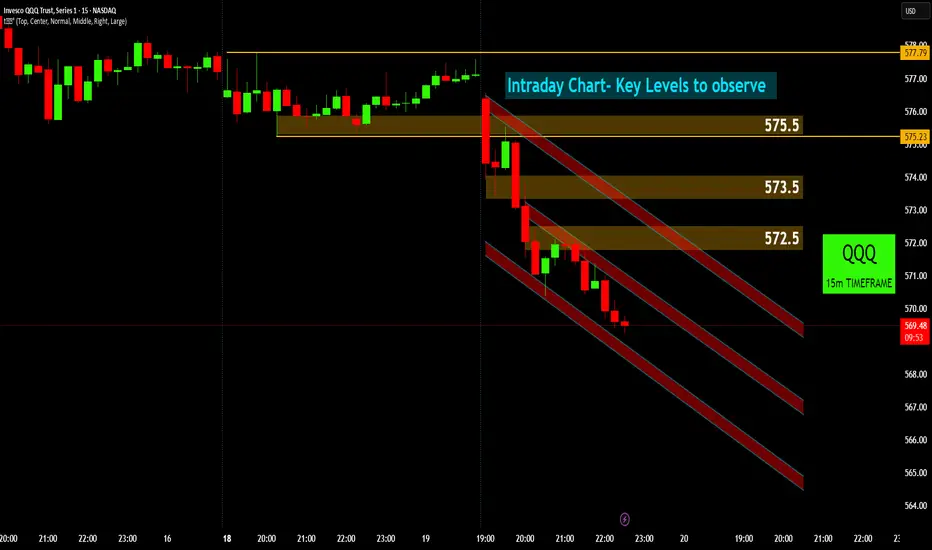
QQQ: Navigating the Intraday Downtrend🔭 QQQ's Current View: Bearish Channel in Focus! ⬇️
QQQ's intraday chart shows a recent breakdown, with price now navigating a clear bearish channel.
Initial Breakdown: QQQ experienced a sharp drop below 575.5 💥, turning previous support into immediate resistance. This marked the start of the current bearish leg.
Bearish Channel Formation: Price is now moving within a well-defined descending channel 🔽🔽🔽. This indicates short-term bearish control, with sellers dominant.
Overhead Resistance Zones: Key resistance levels to watch are 572.5 🧱 and 573.5 🧱. These levels, along with the channel's upper boundary, represent potential areas where sellers might step in if price attempts to rally.
Intraday Outlook: Traders should monitor how QQQ reacts within this channel. A move above the channel and 573.5 would signal a shift, while continued weakness points to further downside potential within the channel. Stay vigilant on these key levels for any intraday reversal or continuation signals.
Disclaimer
The information provided in this chart is for educational and informational purposes only and should not be considered as investment advice. Trading and investing involve substantial risk and are not suitable for every investor. You should carefully consider your financial situation and consult with a financial advisor before making any investment decisions. The creator of this chart does not guarantee any specific outcome or profit and is not responsible for any losses incurred as a result of using this information. Past performance is not indicative of future results. Use this information at your own risk. This chart has been created for my own improvement in Trading and Investment Analysis. Please do your own analysis before any investments.
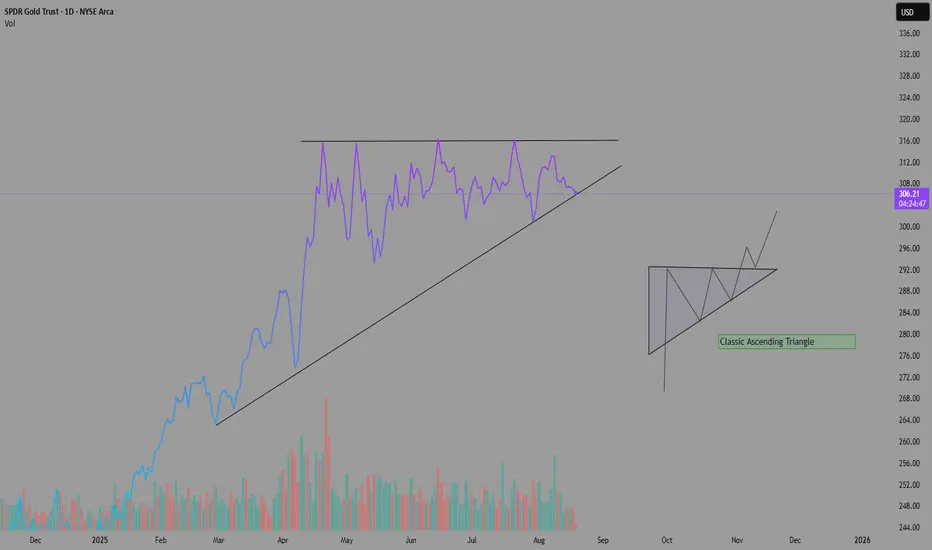
Possible Bullish Pattern For SPDR GOLD TRUSTLooks like an ascending triangle pattern is forming for this stock. Would be a textbook buy opportunity after breakout and Retest
This is not Financial Advice. Please DYOR
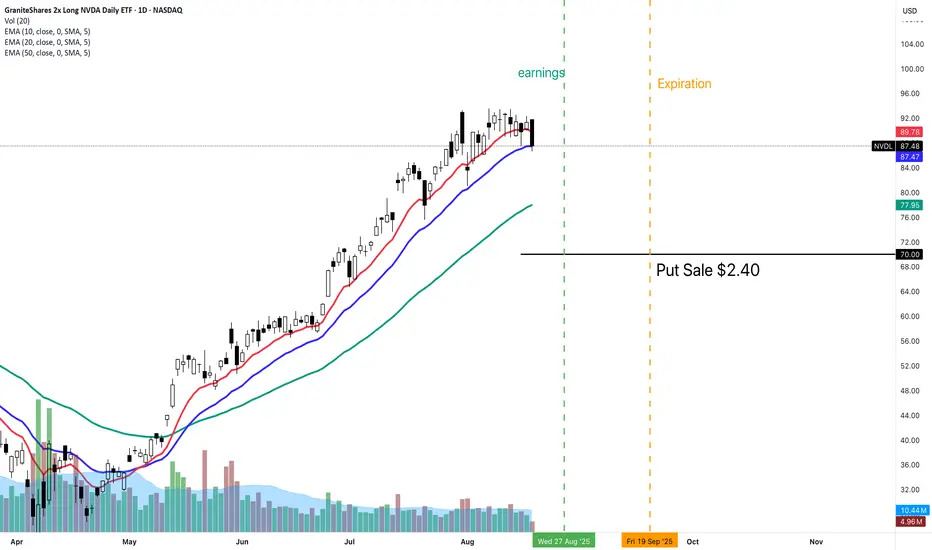
NVDL put saleFINALLY we hit the 20 ema!!!
This is over NVDA earnings. I really wouldn't mind owning this stock (again) down at this price!!
NVDL has treated me well. IF NVDA gaps down, REALLLY good chance it gets bought up!
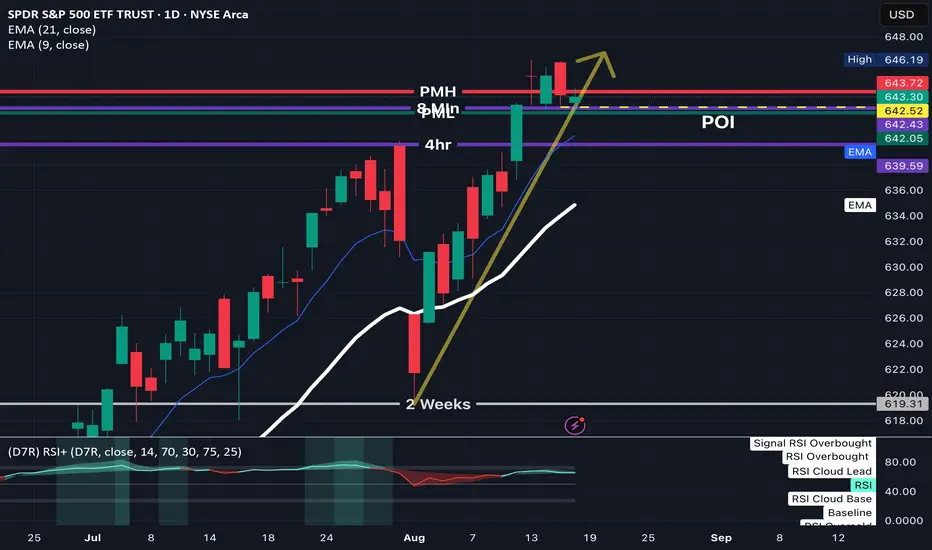
Turnaround Tuesday? ✅ Morning Levels + Setup (Tues, Aug 20)
Could be, Monday gave us the setup.
I’m watching building permits at 8:30. If those come in hot, it’s a signal housing’s holding up → stronger consumer → rate hike odds perk up → possible dollar spike → pressure on QQQ.
VIX is still asleep at 14.98, but if that creeps over 16.50, tone changes fast. Complacency’s real ,use it.
SPY levels I care about today:
646.40 = upside line in the sand
642.50 = support to hold
638 / 632 = where I’d aim puts if things unwind
Not overthinking it, waiting for price to confirm.
Nightly $SPY / $SPX Scenarios for August 19, 2025🔮 Nightly AMEX:SPY / SP:SPX Scenarios for August 19, 2025 🔮
🌍 Market-Moving Headlines
Global markets tread water ahead of Jackson Hole. Asian equities slipped while European futures edged up on signs of diplomatic progress in the Russia–Ukraine crisis, as markets await Fed Chair Powell’s keynote. AMEX:SPY / SP:SPX still anchored to central-bank risk tone.
Jackson Hole in focus. Investors are positioning for signals of a dovish tilt or rate cut cues in Powell’s speech later this week—data releases are in the shadow of event risk.
Home Depot earnings loom. Retail heavyweight Home Depot reports today; strong results could buoy equities, while a miss would fan caution on consumer resilience.
💼 Key Market Developments
Meta and Palo Alto highlight tech divergences. Meta shares slipped 2.3% on AI-leaning costs and metaverse skepticism, while Palo Alto surged 5% with robust Q4 and 2026 outlook—creating bifurcated leadership in tech.
Stagflation & AI risk lurk. Analysts warn of stagflation threats and fading AI momentum as catalysts for a broader pullback—S&P 500 still up ~10% YTD, but vulnerable.
⏱ Key Data Releases & Events (ET)
📅 Tuesday, August 19, 2025
Canada Inflation Rate (July): Expected 2.0% y/y — a minor but global inflation cue
U.S. Building Permits (July): Forecast ~1.39M — housing sector signpost ahead of Powell’s speech
Corporate Highlight:
Home Depot (HD) earnings — earnings and commentary on inflation, tariffs, demand dynamics
⚠ Disclaimer: Educational/informational only — not financial advice.
📌 #trading #stockmarket #economy #JacksonHole #Fed #SPY #SPX #HD #HomeDepot #JacksonHole #inflation #earnings #tech #AI #SP500
PSIL remains in a tightening patternConsolidation remains sideways and very healthy, with key supports in the mid 15s and key resistances in the 17s.

QQQ Gap PlayRight now, QQQ is resting right at wedge support + pivot, which is often where the next directional move starts
Price is pressing on the lower wedge line but not breaking with conviction
Volume (white line) is tapering, which means the “breakdown” pressure hasn’t been confirmed
Wedges love fake breakdowns - only act when price + volume confirm together
Gap up reclaims $578 at open with volume; ideally, a green candle with little/no lower wick (shows buyers controlled the whole session)
$582 to ~$586 AVWAP ($580C/$582C scalp, $585C swing)
Invalid back under ~$577
Gap down or fail $577 at open; ideally, opens & trades below $576 (prevents fake breakdowns) with volume expansion on the red candle (confirms sellers are pressing) - bonus if price retests $577 & fails (strong confirmation of breakdown)
$572, then ~$569 to ~$568 ($577P scalp, $575P main, $570P runner)
Invalid if price reclaims & holds above 579
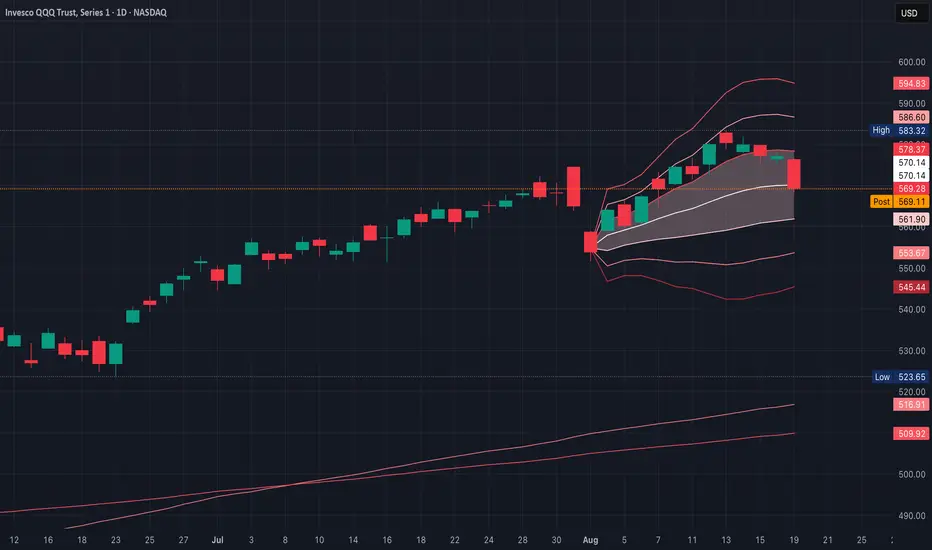
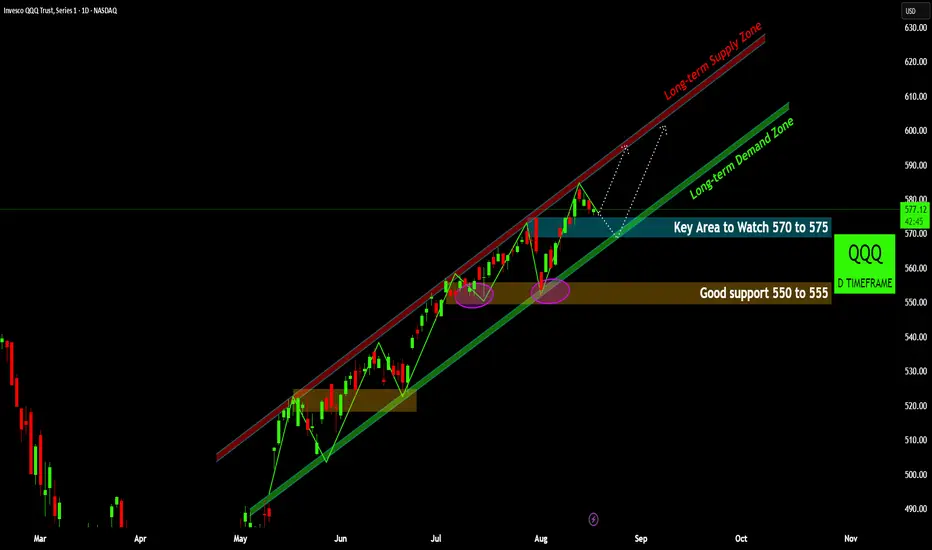
QQQ: Riding the Growth Wave – Key Demand Zones!QQQ: Riding the Growth Wave – Key Demand Zones! 🌊
QQQ continues its impressive ascent, firmly entrenched within a well-defined long-term bullish channel. The daily timeframe reveals critical demand zones currently in play, shaping the index's immediate future.
Persistent Bullish Channel: QQQ has maintained a robust uptrend within a clear long-term demand zone (green trendline) and is approaching the long-term supply zone (red trendline) 📊. This structure signifies consistent buyer interest and upward momentum.
Immediate Support in Focus: The 570-575 area 💙 represents a crucial immediate support zone. This level aligns directly with the lower boundary of the long-term demand channel, making it a pivotal area for buyers to defend and sustain the current uptrend.
Stronger Foundational Support: Should the immediate support yield, a more significant "good support" lies within the 550-555 range 🟠. This zone has historically proven resilient, acting as a strong floor for previous pullbacks and providing a robust buying opportunity.
Path to Supply Zone: A successful rebound from the current demand zone, particularly if the
570-575 level holds strong, would likely propel QQQ back towards its long-term supply zone 🔴. This upper channel boundary would represent the next major resistance target.
Outlook: The overall bullish trend remains intact as long as QQQ respects its long-term demand channel. Vigilance at the 570-575 level is key. A decisive break below this, however, could see the index testing the stronger 550-555 support ⚠️.
Disclaimer:
The information provided in this chart is for educational and informational purposes only and should not be considered as investment advice. Trading and investing involve substantial risk and are not suitable for every investor. You should carefully consider your financial situation and consult with a financial advisor before making any investment decisions. The creator of this chart does not guarantee any specific outcome or profit and is not responsible for any losses incurred as a result of using this information. Past performance is not indicative of future results. Use this information at your own risk. This chart has been created for my own improvement in Trading and Investment Analysis. Please do your own analysis before any investments.
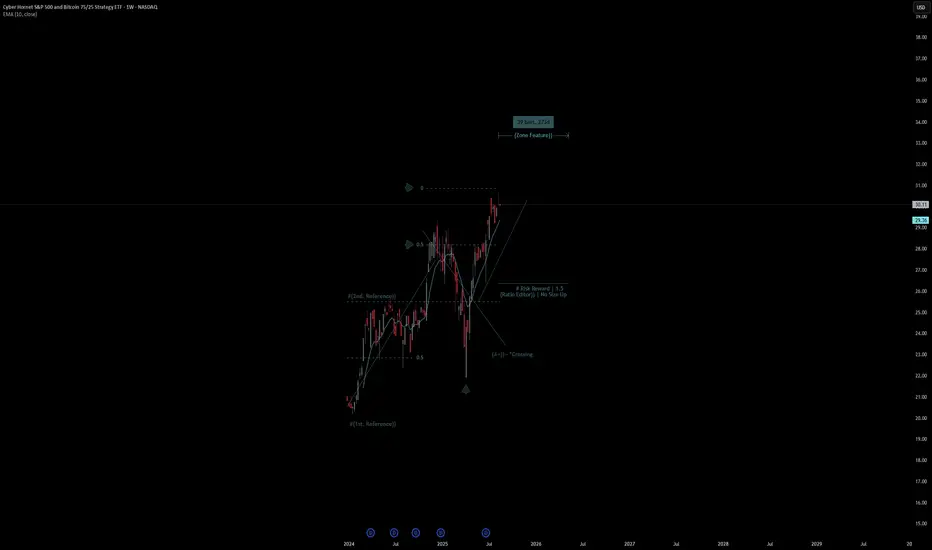
Cyber Hornet | Chart & Forecast SummaryKey Indicators On Trade Set Up In General
1. Push Set Up
2. Range Set Up
3. Break & Retest Set Up
Notes On Session
# Cyber Hornet
- Double Formation
* #(1st. Reference)) - *Retest Entry - *10EMA | Subdivision 1
* (A+)) - *Crossing | No Size Up | Completed Survey
* 39 bars, 273d | Date Range Method - *(Uptrend Argument))
- Triple Formation
* (P1)) / (P2)) & (P3)) | Subdivision 2
* Weekly Time Frame | Trend Settings Condition | Subdivision 3
- (Hypothesis On Entry Bias)) | Regular Settings
* Stop Loss Feature Varies Regarding To Main Entry And Can Occur Unevenly
- Position On A 1.5RR
* Stop Loss At 26.00 USD
* Entry At 29.00 USD
* Take Profit At 32.00 USD
* (Uptrend Argument)) & No Pattern Confirmation
- Continuation Pattern | Not Valid
- Reversal Pattern | Not Valid
* Ongoing Entry & (Neutral Area))
Active Sessions On Relevant Range & Elemented Probabilities;
European-Session(Upwards) - East Coast-Session(Downwards) - Asian-Session(Ranging)
Conclusion | Trade Plan Execution & Risk Management On Demand;
Overall Consensus | Buy