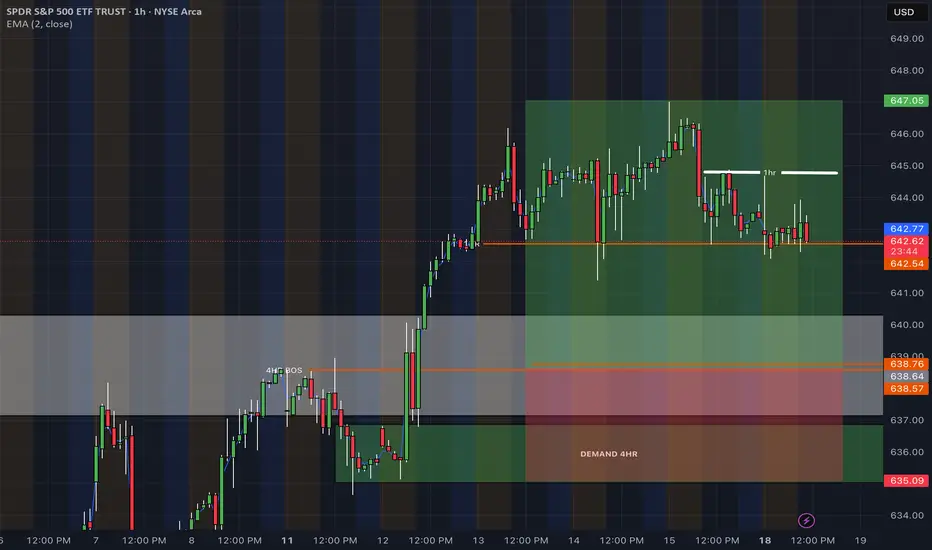
SPY - Area of interestBeen ptiently waiting since last week for price to reach my ideal entry. Watching closely, alerts set, nu rush just letting the market come to me.
ETF market
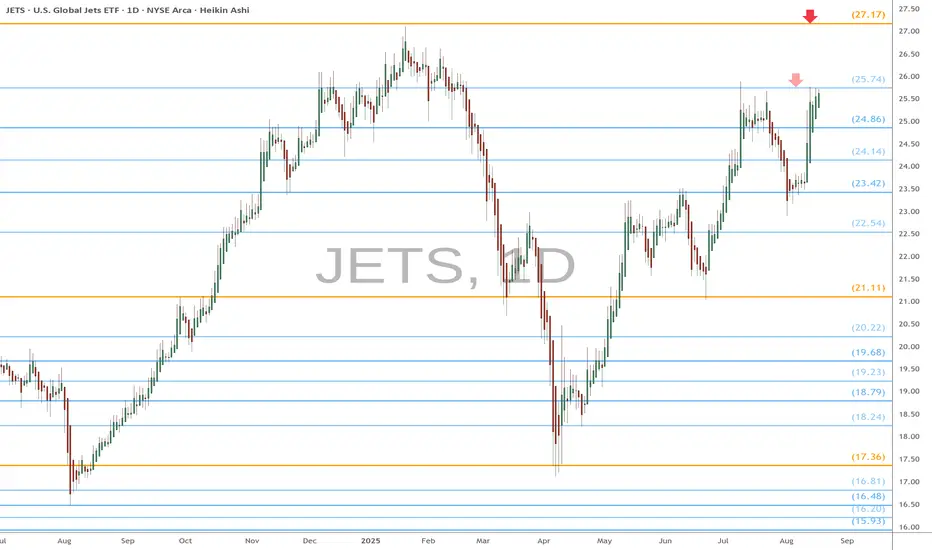
JETS watch $25.74 then 27.17: Genesis fibs may Ping-Pong a whileJETS has recovered nicely from the tariff tantrums.
Currently testing a "minor but key" Genesis fib at $27.74
Break should pop quickly to Golden fib above at $27.15
Another rejection could drop several fibs to find support.
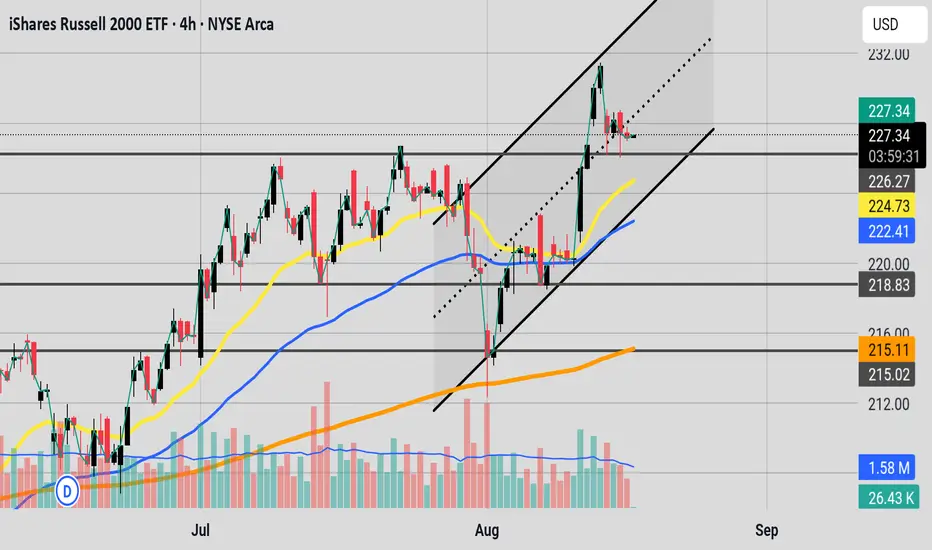
EMA stackBulls need price to show some bullish action on the 226 support level. We have a nice EMA stack 21 yellow 50 blue and 200 orange. If we do not hold the support at 226 we can test one of those EMA's, or one of the key levels under price.
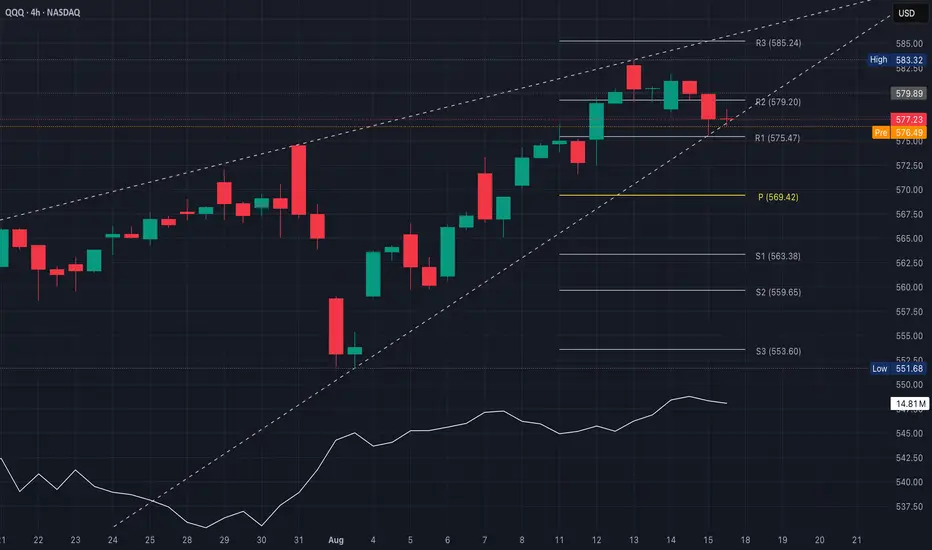
QQQ Holding StrongQQQ is holding strong this week above key moving averages, supported by ST bullish setups that look appealing, but it's important to watch for overbought signals & broader macro triggers for confirmation or caution
If QQQ pushes above $580 with conviction, the path toward $586–$589 looks paved; especially, if heavyweights like NVDA, AAPL, or MSFT continue to lead
With the strong trends, using short-dated call setups (within 1–2 weeks) could capitalize on momentum, but keep risk due to time decay in mind
A dip to the 50d MA (~$554) could offer a higher-probability entry zone; especially, if broader market sentiment remains constructive
A breach below $540 & a move toward the 200d MA (~$515) would likely signal a deeper correction or trend shift
RSI nearing overbought levels means gains could slow or reverse without fresh catalysts & with Fed sentiment in focus (Powell's Jackson Hole speech), a dovish or hawkish tone could significantly sway prices (markets could swing down if investor expectations aren’t met)
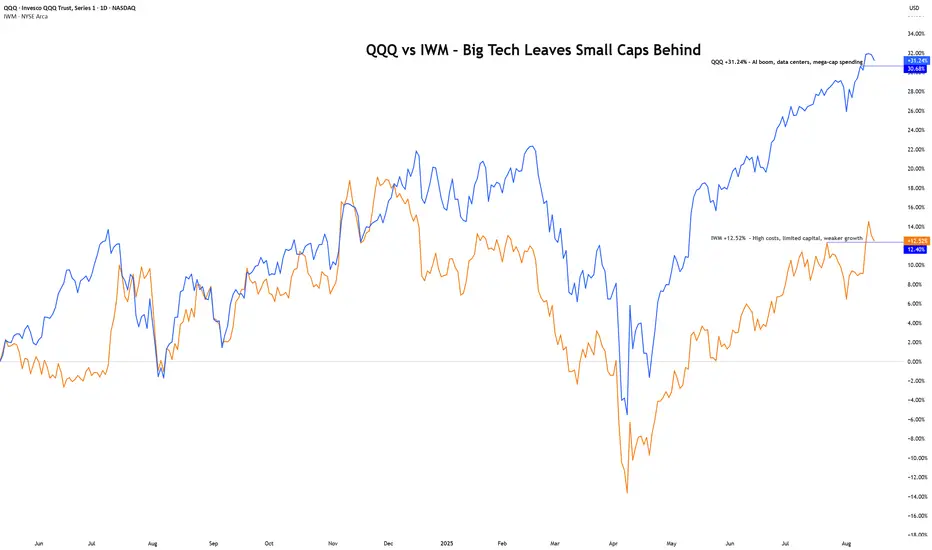
QQQ vs IWM – Big Tech Leaves Small Caps BehindQQQ +31% YTD - AI boom, cloud demand, mega-cap strength.
IWM +12% YTD - Higher costs, weak margins, slower growth.
The gap is widening.
Breakouts in QQQ = more upside potential.
IWM struggling near resistance, small caps lagging.
Watch if rate cuts spark a small-cap catch-up, or if Big Tech continues to lead into 2026.
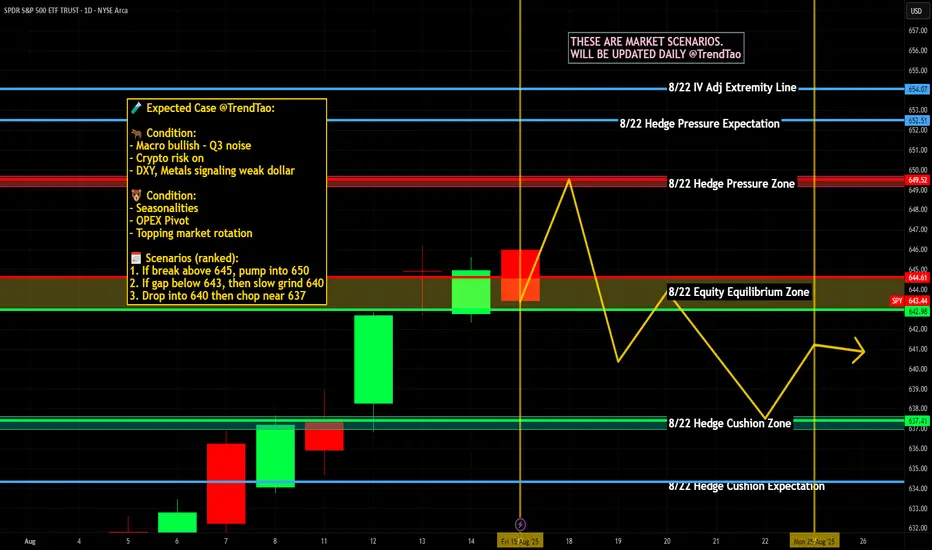
Weekly $SPY / $SPX Scenarios for August 18–22, 2025🔮 Weekly AMEX:SPY / SP:SPX Scenarios for August 18–22, 2025 🔮
🌍 Market-Moving News 🌍
🏔️ Jackson Hole (Thu–Sat): Chair Powell headlines the Kansas City Fed symposium—path-of-rates + growth vs. inflation = front-page risk for AMEX:SPY SP:SPX TVC:DXY $TLT.
📝 FOMC Minutes (Wed): Deeper read on July meeting dissents and tariff/inflation views—rate-cut odds in play.
🛒 Retail Heavyweights: Earnings updates from NYSE:WMT NYSE:HD NYSE:TGT NYSE:LOW NASDAQ:ROST = real-time consumer pulse for AMEX:XRT and broader risk tone.
🏠 Housing Check: Starts/Permits + Existing Home Sales frame construction demand and affordability; watch AMEX:XHB and long rates.
📊 Key Data Releases & Events (ET) 📊
📅 Tue, Aug 19
• Housing Starts & Building Permits (8:30 AM)
📅 Wed, Aug 20
• FOMC Minutes (July meeting) (2:00 PM)
📅 Thu, Aug 21
• Initial Jobless Claims (8:30 AM)
• Philly Fed Manufacturing Index (8:30 AM)
• S&P Global Flash PMIs (Mfg/Services) (9:45 AM)
• Existing Home Sales (Jul) (10:00 AM)
• Conference Board Leading Index (10:00 AM)
• Jackson Hole Symposium begins (all day; speeches through Sat)
📅 Fri, Aug 22
• No major U.S. releases (focus: Jackson Hole headlines + positioning)
⚠️ Disclaimer: Educational/informational only — not financial advice.
📌 #trading #stockmarket #economy #Fed #FOMC #JacksonHole #housing #PMI #retailsales #SPY #SPX #DXY #TLT #XHB #XRT
QQQ: Bears Will Push Lower
Remember that we can not, and should not impose our will on the market but rather listen to its whims and make profit by following it. And thus shall be done today on the QQQ pair which is likely to be pushed down by the bears so we will sell!
Disclosure: I am part of Trade Nation's Influencer program and receive a monthly fee for using their TradingView charts in my analysis.
❤️ Please, support our work with like & comment! ❤️
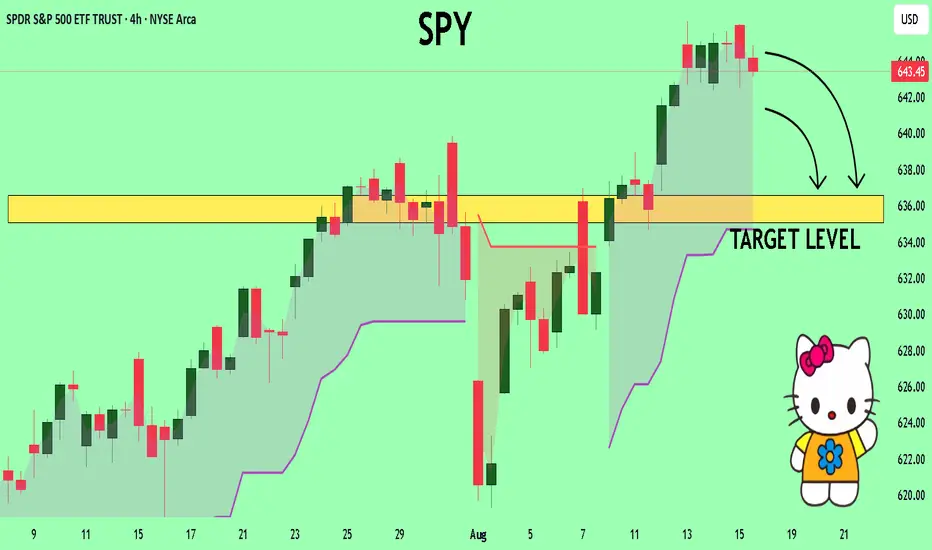
SPY Technical Analysis! SELL!
My dear followers,
This is my opinion on the SPY next move:
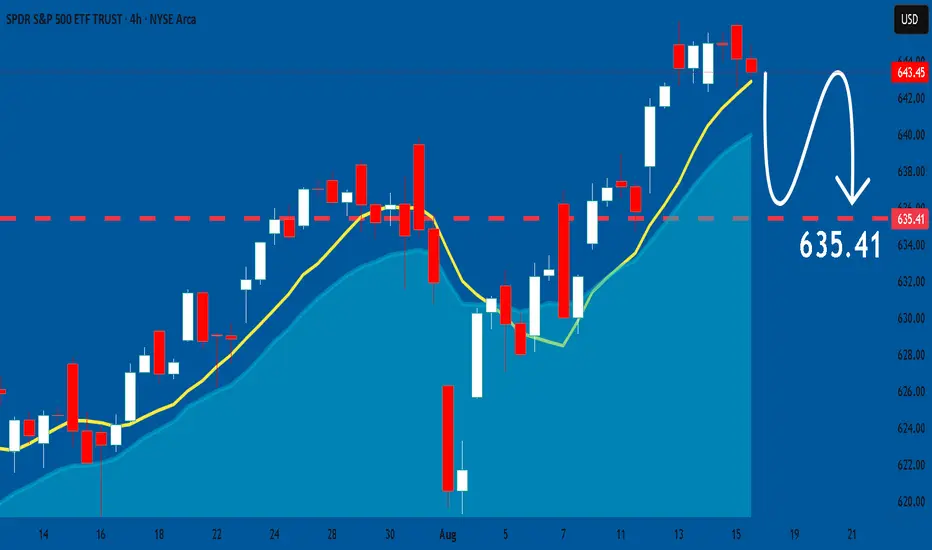
The asset is approaching an important pivot point 643.45
Bias - Bearish
Technical Indicators: Supper Trend generates a clear short signal while Pivot Point HL is currently determining the overall Bearish trend of the market.
Goal - 636.56
About Used Indicators:
For more efficient signals, super-trend is used in combination with other indicators like Pivot Points.
Disclosure: I am part of Trade Nation's Influencer program and receive a monthly fee for using their TradingView charts in my analysis.
———————————
WISH YOU ALL LUCK
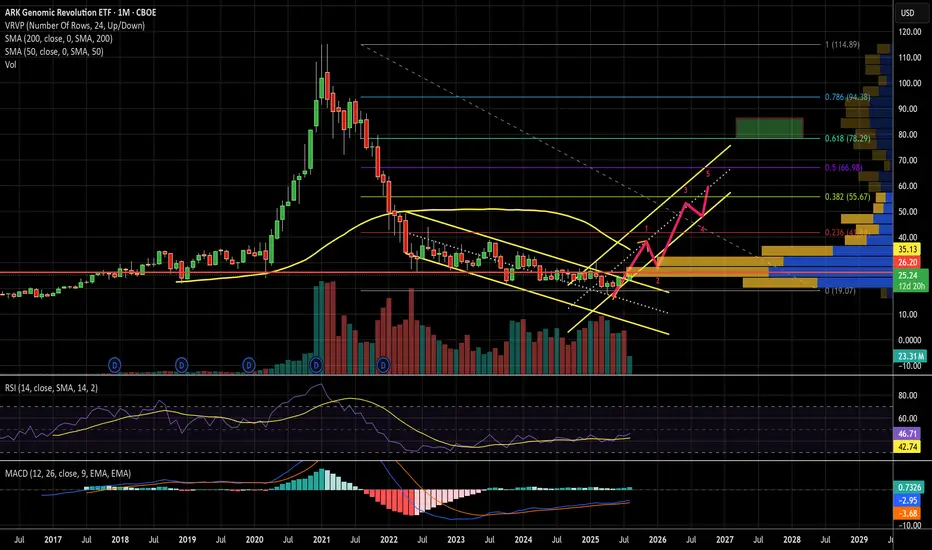
$arkgyieahh
a lot of pharma and bio pharma companies looking good, taking a dab at this one.
at all of ifs, policies, rates.
enough is enough consolidating.
MACD approaching 0 level, there we should see good momentum.
RSI nearing 50.
Price at a big volume shelf right now.
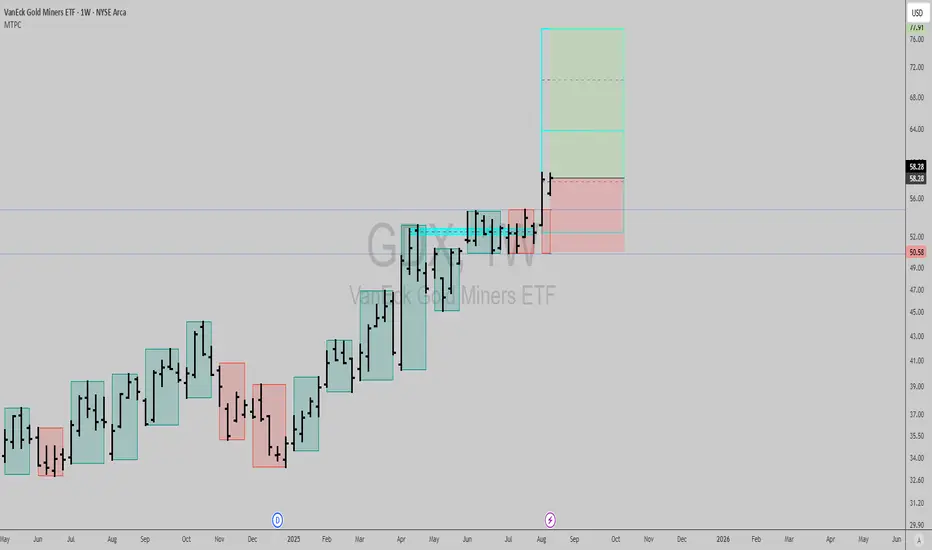
Gold miners: Low risk buy signalGN gents, miners are offering a very appealing entry here, I believe it is probably a wise position to put on to capitalize on the recent weakness in the yellow metal reversing possibly.
Best of luck!
Cheers,
Ivan Labrie.
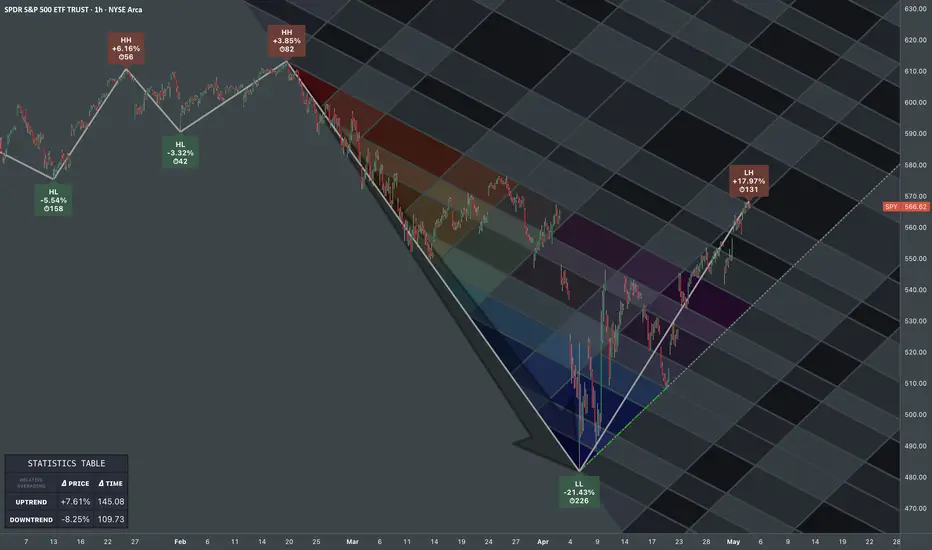
SP500 ETF: Fibonacci MappingAs you may know, Williams Fractals indicator identifies potential reversal points by marking a high (or low) surrounded by two lower highs (or higher lows) on each side, forming a five-bar pattern that signals possible turning points in price. Unfortunately, the simplicity of such indicator provides just tiny perspective, undermining broad implication of the concept.
Before I begin diving into processing geometric narrative of emerging price via fibonacci channels, I want to explain how I interpret fractals.
When I use the term "fractal", I'm not just talking about the points alone. Market continuously corrects itself, so analyzing it by price alone can bring more confusion than help. The object of observation shouldn't be limited to quantifying just by a single property. Chaos by default requires awareness from both price and time aspects. The easiest way to root it in my vision was through realization that price is a function of trading time intervals. Its activity can be described as cyclical progression, as if it is wired by multiple "springs" of different tensions.
Classic TA patterns known to literally anyone are great for anticipating a move in surface level forecasts. Since my line of work focuses on prediction over forecasts, it requires deeper structural awareness behind complex oscillations.
Let's observe the way selloff scales from ATH and how it impacts fractal hierarchy.
The first corrective bullish wave can be explained as a reaction to initial impulsive bearish wave. The bigger scale drop from ATH to a lower point explains why the corrective bullish wave looks the way it is. And so on:
In fractals, scaling laws describe how key properties change with size, typically following power-law relationships that reflect the structure’s self-similarity, where a characteristic scales with the size raised to an exponent.
To build a probabilistic model, we must keep in mind how the smaller bits make up bigger scale picture. ATH, established bottom and angle of progression defined by pullback highs, all those points have structural weight. Since psychology of masses that shapes price dynamics is governed by mathematical sequences found in nature, it's fair to use Fibonacci Channels to map the geometry of interconnectedness.
Similarly, all of those points can be referred by another fibonacci channel with opposite direction.
From my perspective, traditional TA patterns reflect just phases of cycle, this is why I unify those fragments into broader scalable shapes. This distinctive branch of Fractal Analysis allows to track systematic aspects of market behavior and explains how a pattern replicates itself in rhythmic continuity.
Stock Market Forecast | TSLA NVDA AAPL AMZN META MSFTQQQ CME_MINI:NQ1! CME_MINI:ES1! stock market Forecast
Nvidia Stock NASDAQ:NVDA Forecast
Apple Stock AAPL Forecast
Microsoft Stock MSFT Forecast
Google Stock GOOGL Forecast
Amazon Stock AMZN Forecast
Meta Forecast Technical Analysis
Tesla Stock NASDAQ:TSLA Forecast
Magnificent 7 stocks forecast

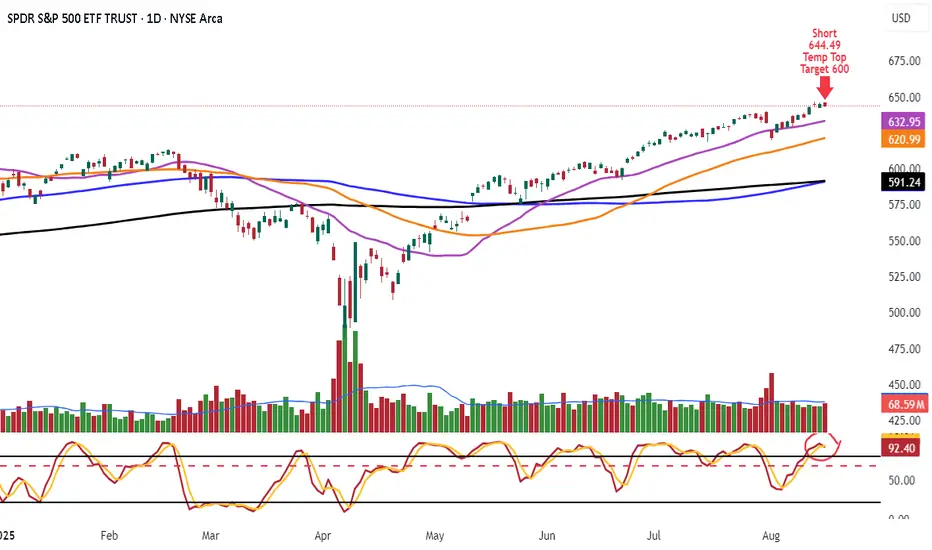
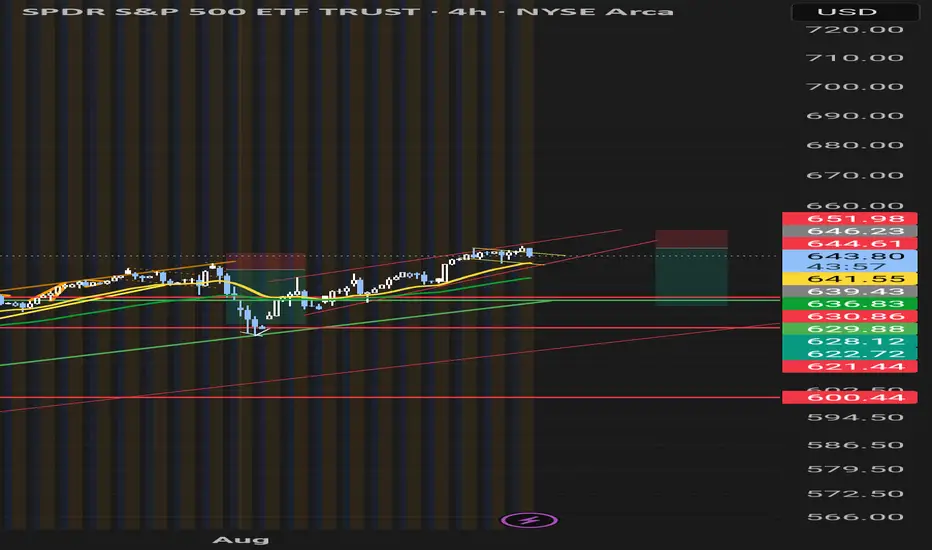
Shorted SPY 644.49 looking for 5-10 % Pull Back say 600 Looking for small pull back then test highs
look daily stoch trying roll over
look all that selling to buying
also look XLF IWM SMH QQQ starting weaken
We still un up trend just pull back possibly
SPY: Will Keep Falling! Here is Why:
Balance of buyers and sellers on the SPY pair, that is best felt when all the timeframes are analyzed properly is shifting in favor of the sellers, therefore is it only natural that we go short on the pair.
Disclosure: I am part of Trade Nation's Influencer program and receive a monthly fee for using their TradingView charts in my analysis.
❤️ Please, support our work with like & comment! ❤️
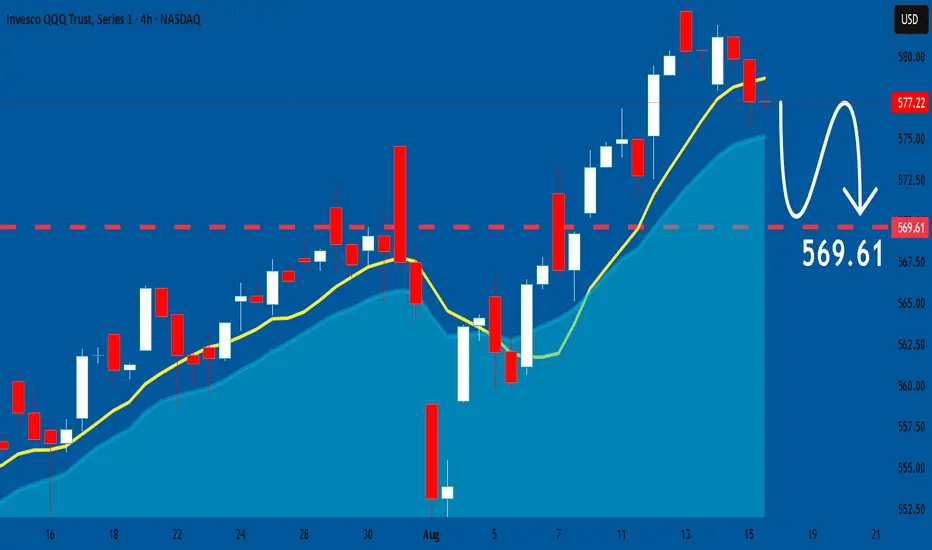
QQQ A Fall Expected! SELL!
My dear friends,
Please, find my technical outlook for QQQ below:
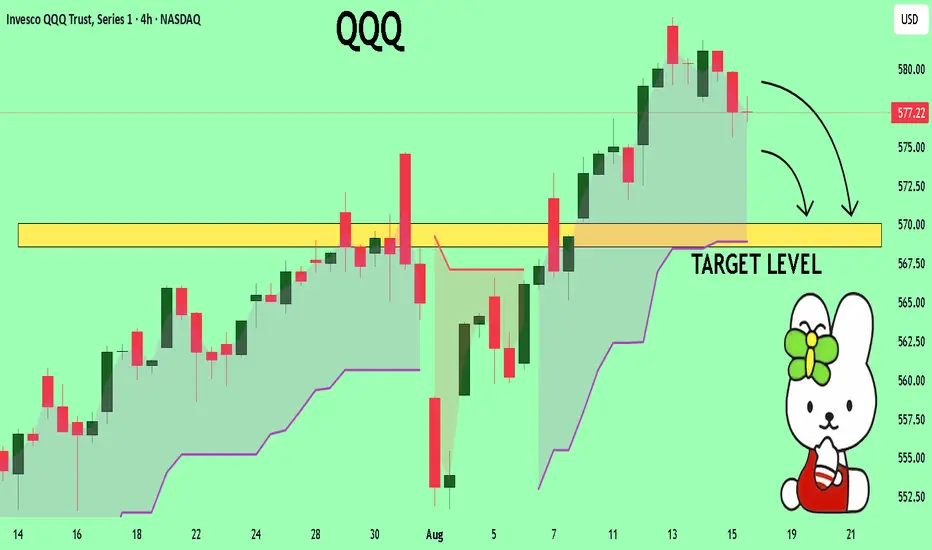
The instrument tests an important psychological level 577.22
Bias - Bearish
Technical Indicators: Supper Trend gives a precise Bearish signal, while Pivot Point HL predicts price changes and potential reversals in the market.
Target - 570.06
About Used Indicators:
Super-trend indicator is more useful in trending markets where there are clear uptrends and downtrends in price.
Disclosure: I am part of Trade Nation's Influencer program and receive a monthly fee for using their TradingView charts in my analysis.
———————————
WISH YOU ALL LUCK
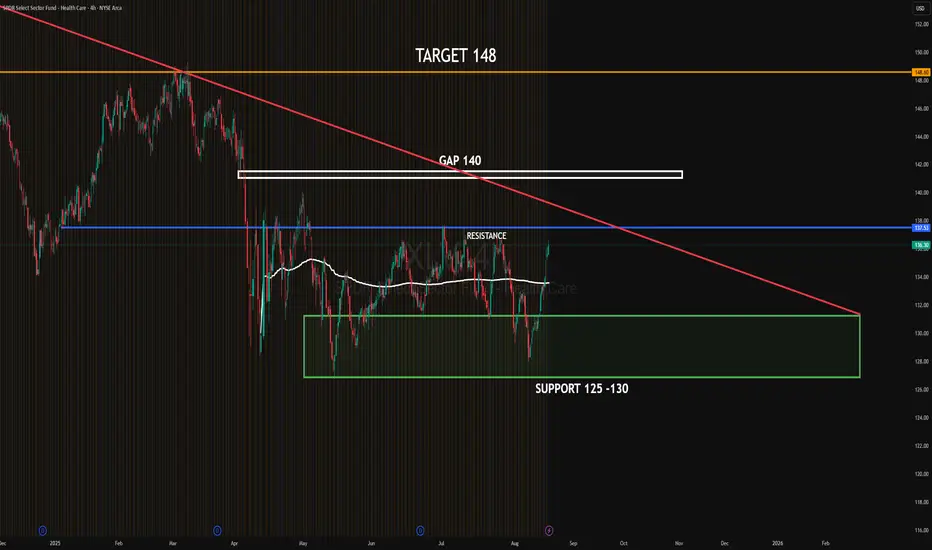
XLV HEALTH CARE SECTORSPDR Health Care Select Sector ETF ( AMEX:XLV ) is consolidating between strong support at 125–130 and resistance near 137.5. Institutional absorption is visible around support, while sellers are defending the 137–138 zone. A gap remains open at 140, which could act as a magnet if price breaks resistance.
Upside target: 148 if the gap at 140 is filled and momentum extends.
Downside target: 125–130 if rejection at resistance holds.
#XLV #globaltrade #investment #investing #stockmarket #wealth #realestate #markets #economy #finance #money #forex #trading #price #business #currency #blockchain #crypto #cryptocurrency #airdrop #btc #ethereum #ico #altcoin #cryptonews #Bitcoin #ipo
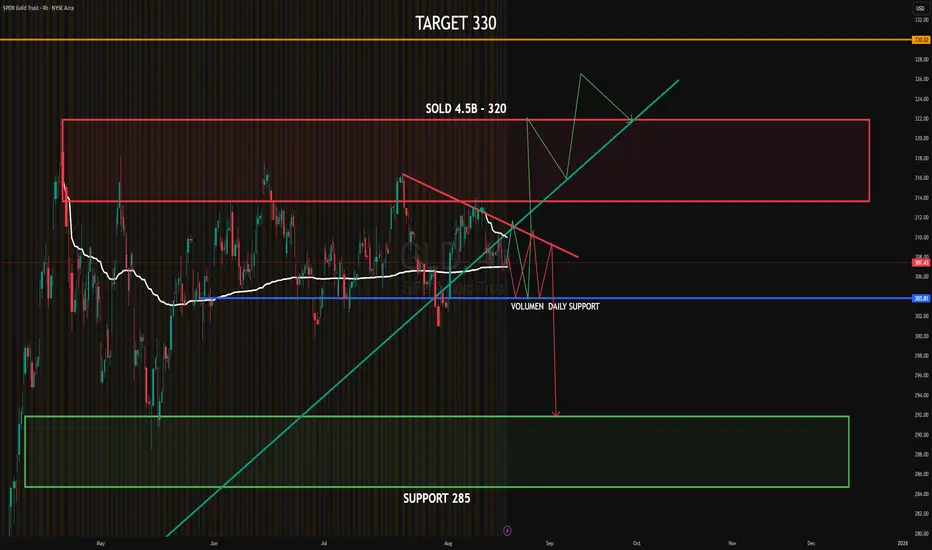
GLD - AUG 2025SPDR Gold Trust ( AMEX:GLD ) continues consolidating under heavy supply after $4.5B sold near 320. Price is defending daily support at 304, but momentum remains fragile. A sustained break above 320 would open the path to 330, while losing 304 risks a drop toward the 285 support zone.
Upside target: 330
Downside target: 285
#GLD #globaltrade #investment #investing #stockmarket #wealth #realestate #markets #economy #finance #money #forex #trading #price #business #currency #blockchain #crypto #cryptocurrency #airdrop #btc #ethereum #ico #altcoin #cryptonews #Bitcoin #ipo
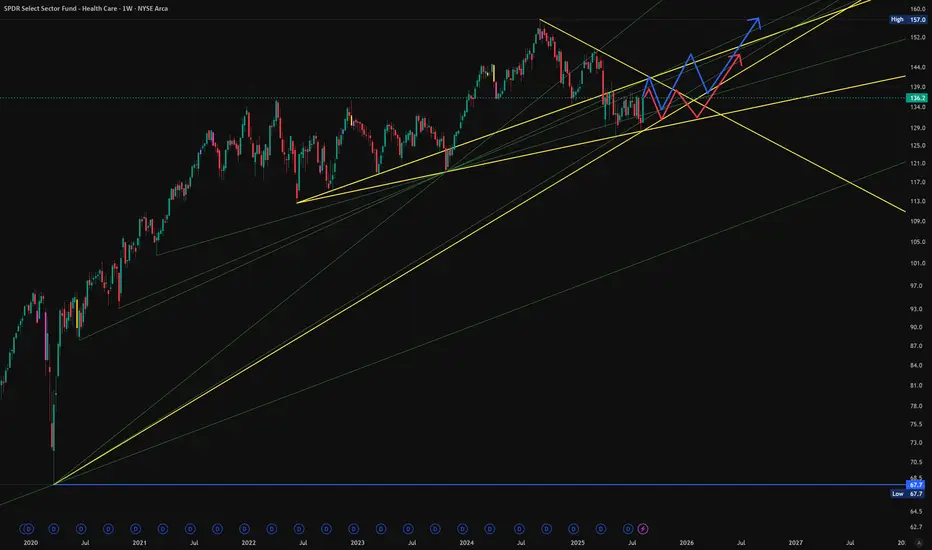
XLV, Healthcare
Swing trading or Buy the dip like installment savings.
But always check the support slope line.
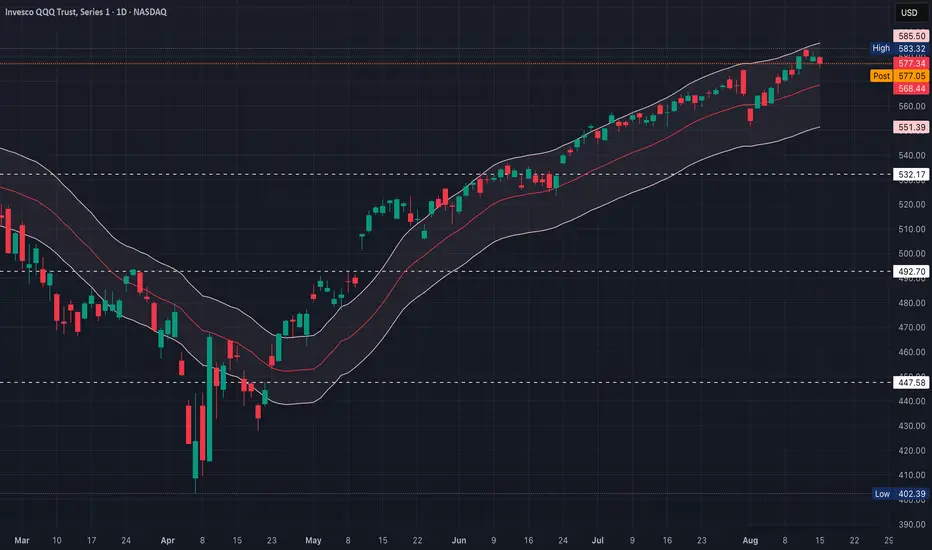
QQQ (15 August)Approximately 56.4% of the QQQ stocks are trading above their 50d MA & about 66.3% are trading above their 200d MA
These levels indicate a moderately positive near-term trend with just over half of the constituents are in ST uptrends, suggesting reasonable participation, though it's not a runaway bullish signal
A strong LT trend presence with two-thirds of stocks are in LT uptrends, supporting constructive structural strength beneath QQQ
These numbers suggest that while participation is positive, it's not extreme
If QQQ continues higher, it’s worth watching whether the 50d breadth climbs further (strengthening the breakout thesis)
If QQQ rallies, but fewer constituents join (50d breadth stalls or reverses), that could be a red flag for sustainability
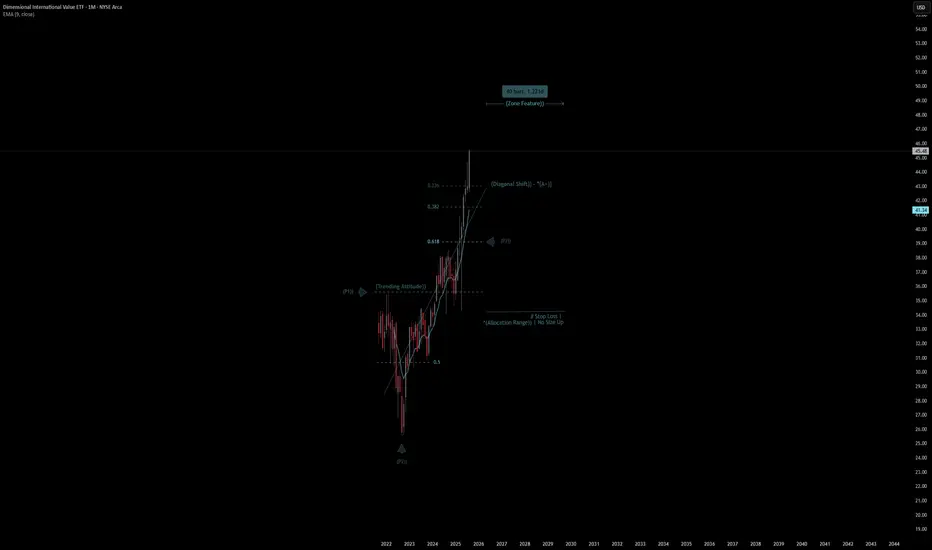
Dimensional International Value ETF | Chart & Forecast SummaryKey Indicators On Trade Set Up In General
1. Push Set Up
2. Range Set Up
3. Break & Retest Set Up
Notes On Session
# Dimensional International Value ETF
- Double Formation
* (Trending Attitude)) At 35.00 USD | Subdivision 1
* (Diagonal Shift)) - *(A+)) | No Size Up | Completed Survey
* 40 bars, 1221d | Date Range Method - *(Uptrend Argument))
- Triple Formation
* (P1)) / (P2)) & (P3)) | Subdivision 2
* Monthly Time Frame | Trend Settings Condition | Subdivision 3
- (Hypothesis On Entry Bias)) | Regular Settings
* Stop Loss Feature Varies Regarding To Main Entry And Can Occur Unevenly
- Position On A 1.5RR
* Stop Loss At 37.00 USD
* Entry At 41.00 USD
* Take Profit At 47.00 USD
* (Uptrend Argument)) & No Pattern Confirmation
- Continuation Pattern | Not Valid
- Reversal Pattern | Not Valid
* Ongoing Entry & (Neutral Area))
Active Sessions On Relevant Range & Elemented Probabilities;
European-Session(Upwards) - East Coast-Session(Downwards) - Asian-Session(Ranging)
Conclusion | Trade Plan Execution & Risk Management On Demand;
Overall Consensus | Buy
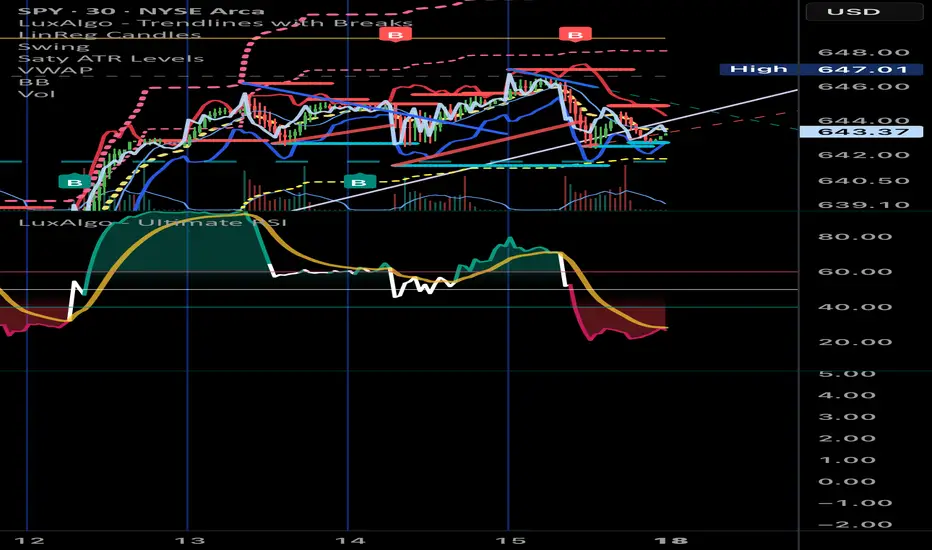
Well here we are! So far its doing exactly what it always does. Spy has the least imaginative algorithm, 3-6-9. Here is the pullback I mention at the end of the first cycle of 3 reoccurring patterns.
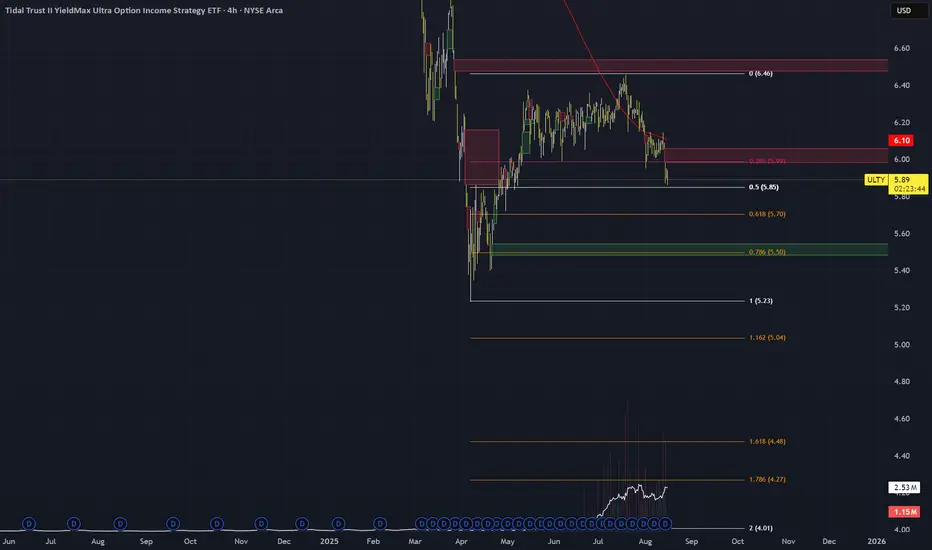
ULTY to continue downtrend to 4.48
In such a clear and obvious downtrend, it will hit 4.48
As investors you hope that the dividends will be more then the drop, but I believe otherwise
Lots of retail traders will get hurt on this one...it should not be DRIP'd or bought with margin
Some just need to learn the hard way...
SCHD and chill.