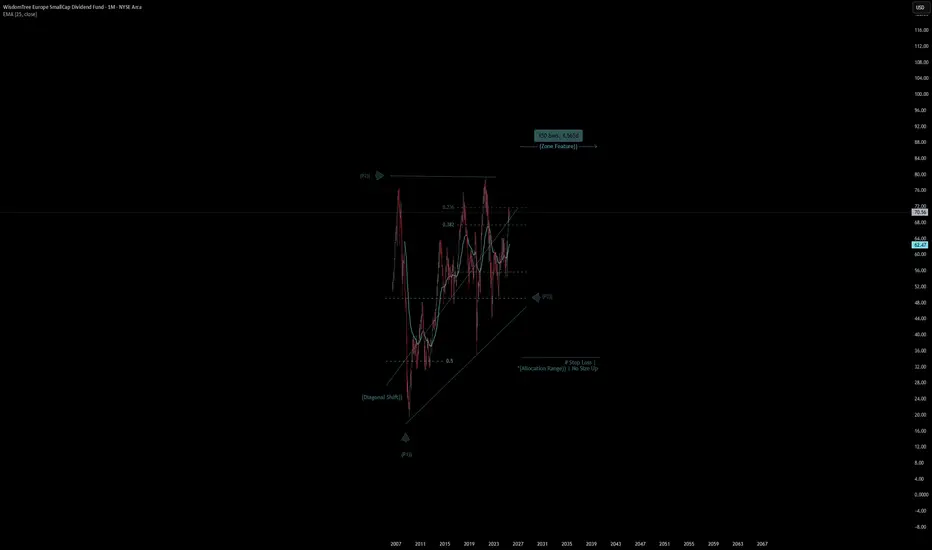
WisdomTree Europe SmallCap | Chart & Forecast SummaryKey Indicators On Trade Set Up In General
1. Push Set Up
2. Range Set Up
3. Break & Retest Set Up
Notes On Session
# WisdomTree Europe SmallCap Quote
- Double Formation
* (Diagonal Shift)) At 25.00 USD | Subdivision 1
* Stop Loss - *(Allocation Range)) | No Size Up | Completed Survey
* 150 bars, 4565d | Date Range Method - *(Uptrend Argument))
- Triple Formation
* (P1)) / (P2)) & (P3)) | Subdivision 2
* Monthly Time Frame | Trend Settings Condition | Subdivision 3
- (Hypothesis On Entry Bias)) | Regular Settings
* Stop Loss Feature Varies Regarding To Main Entry And Can Occur Unevenly
- Position On A 1.5RR
* Stop Loss At 58.00 USD
* Entry At 70.00 USD
* Take Profit At 88.00 USD
* (Uptrend Argument)) & No Pattern Confirmation
- Continuation Pattern | Not Valid
- Reversal Pattern | Not Valid
* Ongoing Entry & (Neutral Area))
Active Sessions On Relevant Range & Elemented Probabilities;
European-Session(Upwards) - East Coast-Session(Downwards) - Asian-Session(Ranging)
Conclusion | Trade Plan Execution & Risk Management On Demand;
Overall Consensus | Buy
ETF market
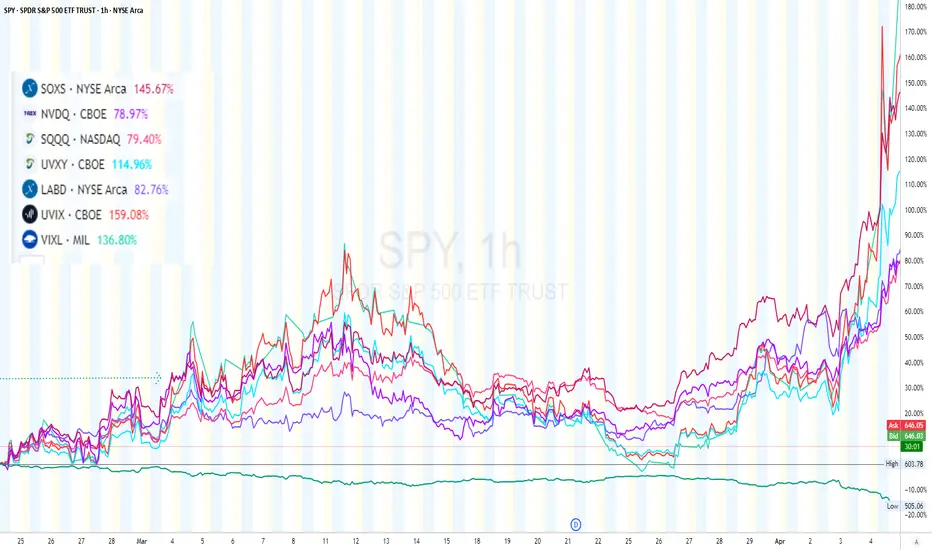
These ETFs Printed$$ During the Q1 Tariffs Crash!!!📉 **These ETFs Print$$ When the Market Panics** 💰
While most investors were panicking during the **Q1 Trump's tariffs-induced dump**, savvy traders were riding these **inverse & volatility ETFs** all the way up. 💥
🚨 **Top Crash-Performers:**
1. **UVIX** – +159% ⚠️
2. **SOXS** – +145.6% 🧨
3. **VIXL** – +136.8% 📈
4. **UVXY** – +114.9% 🌀
5. **LABD** – +82.7%
6. **NVDQ** – +78.9%
7. **SQQQ** – +79.4%
Meanwhile, SPY was getting nuked. If you were long tech, you felt it. But if you were positioned in these **crash-mode ETFs**, you were **printing green in a sea of red**.
🧠 **Crash Alpha is Real — If You’re Ready**
Here’s how real traders rotate:
🔁 March: Load volatility & inverse ETFs
📈 April: Rotate into high beta recovery plays (ROBN, ETHU, etc.)
💰 Strategy: **Don’t marry bias — marry price action.**
💡 *Crash-mode ETFs are not just protection — they're a profit weapon.*
🔥 **“You don’t need to predict the market — just be prepared when it moves.”** – Mark Minervini
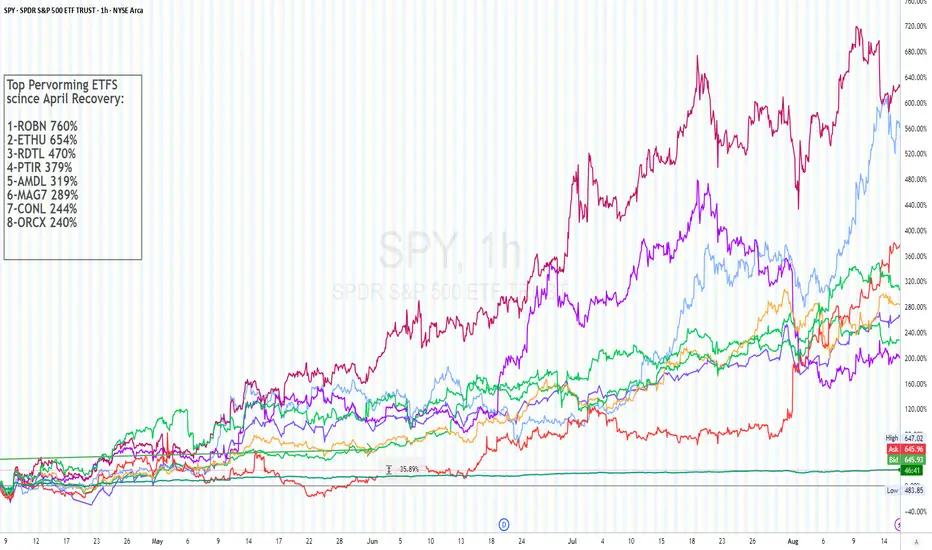
Gear up for next Crash.!!!!! Top Performing ETFs Since the April
📈 **Top Performing ETFs Since the April Recovery** 💥
*(Post-Tariffs Crash Rebound )*
After the **pre-April tariffs crash** rattled the markets, smart money rotated fast — and a new bull cycle kicked off in **early April**. While the broader market (SPY) clawed back a respectable +25%, these ETFs went **parabolic**:
🔝 **Top Gainers Since the April Recovery:**
1. **ROBN** – ⚡️+760%
2. **ETHU** – 🔥+654%
3. **RDTL** – 🚀+470%
4. **PTIR** – 🚀+379%
5. **AMDL** – +319%
6. **MAG7** – +289%
7. **CONL** – +244%
8. **ORCX** – +240%
These names have ridden the waves of AI, crypto, robotics, and mega-cap tech — leaving lagging sectors in the dust. If you caught any of these runs, you’ve been **printing gains**.
🔮 **But Don’t Get Too Comfortable…**
The market has a **short memory** — and parabolic moves often end with vertical drops. Inflation's still sticky, rate cuts are uncertain, and Q4 is historically volatile.
📌 **Get Ready for the the Next Crash:**
* Lock in profits ✅
* Raise cash — dry powder is your edge when panic returns 💥
🧠 *"In bull markets, money is made. In bear markets, wealth is preserved."* –
🚨 **Gear up now — the next crash is a reset, not a surprise.**
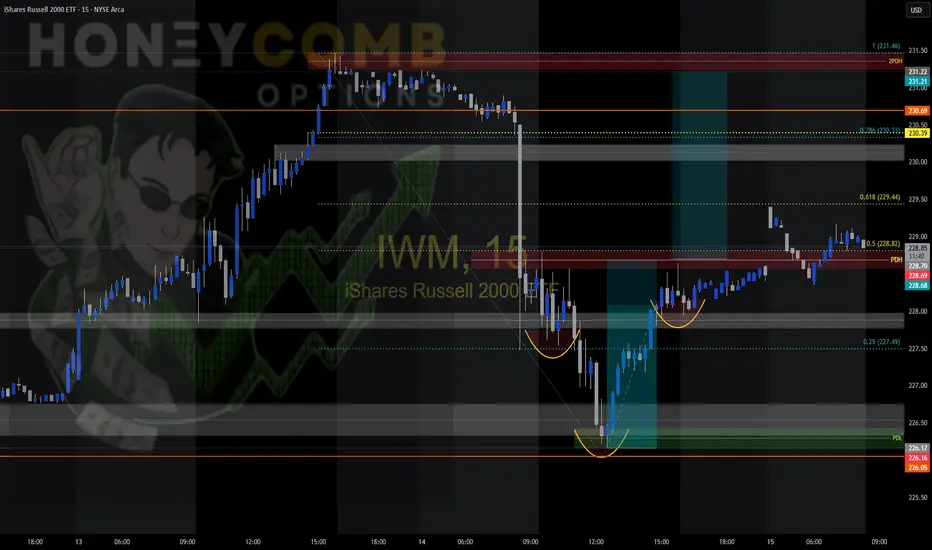
IWM Day Trading chart with INV H&S PatternYesterday IWM formed an INV H&S pattern that is confirmed, and it retested the entry. Please wait until after opening and confirmation of direction to take the trade.
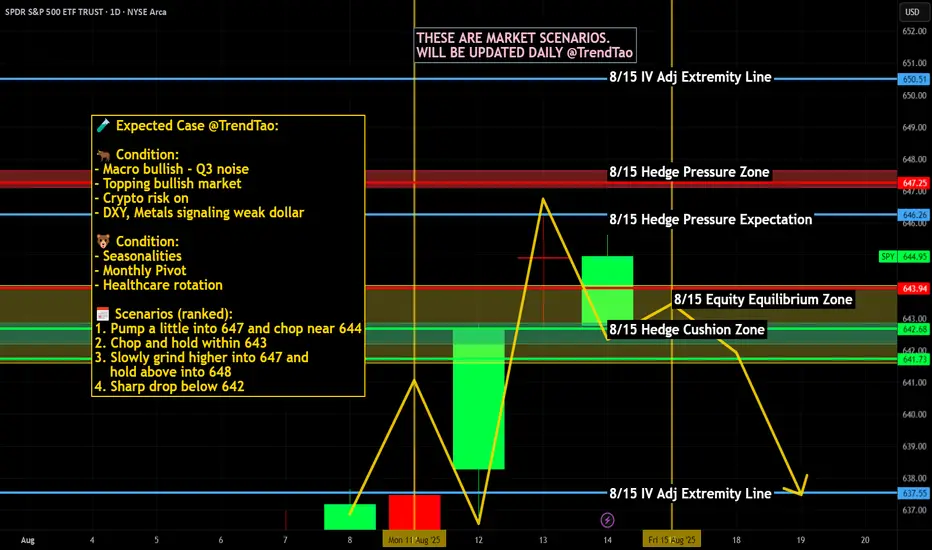
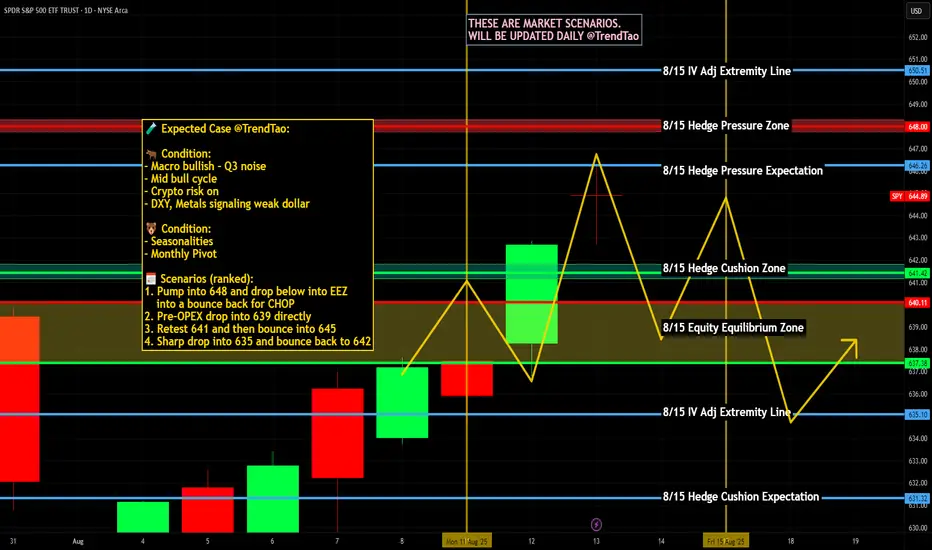
Nightly $SPY / $SPX Scenarios for August 15, 2025🔮 Nightly AMEX:SPY / SP:SPX Scenarios for August 15, 2025 🔮
🌍 Market-Moving News 🌍
🔥 PPI Shock Keeps Cuts in Question — July producer prices +0.9% m/m (largest in ~3 yrs) with broad gains in goods & services. Rate-cut odds pared; watch front-end yields, TVC:DXY , NASDAQ:TLT , and cyclicals.
💵 Dollar Firmer, Gold Softer — The hot PPI print lifted the dollar; gold is set for a weekly dip as hopes for a big cut fade.
📊 Key Data Releases & Events (ET) 📊
📅 Friday, Aug 15
8:30 AM — Retail Sales (July); Retail Sales ex-Autos.
8:30 AM — NY Fed Empire State Manufacturing (Aug).
8:30 AM — Import & Export Price Indexes (July).
9:15 AM — Industrial Production & Capacity Utilization (July).
10:00 AM — Business Inventories (June).
10:00 AM — Univ. of Michigan Consumer Sentiment (Prelim, Aug).
⚠️ Disclaimer: Educational/informational only — not financial advice.
📌 #trading #stockmarket #economy #retailsales #EmpireState #industrialproduction #MichiganSentiment #SPY #SPX #DXY #TLT
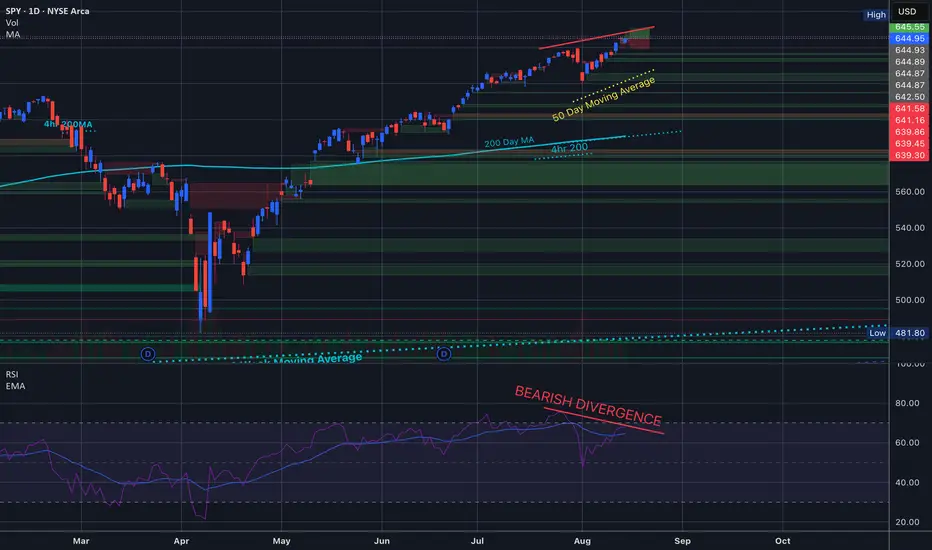
Here is what Im thinking for SPY.US Second rising B wedge that will turn into a downward channel with a break out to the upside prior to the drop. What do yall think, Yay or Nay?
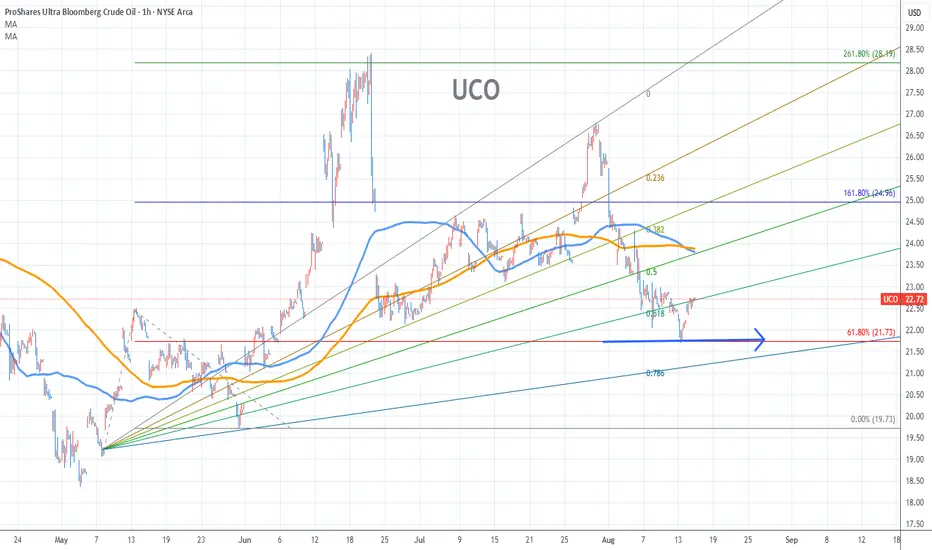
UCO Stock Chart Fibonacci Analysis 081425Trading Idea
1) Find a FIBO slingshot
2) Check FIBO 61.80% level
3) Entry Point > 21.7/61.80%
Chart time frame:B
A) 15 min(1W-3M)
B) 1 hr(3M-6M)
C) 4 hr(6M-1year)
D) 1 day(1-3years)
Stock progress:C
A) Keep rising over 61.80% resistance
B) 61.80% resistance
C) 61.80% support
D) Hit the bottom
E) Hit the top
Stocks rise as they rise from support and fall from resistance. Our goal is to find a low support point and enter. It can be referred to as buying at the pullback point. The pullback point can be found with a Fibonacci extension of 61.80%. This is a step to find entry level. 1) Find a triangle (Fibonacci Speed Fan Line) that connects the high (resistance) and low (support) points of the stock in progress, where it is continuously expressed as a Slingshot, 2) and create a Fibonacci extension level for the first rising wave from the start point of slingshot pattern.
When the current price goes over 61.80% level , that can be a good entry point, especially if the SMA 100 and 200 curves are gathered together at 61.80%, it is a very good entry point.
As a great help, tradingview provides these Fibonacci speed fan lines and extension levels with ease. So if you use the Fibonacci fan line, the extension level, and the SMA 100/200 curve well, you can find an entry point for the stock market. At least you have to enter at this low point to avoid trading failure, and if you are skilled at entering this low point, with fibonacci6180 technique, your reading skill to chart will be greatly improved.
If you want to do day trading, please set the time frame to 5 minutes or 15 minutes, and you will see many of the low point of rising stocks.
If you want to prefer long term range trading, you can set the time frame to 1 hr or 1 day.
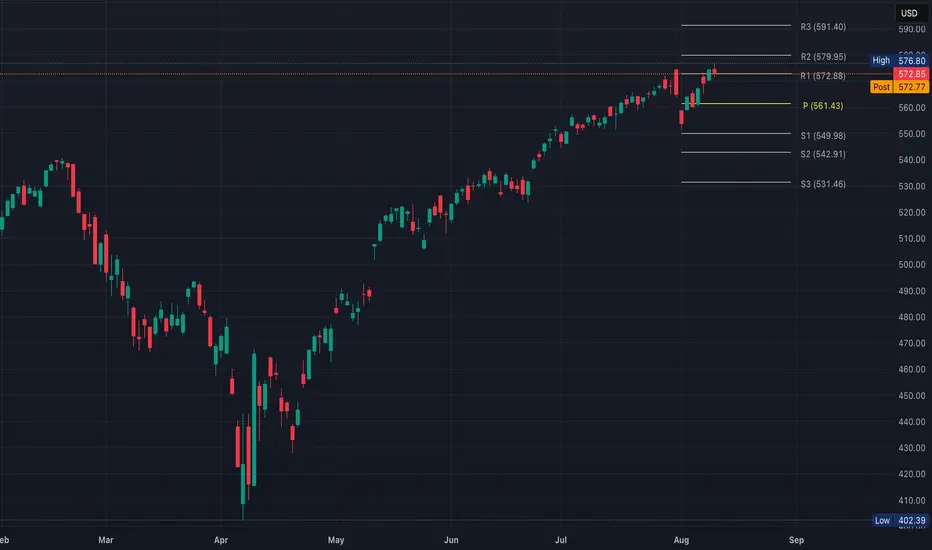
QQQ Closes @ R1QQQ closed right at the first level of resistance after August's disappointing NFP
A move up to $574 tomorrow that holds greatly weakens the bear thesis
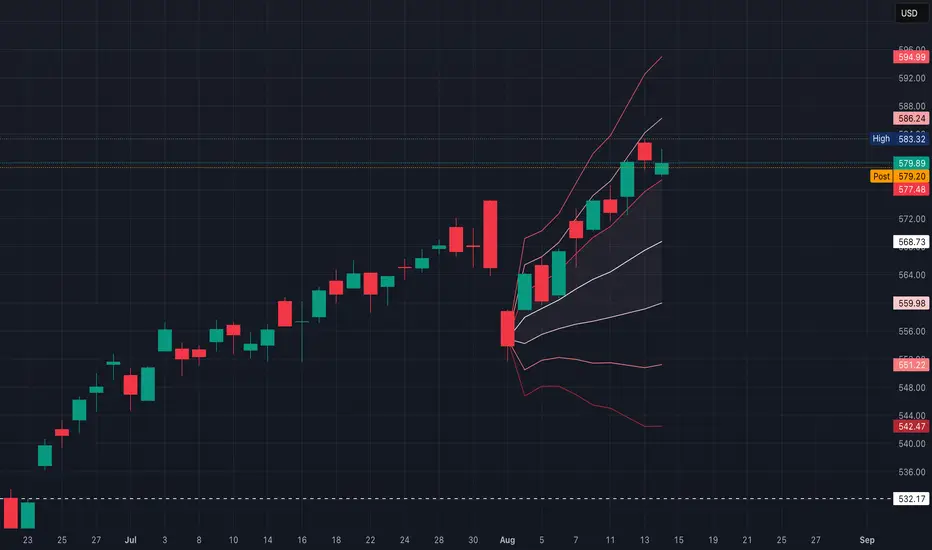
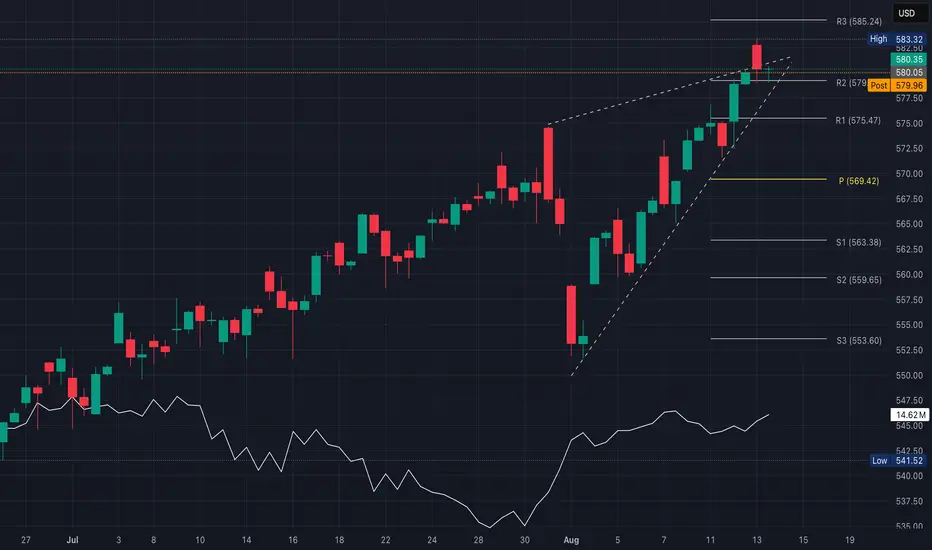
QQQ Hesitation @ $580Given the tight range, expect either a fast breakout or quick rejection tomorrow (watch first 15 min volume — if it’s weak, false moves are more likely)
Bullish:
Short scalp: $582C or $585C (same week expiry)
Swing: $587C or $590C (1–2 wks out)
Stop-loss under $580 after breakout attempt
Bearish:
Scalp: $578P or $575P
Swing: $570P for main target, $565P if looking for deeper flush
Stop-loss above $580 after breakdown attempt
PSIL healthy daily sideways consolidationWatching this tightening range on PSIL for clues to see if weekly consolidation will begin or if it is just basing and consolidating gains before another leg higher

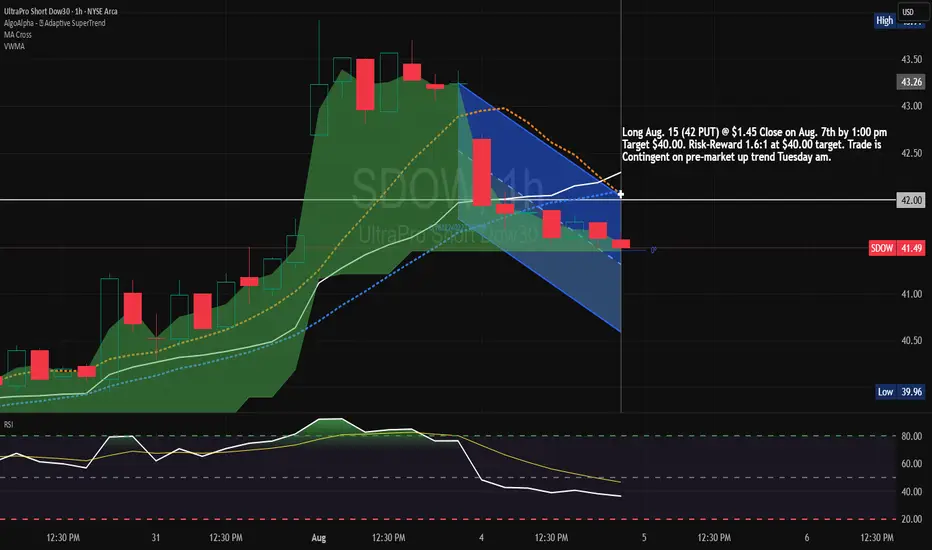
Long Aug. 15 $42 PUT on SDOW @ $1.45. Close by 1:00 pm Aug. 7th tradingview.sweetlogin.com
This trade has a Risk-Reward of 1.6:1 at the $40 target. Will close the trade in 2 days to avoid THETA Crush.
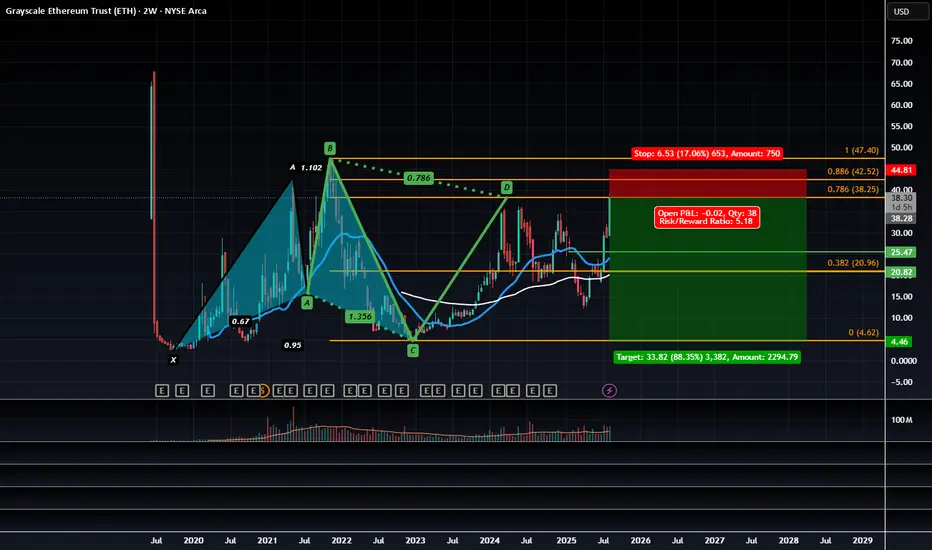
The Grayscale Ethereum Trust at Risk of Exacerbated DeclineETPs such as Grayscale's ETHE here utilizes APs (Authorized Participants) which are essentially broker dealers and large financial institutions such as banks, hedge funds and other investment firms to maintain liquidity of the Exchange Traded Product. These APs capitalize on the spread between the ETHE shares and the underlying product, in this case Ethereum, to make a yield through arbitrage.
Put simply, if demand for ETHE begins to rises above current supply, Authorized Participants can create new shares by depositing actual ETH with Grayscale. In return, Grayscale grants the AP newly minted ETHE shares. The AP then is able to list these shares on the secondary market where retail traders can buy them.
Historically these APs were able to mint new ETHE through this process of depositing ETH to Grayscale but they weren't able to redeem their ETHE shares back to ETH, however with the very recent onset of In-kind redemption and creation being permitted by the SEC , we are more likely to see a huge shift in the trend of redemptions.
Now that the SEC has enabled these in-kind redemptions, we could see these APs opt to redeem their ETHE shares for ETH just so they could sell said ETH on the open market or use it as liquidity for privately negotiated block trades on CME futures market during times of stress.
Say if there were sudden inflationary shocks, bond yields rose, or we had systemic banking risks, or even margin risk due to the underperformance of other sectors these institutions may have exposure to, we would likely see them let go of their riskiest assets first before resorting to selling other assets such as stocks and equities, especially those within the defensive categories. This would put Grayscales ETPs in direct danger of collapse as they lose liquidity from their APs and more importantly so it would put these underlying assets at risk of significant decline as the APs continue redeeming, adding supply to the open market, and selling.
This would not only result in negative pressure being put on the underlying assets but will also most likely result in Grayscales ETPs falling a significant amount more than the underlying due to the drainage off liquidity and the resulting widening of spreads. Asa result I think the end game for a lot of these crypto adjacent ETPs and Stocks will be that they go bust especially the leveraged products even including stocks like MSTR which effectively act as a leveraged exposure ETF to Bitcoin. In spite of this negative view I do have some optimism for XRP but overall I am quite bearish on the crypto market and all of the adjacent products being created from it.
In short: ETH along with BTC, which started out to as something to separate itself from the fiat banking system is now completely integrated and at the mercy of the fiat banking system along with all the macroeconomic risks that come with it.
Technical Outlook for the Grayscale Ethereum ETP:
We have a Bearish 5-0 that is completing at the 0.786 retrace we've recently made higher highs but that was likely on the onset of the SEC news release from a couple days ago being interpreted at a bullish capacity, however as the news settles I think it will be more of a negative outcome and us trading to the PCZ off that news provides a good opportunity to sell call spreads and buy puts on ETHE here.
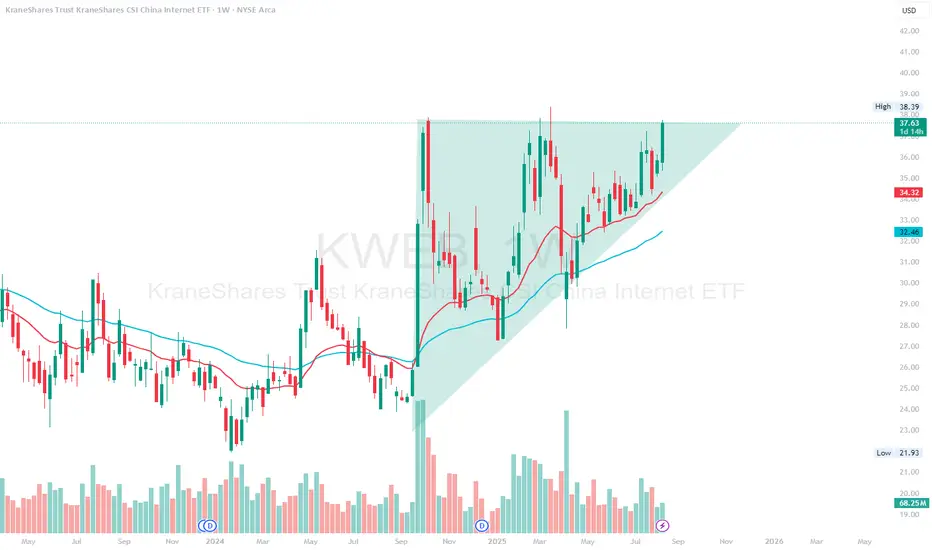
$KWEB - ascending triangle breakout patternKWEB - long term ascending triangle pattern forming on the weekly timeframe. $38 and $40 resistance level. long calls if those level breaks. stock looking strong
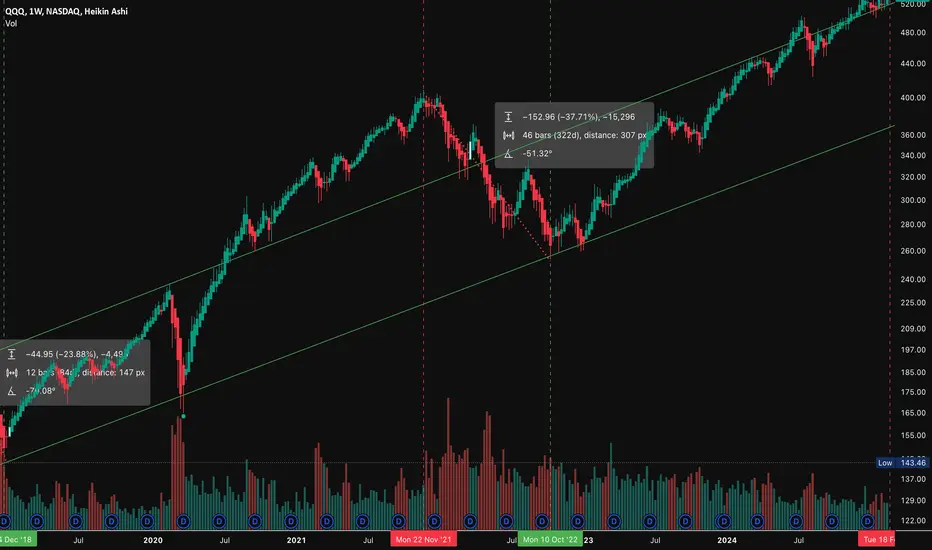
QQQ 3-Year Correction Overdue Since 2015 the Nasdaq Index has undergone approximately 25% corrections from all-time-highs every 3 years. Over this time period, the price has more or less respected the trend lines shown above. But perhaps a force more powerful than the trendline is the timeline.
The pattern repeats at roughly 39-month intervals from top to top:
May '12 - July '15 (1175 days)
pivot from 5/1/12 ATH, 12%* correction over 35 days
July '15 - October '18 (1170 days)
pivot from 7/20/15 ATH, 26% correction over 34 days
October '18 - November '21 (1148 days)
pivot from 10/1/18 ATH, 24% correction over 84 days
November '21 - February '25 (1176 days)
pivot from 11/22/21 ATH, 38%** correction over 324 days
February '25 - May '28
pivot from 2/18/25 ATH, ??% correction
If the pattern holds true, we were due a correction last week. My guess is we'll double-top December's ATH and then start the correction. How deep for how long is anyone's guess. Feels more like '21 insanity than '15 or '18 to me.
Notes:
*2012 (I believe) not yet representative of participation in the trendline pattern (still recovering from Great Recession)
**This particular correction was covid-anomolous (we were 24% above the channel already when we pivoted). This particular -38%, 324-day correction was more like 3-in-1: -22% in 97 days, -27% in 80 days, -24% in 59 days. You may get a better pattern predictor if you average the 3 moves, so -24% over 77 days. Alternatively, you can see it as two moves: an intial -22% move to bring it back within the channel, followed by a second -24% move to bring it to the bottom of the channel.
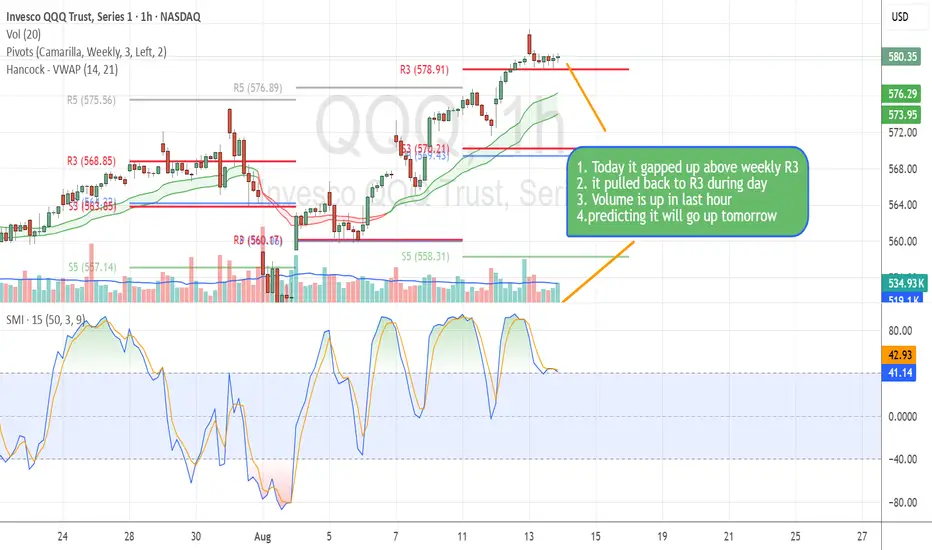
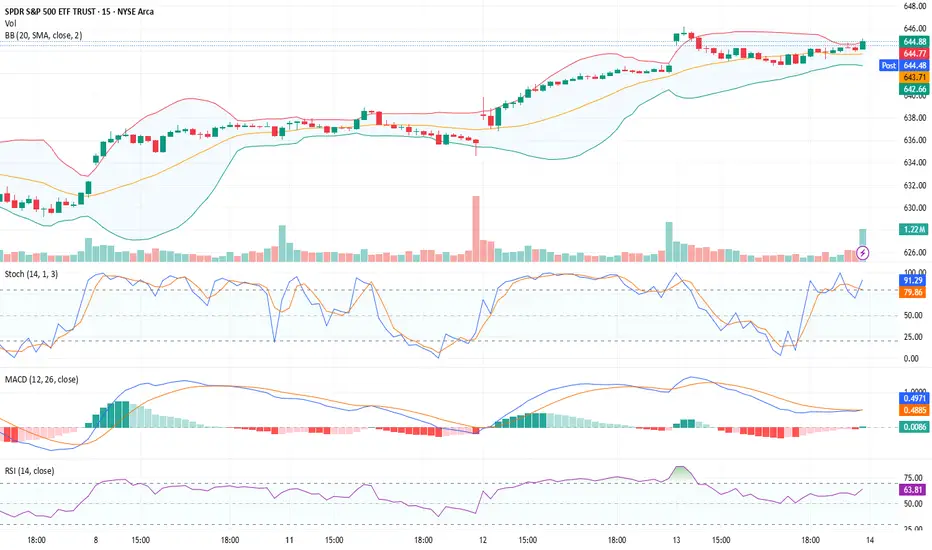
QQQ Price Action Recap & Tomorrow’s Outlook📈 QQQ Price Action Recap & Tomorrow’s Outlook
1. **QQQ opened with a gap above the weekly R3 pivot level**, signaling strong bullish momentum at the start of the day.
2. **It retraced intraday, testing R3 as support**, which held firmly through the session.
3. **R3 is now acting as a key support zone**, reinforcing the bullish bias.
4. **Volume picked up significantly in the final hour**, suggesting renewed buying interest.
5. **Based on current price action and momentum, I anticipate further upside tomorrow.**
📝 **Chart Notes:**
- I'm using **Camarilla weekly pivot levels** for reference.
- At the bottom of my chart, you'll find the **Stochastic Momentum Index**, which adds context to the trend strength and potential reversals.
Warning: This idea is published for educational purposes only. Please do your research before taking any position.
Nightly $SPY / $SPX Scenarios for August 14, 2025 🔮 Nightly AMEX:SPY / SP:SPX Scenarios for August 14, 2025 🔮
🌍 Market-Moving News 🌍
📉 CPI cooldown keeps cut odds alive — July CPI held at +0.2% m/m (2.8% y/y); Core +0.3% m/m (3.1% y/y) heading into today’s PPI. Watch $SPY/ SP:SPX vs TVC:DXY and NASDAQ:TLT for inflation momentum cues.
🤝 Tariff truce extended 90 days — U.S.–China pause now runs through Nov 10, removing near-term trade shock risk for NASDAQ:NVDA NASDAQ:AMD NASDAQ:AAPL and other SP:SPX heavyweights.
🇨🇳 China credit contraction — July new bank loans fell for the first time in 20 years, signaling weak demand and adding a global growth headwind to the tape.
📊 Key Data Releases & Events (ET) 📊
📅 Thu, Aug 14
• 8:30 AM — Initial Jobless Claims (week ending Aug 9)
• 8:30 AM — PPI (July) — Headline & Core
• 2:00 PM — Richmond Fed’s Tom Barkin speaks
⚠️ Disclaimer:
Educational/informational only — not financial advice.
📌 #trading #stockmarket #economy #CPI #PPI #Fed #SPY #SPX #DXY #TLT
QQQ Breakout or fake out?Wedge fakeouts often reverse sharply, so puts could pay fast if rejection holds
If QQQ closes above $580 with follow-through & volume, then R3 @ $585.24
Invalid if price breaks back below $578
If QQQ fails at wedge top and breaks below $576 (lower trendline), then R1 at $575.47 (could bounce here intraday)
Invalid if price breaks back above $578
The next couple of candles will decide
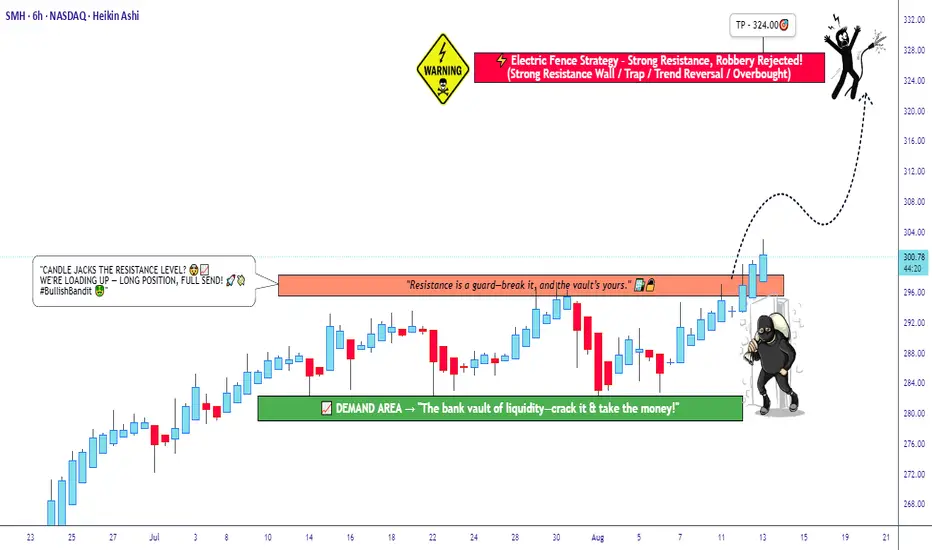
SMH Bullish Setup – Breakout Plan for the Perfect Heist!🔥🚀 THIEF TRADER ALERT: SMH BULLISH HEIST PLAN! 🚀🔥
Asset: VANECK SEMICONDUCTOR ETF (SMH)
Plan: BULLISH BREAKOUT HEIST 🎯 (Resistance wall breakout candle close above 298.00)
🎯 THIEF ENTRY STRATEGY (LAYERING METHOD) 🎯
"Steal the dip like a PRO!" 💰🔪
Multiple Limit Orders (Layer Entry) 👇
1st Layer: 298.00 (Breakout Confirmation)
2nd Layer: 292.00 (Pullback Steal)
3rd Layer: 288.00 (Aggressive Discount)
4th Layer: 284.00 (Max Pain = Max Gain)
(Add more layers if you’re a risk-loving THIEF!)
⚠️ WARNING: DO NOT place SL or orders before breakout! (Only real THIEFS wait for confirmation!)
🛑 THIEF STOP LOSS (OG STYLE) 🛑
"Protect your loot or get wrecked!" 💣
SL @ 280.00 (Hard floor – adjust based on your risk appetite!)
Place SL ONLY AFTER breakout! (No premature stops – patience = profit!)
🎯 TARGET: 324.00 🚀 (OR ESCAPE EARLY IF MARKET TURNS)
Scalpers: Ride the waves, but stay LONG ONLY! 🌊
Swing Thieves: Hold & rob big! Use Trailing SL to lock gains! 🔐💰
📢 THIEF PRO TIPS:
✅ Set Alerts! (Don’t miss the breakout!) 🔔
✅ Watch for News! (Avoid getting caught in volatility traps!) 📉📈
✅ Boost & Support! (More boosts = more heists!) 💖🚀
🔥 FINAL MESSAGE:
"The market is a casino, and WE are the robbers! 🎰💰 Steal smart, escape rich! 🏴☠️💸"
👉 LIKE, BOOST & FOLLOW FOR MORE HEIST PLANS! 👈
🚀 NEXT HEIST COMING SOON… STAY TUNED! 🚀
#ThiefTrader #SMH #BreakoutHeist #LayerEntry #LimitOrderBandit 🎯🔥
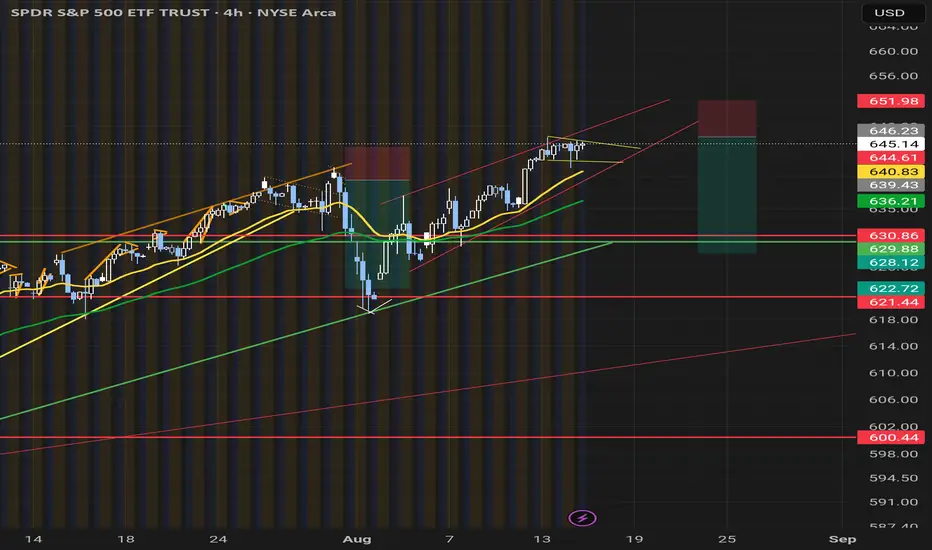
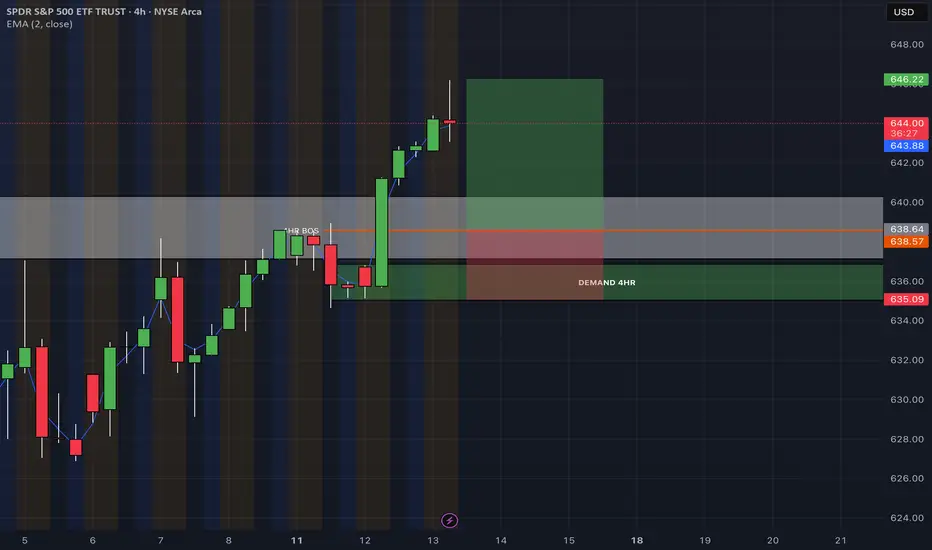
PRICE BROKEN ABOVE WEEKLY BOS 640 LEVEL
Bullish
If the market retests the BOS zone and holds it as support, we could see continuation toward new highs. I’ll be watching the 4hr demand zone to confirm buyer strength. Ideally, the weekly BOS should hold, and price should remain above the 4hr BOS support level.
Bearish scenario
If the BOS fails, price may pull back to the next major weekly support, with the potential for a deeper retracement.
Bullish 🟢
• Hold above 640.46 great indication for continuation (BOS zone)
• Buyers defend 4hr demand zone (638.64–635.09)
• Short-term target: 646.22, extended target: 650.44
Bearish 🔴
• Break and close below 635.09 (4hr demand low)
• Next major support: 631.68 → 620.00 zone
• If 620 fails, deeper retracement possible toward 608.95, then 593.53
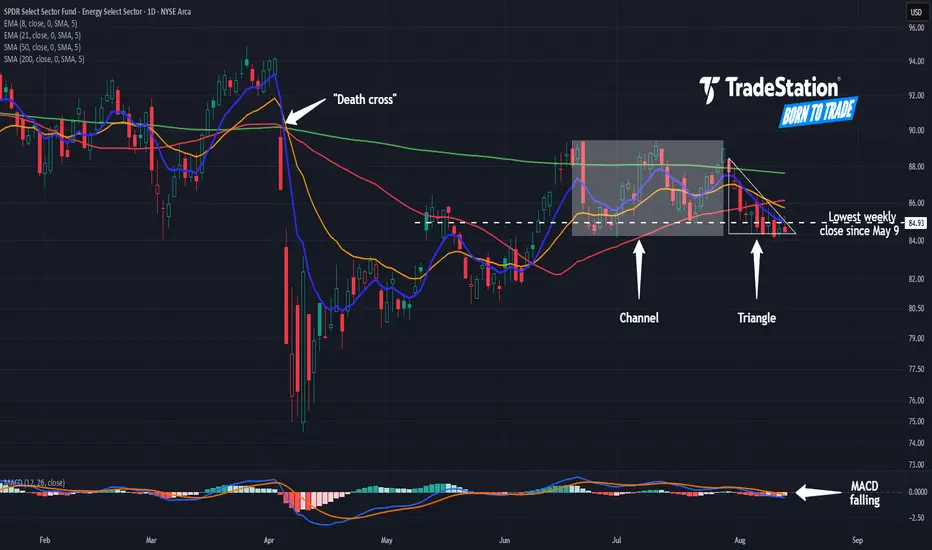
Energy Channel Gives Way to TriangleThe SPDR Select Sector Energy ETF has staggered in a channel since June, and now some traders may see downside risk.
The first pattern on today’s chart is the sideways channel between mid-June and late July. XLE ended Friday at $84.93, the lowest weekly close since May 9. Has a breakdown potentially begun?
Second is the series of lower highs in the last two weeks. Combined with the August 5 low of $84.35, the result could be a bearish descending triangle.
Third, the 50-day simple moving average (SMA) has mostly remained below the 200-day SMA. That may be consistent with a long-term downtrend.
Fourth, MACD is falling. The 8-day exponential moving average (EMA) is also below the 21-day EMA. Those signals may be consistent with short-term bearishness.
Standardized Performances for the ETF mentioned above:
SPDR Select Sector Energy ETF (XLI)
1-year: -6.44%
5-years: +142.05%
10-year: +29.03%
(As of July 31, 2025)
Exchange Traded Funds ("ETFs") are subject to management fees and other expenses. Before making investment decisions, investors should carefully read information found in the prospectus or summary prospectus, if available, including investment objectives, risks, charges, and expenses. Click here to find the prospectus.
TradeStation has, for decades, advanced the trading industry, providing access to stocks, options and futures. If you're born to trade, we could be for you. See our Overview for more.
Past performance, whether actual or indicated by historical tests of strategies, is no guarantee of future performance or success. There is a possibility that you may sustain a loss equal to or greater than your entire investment regardless of which asset class you trade (equities, options or futures); therefore, you should not invest or risk money that you cannot afford to lose. Online trading is not suitable for all investors. View the document titled Characteristics and Risks of Standardized Options at www.TradeStation.com . Before trading any asset class, customers must read the relevant risk disclosure statements on www.TradeStation.com . System access and trade placement and execution may be delayed or fail due to market volatility and volume, quote delays, system and software errors, Internet traffic, outages and other factors.
Securities and futures trading is offered to self-directed customers by TradeStation Securities, Inc., a broker-dealer registered with the Securities and Exchange Commission and a futures commission merchant licensed with the Commodity Futures Trading Commission). TradeStation Securities is a member of the Financial Industry Regulatory Authority, the National Futures Association, and a number of exchanges.
TradeStation Securities, Inc. and TradeStation Technologies, Inc. are each wholly owned subsidiaries of TradeStation Group, Inc., both operating, and providing products and services, under the TradeStation brand and trademark. When applying for, or purchasing, accounts, subscriptions, products and services, it is important that you know which company you will be dealing with. Visit www.TradeStation.com for further important information explaining what this means.
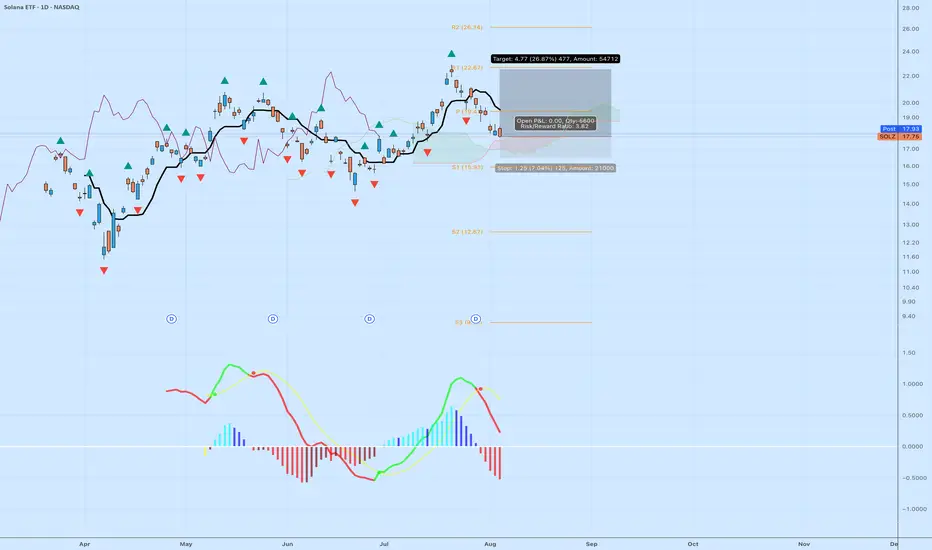
$SOLZ – Ichimoku Cloud Long SetupThis chart shows a potential long opportunity forming on NASDAQ:SOLZ using Ichimoku principles.
The price has pulled back into the Ichimoku Cloud (Kumo), which often acts as dynamic support during an uptrend. The cloud is still bullish, with Senkou Span A above Span B, indicating the longer-term trend remains intact.
The Kijun-sen (Base Line) at around $18.50 is the next resistance. A daily close above that level would confirm a potential trend continuation. The Tenkan-sen (Conversion Line) is currently sloping downward but would turn up if price moves higher.
The Chikou Span (Lagging Line) is still above price candles, showing that overall momentum remains bullish.
MACD histogram is red but beginning to flatten, signaling bearish momentum may be slowing.
Trade setup:
Entry: $17.75 (current price in the cloud)
Stop: $16.50 (below Kumo base and S1 support)
Target: $22.67 (R1 and prior resistance)
Risk/Reward: 3.78
Setup remains valid as long as the price holds above the cloud. A breakdown below $16.50 would invalidate the trade. A close above the cloud and Kijun would trigger full bullish confirmation.
This is a textbook cloud bounce opportunity with strong trend-following potential.