Qqq... tech wreck incomingIt's a been awhile since I covered Tech and the sectors..
To make a long story short, I think the rally from April low is about 95% completed and anything up here is Distribution...
After Distribution, usually a correction comes and given the Sept Seasonality I think this correcti9m could be 7-12%.
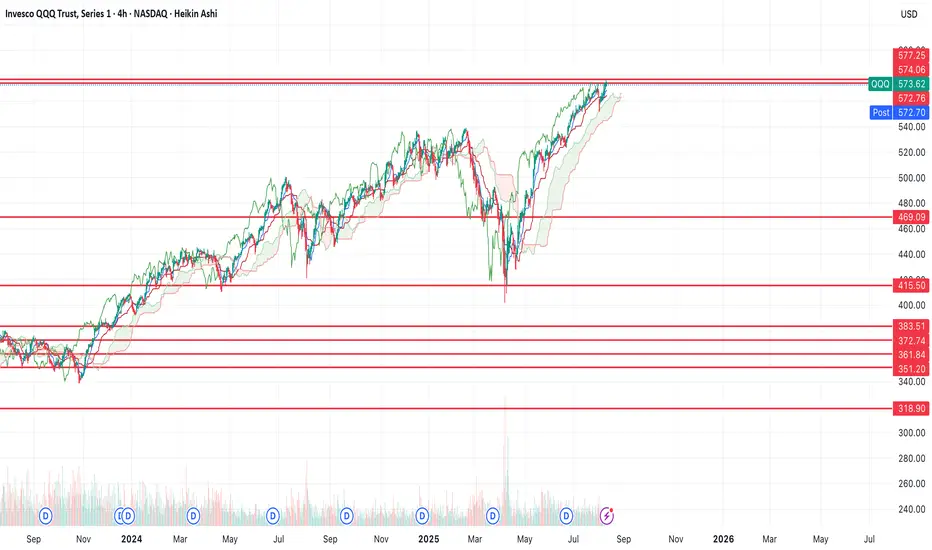
Here's Qqq on the monthly...
At this pace , the monthly trendline can be met at 585 give or take which is only 1% away.. with us being so close to resistance, they will not be able to push everything all at once.. in the next week or so you will start seeing more and more divergence where only a select few will pump this across the 585 goal line.
Also on the monthly time frame, you can see that Qqq is outside its Bollinger bands, we won't make it out of Sept with that setup.
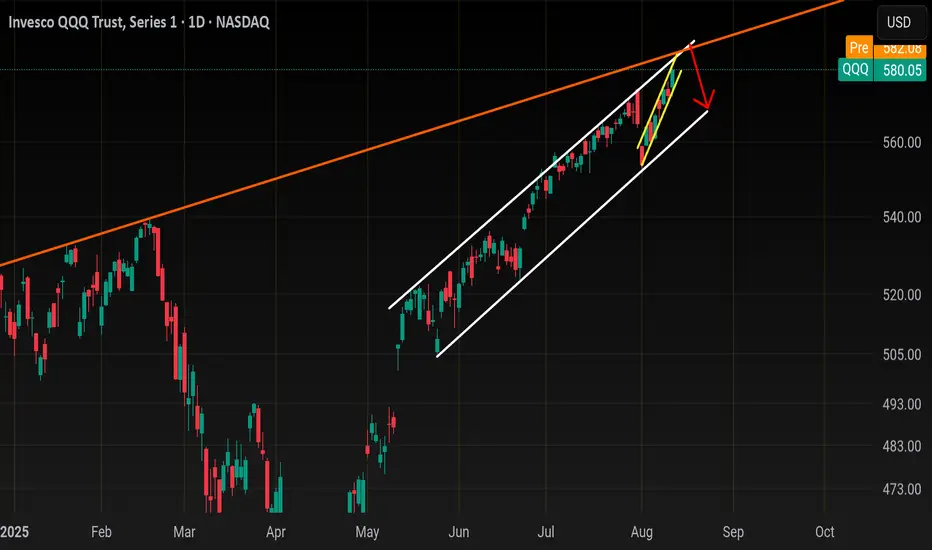
Daily chart
Daily candle is 60% outside its Bbands.. this is always a red flag on the indexes... Some Meme stocks like PLTR or Crcl may rally outside bbands but the indexes usually don't hold more that a day outside.. only in a few Seasonality squeezes Nov-Jan have I seen this
Being outside Bollinger bands and near monthly and daily trendline is terrible Risk for a long here.
Now the sectors..
There are really 4 main sectors that move Qqq.
Consider Qqq a car and the sectors are important pieces (Engine,transmission).
Here's AMEX:XLC
This is the sector of Meta, googl , and Nflx.
At resistance here ,
Outside daily bbands
NASDAQ:SMH
Home of Nvda,Tsm, and Avgo
The overbought at resistance setup is the same as XLC
AMEX:XLK
This is the biggest sector here
Home of Msft , aapl and nvda also
Same shit as the first 2
XLK may have room for 270 but that's it.
The last 2 times I saw a setup on Qqq where sector and index were all telling me the same thing was Dec 15th 2024 and Feb 14th 2025 ; Qqq corrected a few days later of both dates ..
The only sector that is an enigma to me right now is AMEX:XLY
The home of tsla and amzn
Weekly chart
This doesn't look bearish
It's not overbought like the others which is because amzn and tsla have lagged the other big tech names on this rally
Daily chart
Needs to clear 228 for Tsla to push higher we head back to 218
Could they correct the rest of tech and pump just tsla and or amzn? Absolutely. Propping up a couple and dumping the rest is called a plunge protection.. it won't stop qqq from bleeding but instead of a 12% correction, you'd end up with a 7-10%. Fawkery.
Let's see what happens with XLY
So let's zero in on Qqq
As far as trading goes today
Nq 4hour money flow indicator combine
with Qqq 15min money flow
combined
with us gapping out side bollingerband tells me do not chase the long here, there is a high chance we flush and close this gap today but I don't think we will break back below 578-579 before we tag 585 could come on PPI tomorrow..
So let's say today's resistance is 583, you'd short there with a 579-580 target.. be willing to add to your short up into 585. Cut losses above 585.. like I said , I don't think we break back below 577 until 585 is tagged so today may be a scalp short before the last leg up
The bottom of this Daily channel is around 568-570, with the 20ma right below it.. that will be your short term target once 585 is reached. The real correction starts below 566
2 big catalyst next week are Fed minutes Wed and Jackson hole which starts on the weekend
ETF market
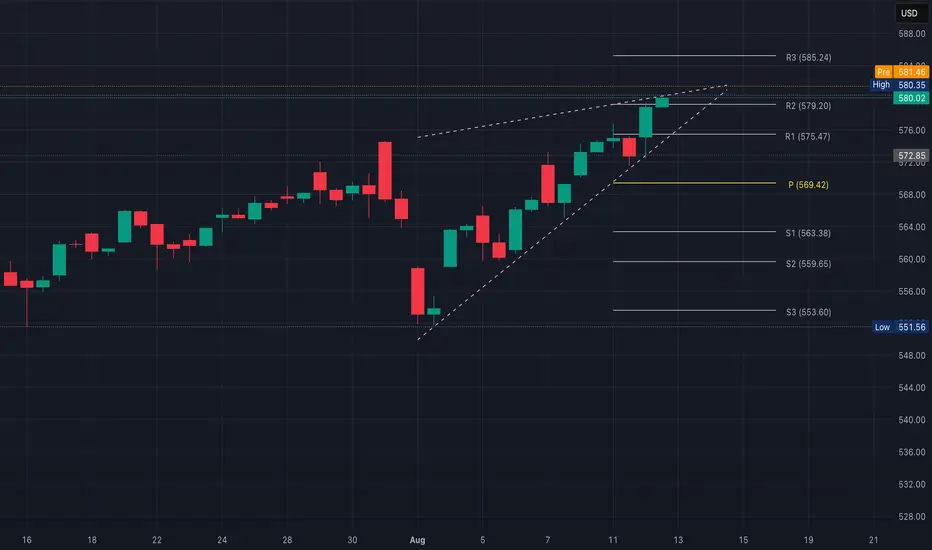
QQQ Rising WedgeA rising wedge is generally considered bearish, especially if volume is decreasing into the apex
R2 ($579.20) & the wedge top (~$579.5–$580)
R3 ($585.24) if it breaks out
Trendline support around $576, then R1 ($575.47) & pivot ($569.42)
If price fails here & breaks the lower wedge line, it could trigger a pullback toward the pivot or
S1 ($563.38)
Breakout above wedge & R2 could push quickly toward R3
Break below wedge support could accelerate selling to pivot/S1
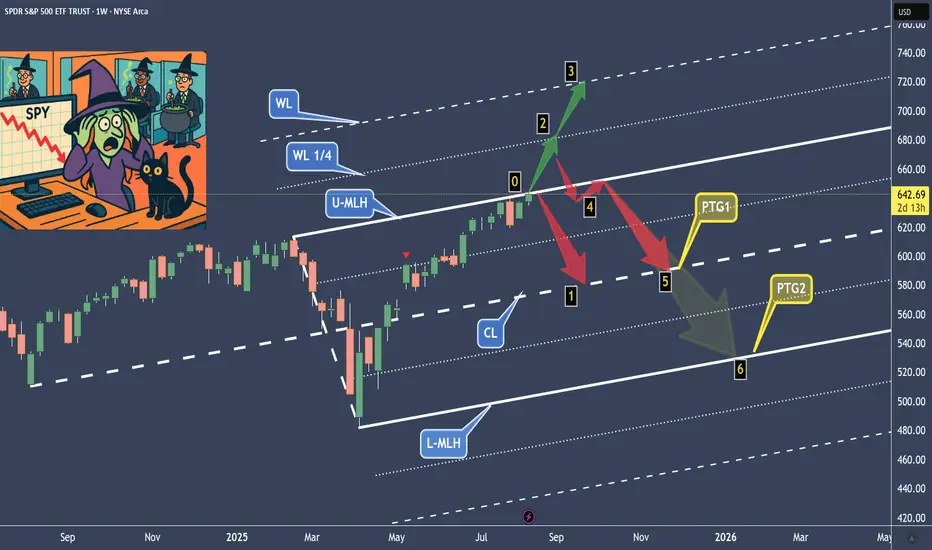
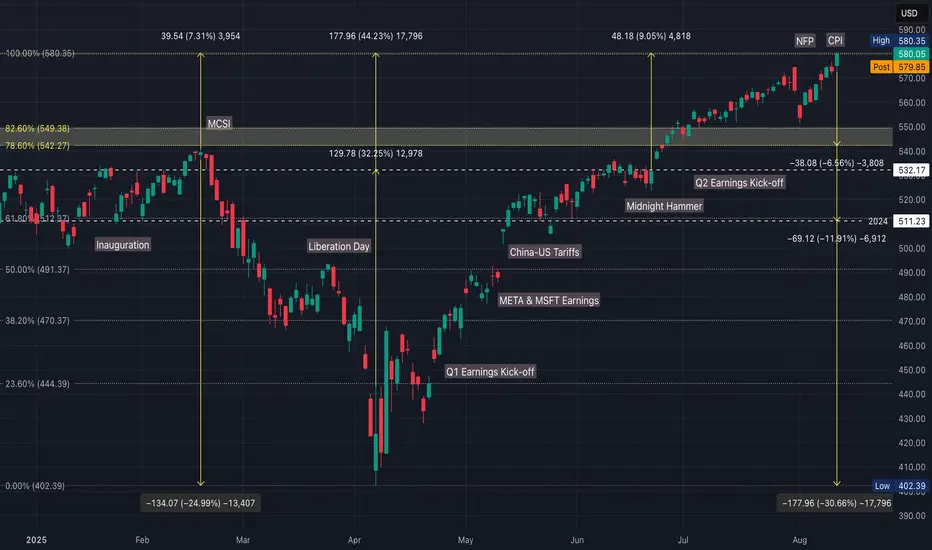
From FOMO to Game Over: The Witch’s Market ProphecyPolitics and market forces are cooking the soup too hot, and greed is on the menu. Investors, funds, and retail traders are ignoring the signs — and just like in the Wild West, only the weapons have changed: stocks, futures, and options. Today, we’ll peek over the witch’s shoulder to see what she sees in the chart’s shadows.
The Setup
This chart shows the market reaching the U-MLH (Upper Median Line Parallel) for the third time. Even this week, the greedy market is nibbling at that level, trying to chew its way higher. The question: does it break through — or break down?
Scenarios
(0) → Price touches the U-MLH for the third time.
Historically, repeated touches can lead to either an explosive breakout or a sharp reversal.
(2) → A momentum kick, driven by FOMO, could push price up to the Warning 1/4 line.
This would be the bulls’ dream run.
(3) → The market reaches the next pitchfork line/deviation — because that’s what markets do.
After that? Only the market gods know.
(4) → Price fails to reach WL1 (Warning Line 1), triggering a Hagopian.
This typically signals a failed breakout and a likely pullback.
Key question: Will U-MLH hold as support?
If not, expect a quick test/retest from below… then it’s Game Over.
(5) → In 80% of cases, the centerline gets tagged as Profit Target 1.
That could be the “logical” next stop.
(6) → L-MLH (Lower Median Line Parallel) — the panic zone.
This is when fear takes over, selling accelerates, and the market feels like the fan just got hit.
Final Word
Whatever happens next, the witch doesn’t care — she’ll be riding her broom into the moonrise, leaving the rest of us to trade the chaos.
#SPX500 #NASDAQ100 #TechnicalAnalysis #Pitchfork #Futures #Options #MarketOutlook #SwingTrading #FOMO
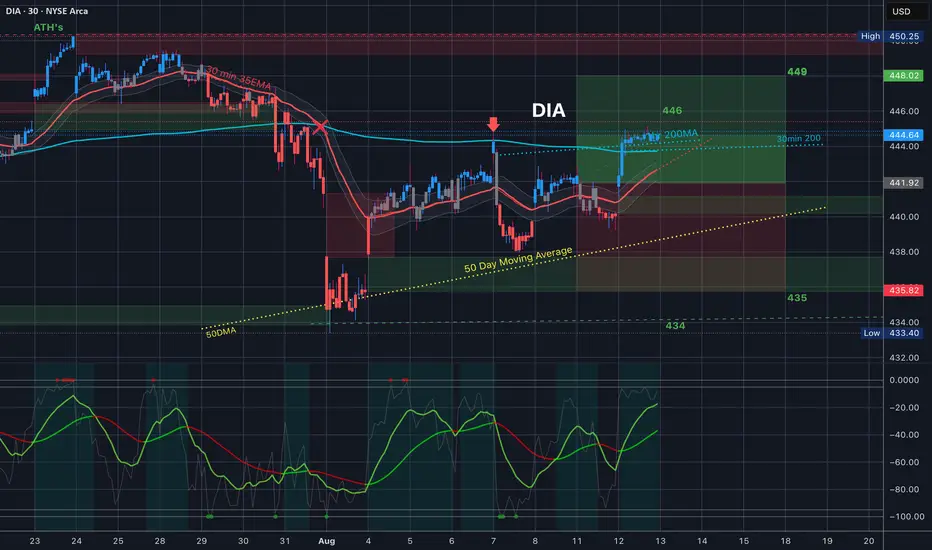
$DIA Analysis, Key Levels & Targets
Alright, what a day. DIA, after a down day to start the week, gapped up above the 35EMA and then pushed above the 30min & 1hr 200MA’s which you can see were trading together and traded sideways from there near previous resistance. Still well within the trading range for the week.
(HIT GRAB THIS CHART - UNDER THE CHART NEXT TO THE 🚀)
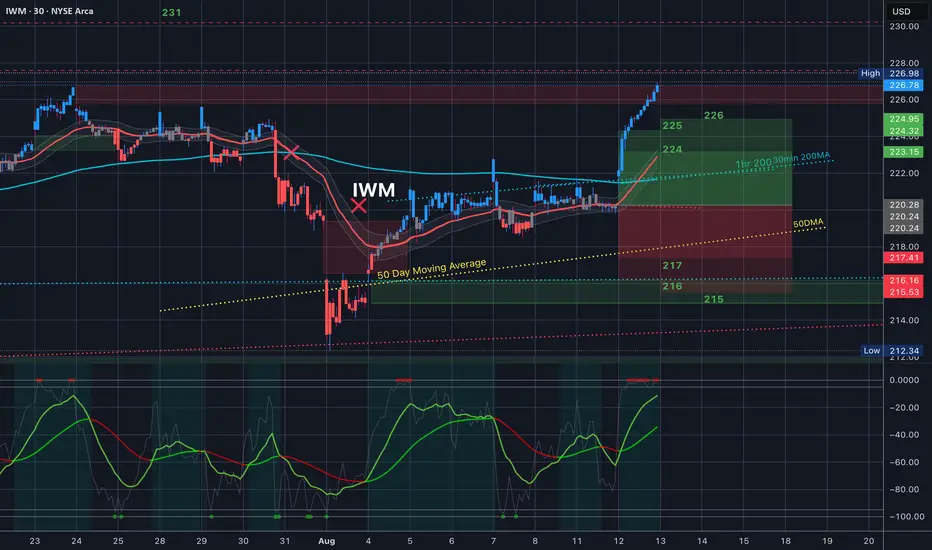
$IWM Analysis, Key Levels & Targets
WOW - look at this crazy move today after CPI. IWM gapped o er the 1hr 200MA and the 30min 200 combo and rallied like crazy. It blew passed all of the levels and filled the bear gap from last month 😳
Spread traders - wait until we are closing within the trading range consistently again.
224 tomorrow?
(HIT GRAB THIS CHART - UNDER THE CHART NEXT TO THE 🚀)
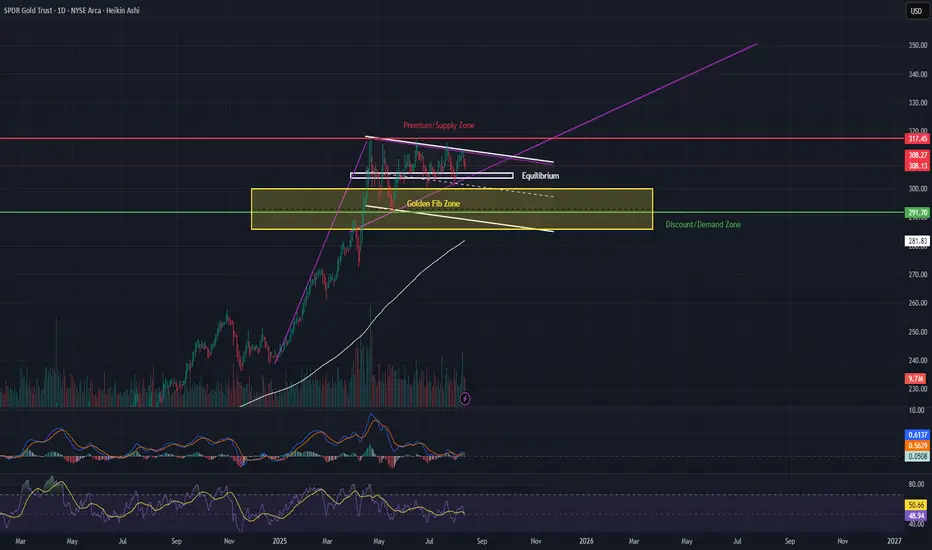
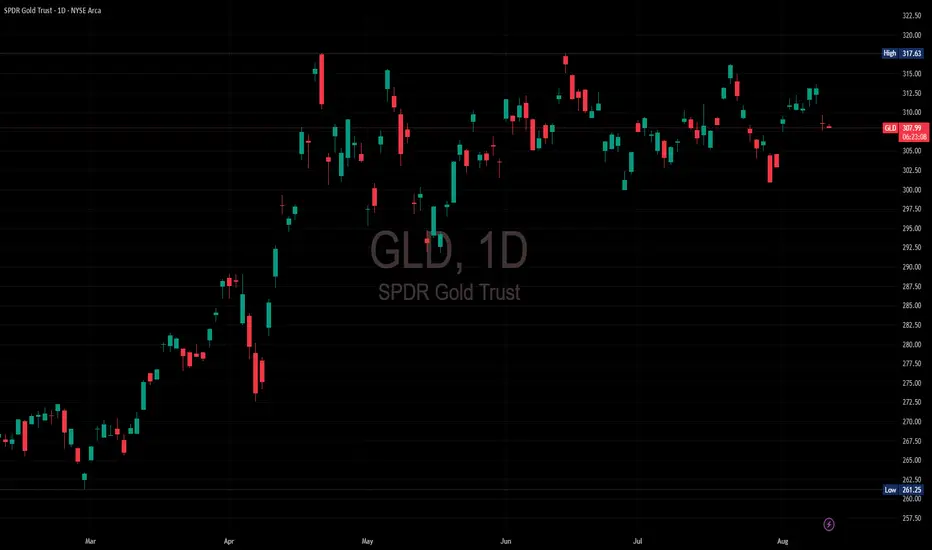
GLD | Bullish Pennant Near All-Time High — Key Levels to Watch GLD is consolidating within a bullish pennant after its March–April rally, trading near the equilibrium zone (305–307). Price action is tightening, and we’re nearing the apex — meaning a breakout is likely soon.
📈 Bullish Scenario – Bullish Pennant Breakout
Pattern: Bullish pennant, flagpole measured move targets 330–335.
Bullish Entry: On a confirmed daily close above 312–314 with increasing volume.
Take Profits:
1️⃣ TP1: 320 (psychological + resistance)
2️⃣ TP2: 330–335 (measured move target)
Stop Loss: Below 305 (under equilibrium) or conservative SL at 302 (below pennant support).
Why: Holding above equilibrium while contracting in price signals accumulation; breakout could mirror prior leg higher.
📉 Bearish Scenario – Pennant Failure
Bearish Entry: On a daily close below 302–300 with strong sell volume.
Take Profits:
1️⃣ TP1: 292–294 (mid-range)
2️⃣ TP2: 285–290 (discount/demand zone & near 200 EMA)
Stop Loss: Above 307–308 (back inside pennant).
Why: A breakdown here invalidates the bullish pennant and targets deeper retracement toward key support.
💡 Options Trade Ideas
(For traders looking to position with defined risk)
Bullish Breakout Play
Strategy: Buy GLD Calls 4–6 weeks out from breakout confirmation.
Strike: ATM or slightly OTM (e.g., 315C).
Trigger: Break and close above 312–314.
Target Exit: Scale out at 320 and 330–335.
Risk Management: Stop if GLD closes below 305 after breakout.
Bearish Breakdown Play
Strategy: Buy GLD Puts 4–6 weeks out from breakdown confirmation.
Strike: ATM or slightly OTM (e.g., 300P).
Trigger: Break and close below 302–300.
Target Exit: Scale out at 292–294 and 285–290.
Risk Management: Stop if GLD closes above 307 after breakdown.
✨ Golden Fib Zone (Key Confluence Support)
This zone (highlighted in yellow) represents the 61.8% Fibonacci retracement of the March–April rally.
It overlaps with the discount zone and sits just above the discount/demand zone (285–290), making it a high-probability buy area if price pulls back here.
Historically, the Golden Fib acts as a strong reversal area in trending markets, especially when combined with structural support and the 200 EMA.
A bounce from this zone would keep the bullish pennant valid and could serve as a low-risk long entry for swing traders targeting the 320+ zone.
🔍 Key Levels to Watch
Upside: 312.5 → 320 → 330–335
Downside: 305 → 302 → 285–290
⏳ Summary:
GLD is in a pivotal coiling phase. The Golden Fib Zone adds strong confluence for buyers if we see a retracement, while an upside breakout from the pennant could trigger the next leg higher. Either way, this setup is primed for a high-volatility move — be ready for both scenarios.
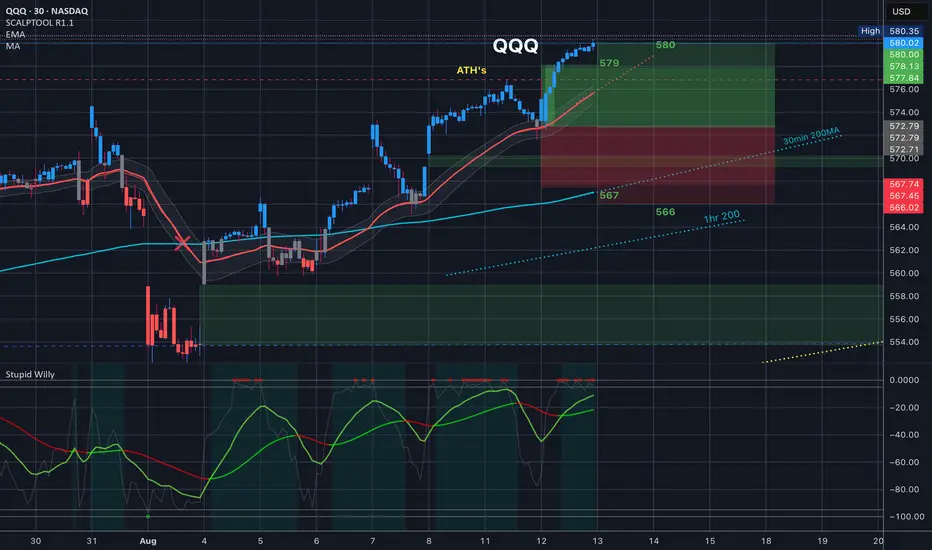
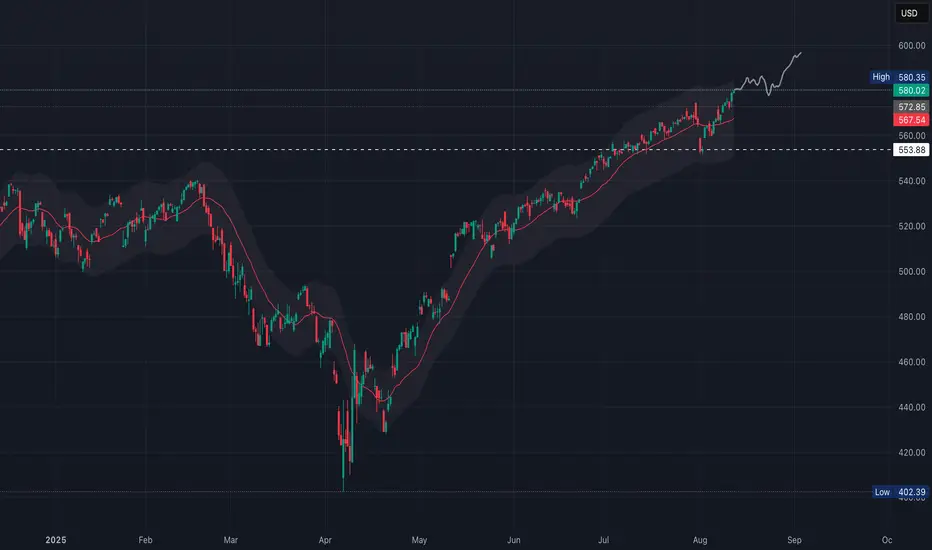
$QQQ Analysis, Key Levels & Targets
What a crazy day. We had CPI in premarket today then we kept up and we took it past all-time highs to the top of the implied move to the top of the implied move on the next day so we close just above 5 cents above 580
Volatility got crushed today CBOE:VXN down -7.32 destroying options and shorts betting on downside
DID YOU SEE the bounce on the 35EMA by the way??
I do believe that tomorrow we will be trading under 581. Thursday we have PPI and because we're in an in between day tomorrow I think we might be a little bit more flat also look at how high up that 35 EMA is within the training range
(HIT GRAB THIS CHART - UNDER THE CHART NEXT TO THE 🚀)
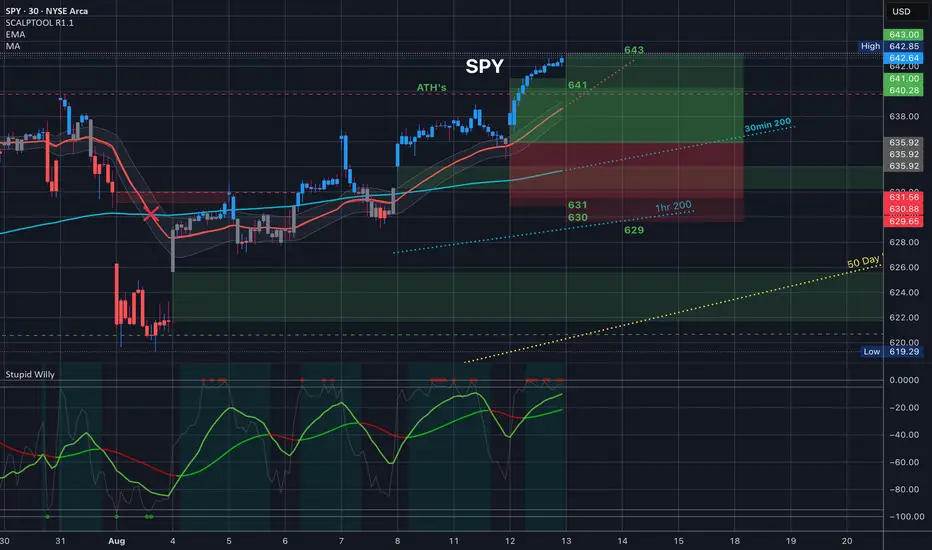
$SPY Analysis, Key Levels & Targets
What a crazy day. We had a CPI in premarket today then we kept up and we took it past all-time highs to the top of the implied move to the top of the implied move on the next day so we close just under 643.
I do believe that tomorrow we will be trading around 643, maybe even between 641 and 643. Thursday we have PPI and because we're in an in between day tomorrow I think we might be a little bit more flat also look at how high up that 35 EMA is within the training range
(HIT GRAB THIS CHART - UNDER THE CHART NEXT TO THE 🚀)
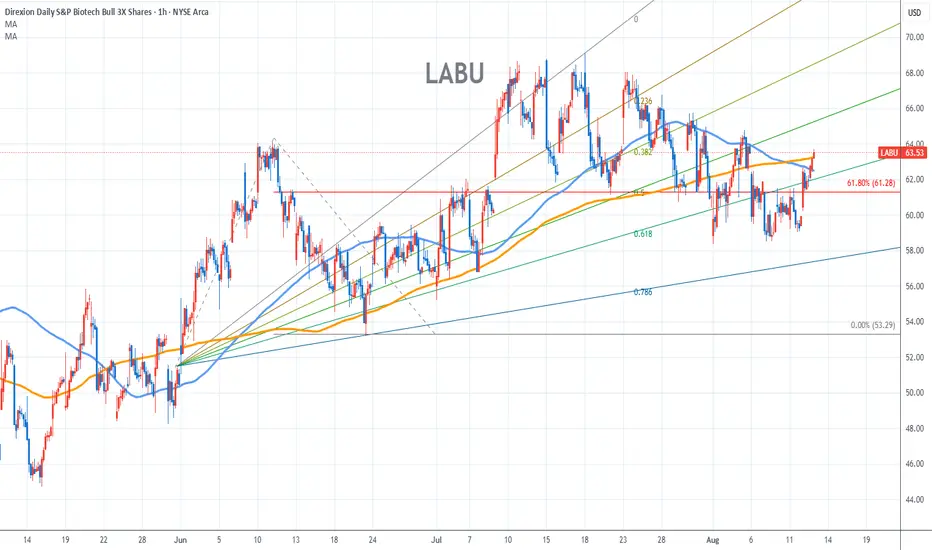
LABU Stock Chart Fibonacci Analysis 081225Trading Idea
1) Find a FIBO slingshot
2) Check FIBO 61.80% level
3) Entry Point > 61/61.80%
Chart time frame:B
A) 15 min(1W-3M)
B) 1 hr(3M-6M)
C) 4 hr(6M-1year)
D) 1 day(1-3years)
Stock progress:A
A) Keep rising over 61.80% resistance
B) 61.80% resistance
C) 61.80% support
D) Hit the bottom
E) Hit the top
Stocks rise as they rise from support and fall from resistance. Our goal is to find a low support point and enter. It can be referred to as buying at the pullback point. The pullback point can be found with a Fibonacci extension of 61.80%. This is a step to find entry level. 1) Find a triangle (Fibonacci Speed Fan Line) that connects the high (resistance) and low (support) points of the stock in progress, where it is continuously expressed as a Slingshot, 2) and create a Fibonacci extension level for the first rising wave from the start point of slingshot pattern.
When the current price goes over 61.80% level , that can be a good entry point, especially if the SMA 100 and 200 curves are gathered together at 61.80%, it is a very good entry point.
As a great help, tradingview provides these Fibonacci speed fan lines and extension levels with ease. So if you use the Fibonacci fan line, the extension level, and the SMA 100/200 curve well, you can find an entry point for the stock market. At least you have to enter at this low point to avoid trading failure, and if you are skilled at entering this low point, with fibonacci6180 technique, your reading skill to chart will be greatly improved.
If you want to do day trading, please set the time frame to 5 minutes or 15 minutes, and you will see many of the low point of rising stocks.
If you want to prefer long term range trading, you can set the time frame to 1 hr or 1 day.
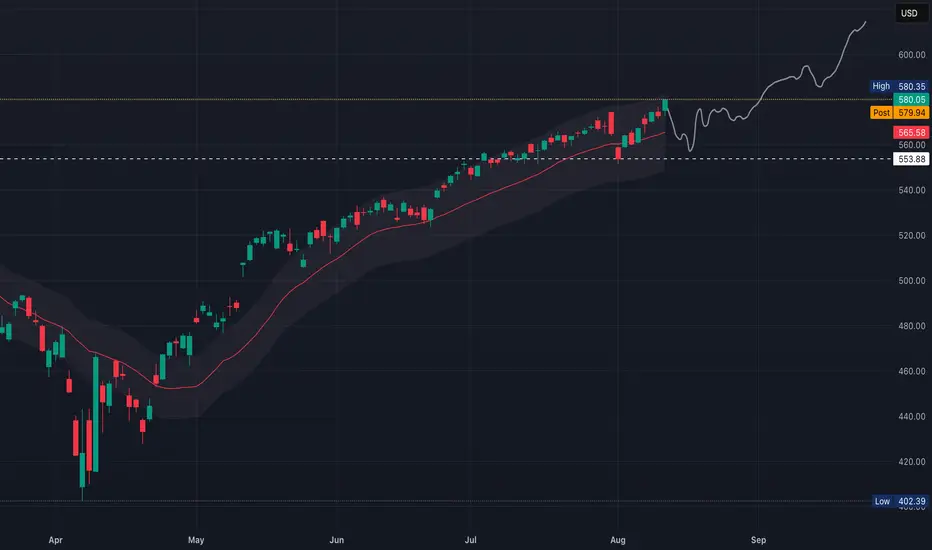
QQQ Path to $600Macro Tailwinds
~95% odds of a September rate cut, an actual cut plus dovish language would boost valuations
If inflation continues easing without a major growth slowdown, growth stocks could re-rate higher (soft landing vs stagflation narrative)
Yields
10Y Treasury back toward 3.8-4.0%
Lower yields historically supportive for QQQ
Earnings
Mag 7 beating expectations in Q3 & Q4 keeps AI momentum intact
More than 65-70% of NDQ100 above their 50d SMA would confirm strength beyond a few leaders
Technical Path
Support near ~$573
Resistance around $577–580 (recent intraday highs)
Sustained closes above $580 with expanding breadth and volume is a breakout trigger
QQQ’s top end from an extended channel projection ~$590–595
Measured move from March–July base (~$520–$560 = $40 range; breakout above $560 projects ~$600)
Break $580 in late August–September on dovish Fed + solid earnings = $600 by Q4
Fed cuts + AI blowout earnings = $600 by late September.
Core inflation sticky + yields up = stall at $580, retest $550 before end of year
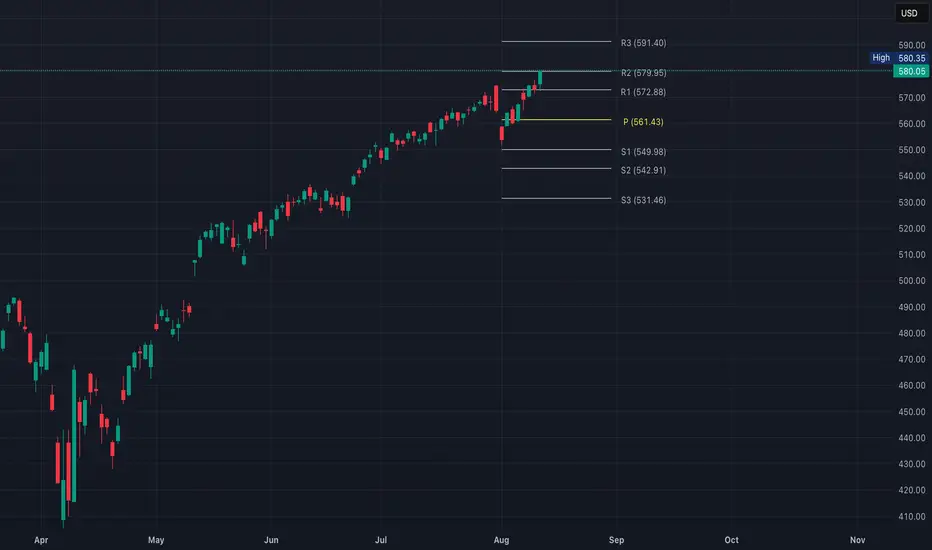
QQQ Closes @ R2The strong multi-day rally suggests buyers are in control, but hitting R2 often leads to short-term profit-taking
Watch for either a breakout continuation toward R3 or a pullback to retest R1
QQQ What could go wrong?Bulls are riding the tailwind of weakening headline inflation, buyer-friendly rate outlooks, and AI/tech strength.
~61% of QQQ stocks are above their 200d SMA, but only ~48% above 50d SMA
Need 60–65% stocks above 50d SMA
New highs consistently > 8–10% of index components
Bears flag concerns around persistent core inflation, lofty valuations, technical caution, and long-term risk exposure—especially if QQQ’s momentum disintegrates
Core CPI remains sticky (like the latest 3.1% YoY) which delays Fed cuts
Geopolitical/tariff shocks hitting supply chains or tech exports
Earnings misses from big AI names which reverses sentiment
Yield spike above 4.4% on the 10-year (valuation compression)
QQQ Path to $600Macro Tailwinds
~95% odds of a September rate cut, an actual cut plus dovish language would boost valuations
If inflation continues easing without a major growth slowdown, growth stocks could re-rate higher (soft landing vs stagflation narrative)
Yields
10Y Treasury back toward 3.8-4.0%
Lower yields historically supportive for QQQ
Earnings
Mag 7 beating expectations in Q3 & Q4 keeps AI momentum intact
More than 65-70% of NDQ100 above their 50d SMA would confirm strength beyond a few leaders
Technical Path
Support near ~$573
Resistance around $577–580 (recent intraday highs)
Sustained closes above $580 with expanding breadth and volume is a breakout trigger
QQQ’s top end from an extended channel projection ~$590–595
Measured move from March–July base (~$520–$560 = $40 range; breakout above $560 projects ~$600)
Break $580 in late August–September on dovish Fed + solid earnings = $600 by Q4
Fed cuts + AI blowout earnings = $600 by late September.
Core inflation sticky + yields up = stall at $580, retest $550 before end of year
Nightly $SPY / $SPX Scenarios for August 13, 2025🔮 Nightly AMEX:SPY / SP:SPX Scenarios for August 13, 2025 🔮
🌍 Market-Moving News 🌍
📉 CPI cooldown keeps cut odds alive — July CPI came in +0.2% m/m, +2.7% y/y; Core +0.3% m/m, +3.1% y/y, reinforcing a “disinflation but not done” vibe. Watch $SPY/ SP:SPX vs. TVC:DXY and NASDAQ:TLT as markets handicap a September cut.
🛢️ EIA sees crude sliding sub-$60 — The EIA’s August outlook projects Brent <$60 in Q4 ‘25 as supply growth outpaces demand; energy equities ( AMEX:XLE ) and $USO/$CL_F stay sensitive to this path.
🏦 Fed-speak cluster today — Three regional Feds on deck (Barkin, Bostic, Goolsbee). Any shift in tone on tariffs vs. labor softness can move the front end and equities.
📊 Key Data Releases & Events (ET) 📊
📅 Wed, Aug 13
• 7:00 AM — MBA Mortgage Applications (weekly).
• 8:00 AM — Richmond Fed’s Tom Barkin speaks (Greenville Chamber).
• 10:30 AM — EIA Weekly Petroleum Status Report (inventories, products).
• 1:00 PM — Chicago Fed’s Austan Goolsbee Q&A (12:00 CT luncheon; livestream).
• 1:30 PM — Atlanta Fed’s Raphael Bostic remarks (economic outlook).
• 1:00 PM — U.S. 10-Year Note Auction (Treasury) — usual mid-month supply; watch $TLT/$TNX.
⚠️ Disclaimer: Educational/informational only — not financial advice.
📌 #trading #stockmarket #economy #CPI #Fed #oil #bonds #SPY #SPX #TLT #DXY #XLE
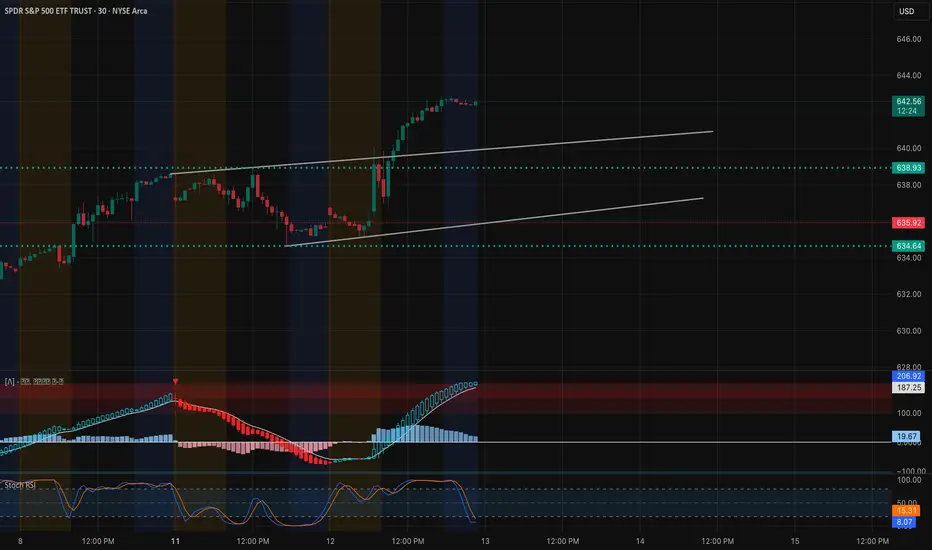
SPY – TA + GEX Confluence for August 13, 202530-Minute Price Action
SPY is pushing higher within a rising channel after bouncing from $634.64 support.
* Resistance: $642.59 – current upper channel limit and intraday high.
* Support: $638.93 – breakout retest level; $635.92 – secondary support and lower channel trendline.
* Indicators:
* MACD remains strongly bullish with widening histogram, although it’s approaching overextended levels.
* Stoch RSI in oversold territory after a minor dip, suggesting potential for continued upside if momentum holds.
1-Hour GEX Insights
* Highest Positive NET GEX / Gamma Wall: $642 – aligns with 30m resistance and intraday high.
* Call Walls Above: $643 (2nd gamma wall) and $645 (major upside extension target).
* Put Support: $633 (first defense) and $631–$630 (secondary gamma floors).
* IVR: 11.2 – relatively low implied volatility rank, keeping long options affordable.
TA + GEX Combined Read
The $642 level is a dual confluence zone — it’s both the top of the 30m rising channel and the highest GEX wall on the 1h chart.
* A breakout above $642 with strong volume could fuel a quick push toward $643–$645, where heavy gamma resistance sits.
* Failure to break $642 convincingly could trigger a pullback toward $638.93, with deeper support at $635.92.
Trading Scenarios for August 13
* Bullish Breakout: Long calls or debit spreads above $642 targeting $643–$645.
* Bearish Rejection: Puts or put spreads if $642 rejects and $638.93 fails, targeting $635.92.
* Range Play: If price holds between $639–$642, short premium strategies could work given low IVR, but be prepared for breakout moves.
Reasoning
The 30m rising channel structure and the 1h GEX map both highlight $642 as the decision point for tomorrow. A break above could trigger gamma-fueled upside, while a rejection keeps SPY in range or pulls it back to GEX-supported floors.
Disclaimer: This analysis is for educational purposes only and does not constitute financial advice. Always do your own research and manage risk appropriately before trading.
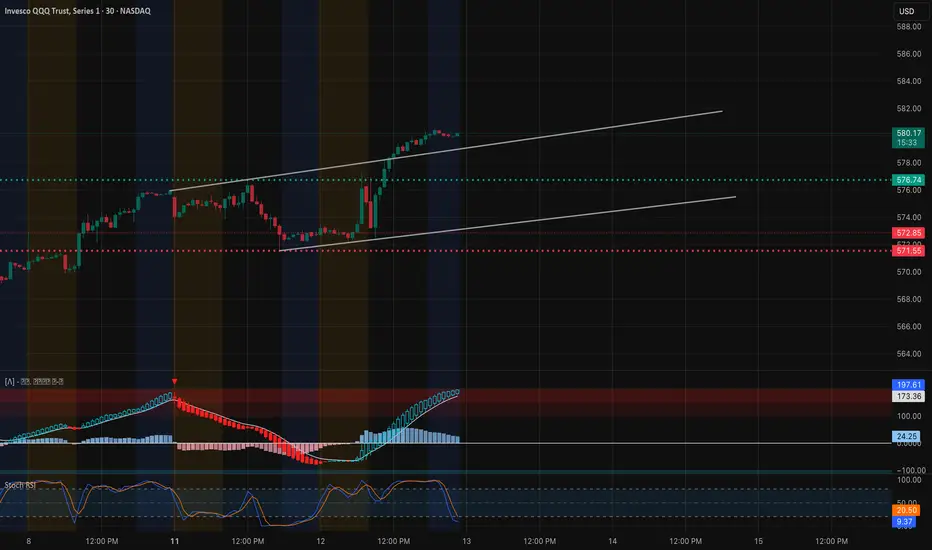
QQQ – TA + GEX Confluence for August 13, 202530-Minute Price Action
QQQ is pushing higher inside a rising channel after breaking through $576.74 support-turned-resistance.
* Resistance: $580.17 – current upper channel limit and intraday high.
* Support: $576.74 – breakout retest level; $572.85–$571.65 – key downside pivot zone.
* Indicators:
* MACD remains strongly bullish, but histogram is showing early signs of slowing momentum.
* Stoch RSI is in oversold territory after a minor pullback, suggesting potential for another push higher if momentum returns.
1-Hour GEX Insights
* Highest Positive NET GEX / Gamma Wall: $580 – aligns with the 30m resistance and current intraday high.
* Call Walls Above: $582 (next gamma level) and $585 (upper extension target).
* Put Support: $572 (first defense) and $565–$567 (major downside gamma floor).
* IVR: 9.8 – low implied volatility rank, keeping long options relatively cheap.
TA + GEX Combined Read
The $580 level is a dual confluence zone — it’s both the 30m upper channel resistance and the highest GEX wall on the 1h chart.
* A breakout above $580 could see quick follow-through toward $582 and possibly $585 if call buying pressure builds.
* Failure to break $580 with conviction could bring a retest of $576.74, with deeper pullback potential to $572 if sellers take control.
Trading Scenarios for August 13
* Bullish Breakout: Long calls or debit spreads above $580 targeting $582–$585.
* Bearish Rejection: Puts or put spreads if $580 rejects and $576.74 fails, targeting $572.
* Range Strategy: If price stays between $576–$580, short premium plays could work given low IVR, but be ready for a breakout.
Reasoning
The 30m rising channel aligns perfectly with the 1h GEX data, showing $580 as the decision point for tomorrow. Breaking above it can trigger gamma-fueled upside, while rejection keeps QQQ range-bound or sends it back to GEX-supported floors.
Disclaimer: This analysis is for educational purposes only and does not constitute financial advice. Always do your own research and manage risk appropriately before trading.
QQQ $600 Macro Tailwinds Needed
Fed Policy
Rate Cut in September — Market is pricing ~93–95% odds; an actual cut plus dovish language would boost valuations.
Soft Landing Narrative — If inflation continues easing without a major growth slowdown, growth stocks could re-rate higher.
Yields
10-Year Treasury back toward 3.8–4.0% — Lower yields reduce discount rates on future tech earnings, historically supportive for QQQ.
Earnings
"Mag 7" beating expectations in Q3 & Q4 — Nvidia, Microsoft, Apple, and Amazon need to deliver both EPS beats and strong guidance, keeping AI momentum intact.
Broad Participation — More than 65–70% of Nasdaq-100 above their 50-day MA would confirm strength beyond a few leaders.
2️⃣ Technical Path
Current Level: ~$573
Immediate Resistance: $577–580 (recent intraday highs)
Sustained closes above $580 with expanding breadth and volume is a breakout trigger
QQQ’s top end from an extended channel projection ~$590–595
Measured move from March–July base (~$520–$560 = $40 range; breakout above $560 projects ~$600)
~61% of QQQ stocks are above their 200d SMA, but only ~48% above 50d SMA
50d (%) above 60–65%
New highs consistently > 8–10% of index components
Risks
Core CPI remains sticky (like the latest 3.1% YoY) which delays Fed cuts
Geopolitical/tariff shocks hitting supply chains or tech exports
Earnings misses from big AI names which reverses sentiment
Yield spike above 4.4% on the 10-year (valuation compression)
Break $580 in late August–September on dovish Fed + solid earnings = $600 by Q4
Fed cuts + AI blowout earnings = $600 by late September.
Core inflation sticky + yields up = stall at $580, retest $550 before YE
QQQ What could go wrong?
Bulls are riding the tailwind of weakening headline inflation, buyer-friendly rate outlooks, and AI/tech strength.
Bears flag concerns around persistent core inflation, lofty valuations, technical caution, and long-term risk exposure—especially if QQQ’s momentum disintegrates
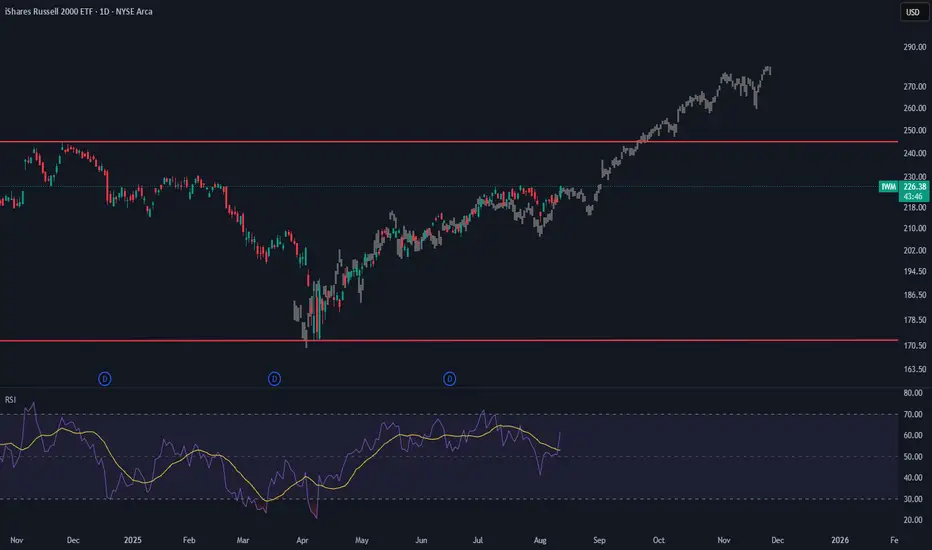
IWM: Just a patternHello,
Looks like it is following this pattern, nothing much.
Might work or not, just saw it and thought of putting it here.
Thanks AMEX:IWM
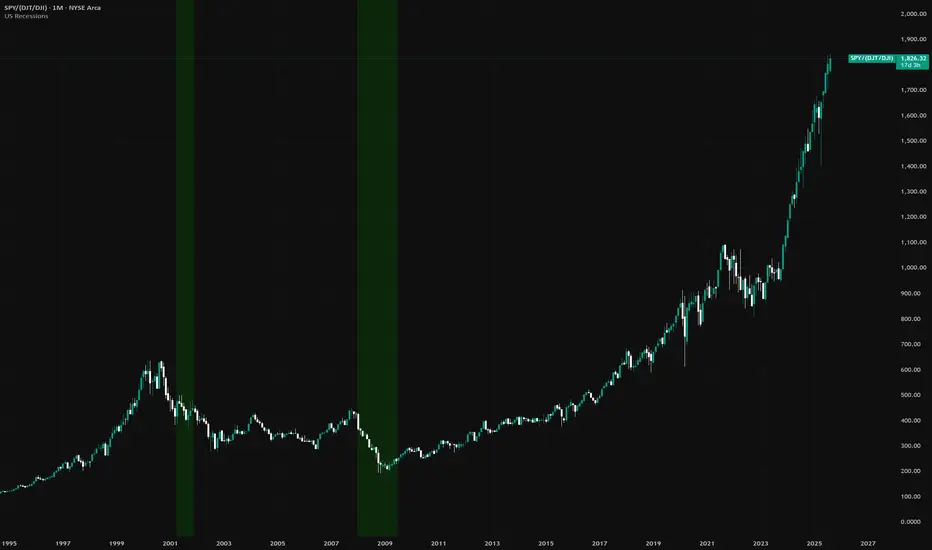
S&P 500 Outperformance vs. Transportation–Industrial BenchmarkAMEX:SPY SP:SPX DJ:DJT TVC:DJI
The current level of the SPY/(DJT/DJI) ratio reflects one of the most extreme divergences in decades, with the S&P 500 outperforming transportation and industrial benchmarks by a margin far exceeding prior cycle peaks. This kind of vertical move has historically proven unsustainable, as seen in 2000 and 2021, when similar surges were followed by significant mean reversion. The disparity suggests that market gains are being driven disproportionately by a narrow group of large-cap equities rather than broad-based economic strength. Unless transportation and industrial sectors begin to catch up, history points toward an eventual pullback in the S&P 500 as this imbalance corrects.
Godspeed, the bubble is here. Remember what it's like.
Spying on Your Trading FutureIn my past posts, we’ve explored a different way of looking at trading — one that’s less about “being right” on every trade and more about seeing the bigger picture.
We talked about expected value as the trader’s true “laser vision” — the ability to project the future of your account rather than the price of a single asset. We also saw how looking at results in blocks, rather than one trade at a time, helps remove the emotional weight that comes from obsessing over each outcome.
Now, we’re ready to take this one step further.
It’s one thing to calculate an average from past trades — it’s another to use that number to imagine and measure the possible futures of your system. This is where probability and a few simple tools can turn a set of trading rules into a system you can test, stress, and trust.
Over the next two posts, we’ll keep things intuitive, but we’ll open the toolbox a bit wider: First, we’ll talk about expectancy in action: how the average result grows more reliable over time, and how Monte Carlo simulations can show us the range of possible equity paths — including the unlucky ones.
Then, we’ll look at risk management as the engine that makes expectancy work in real life. We’ll explore how much to risk per trade, why betting more isn’t always better, and how to find the sweet spot between growth and survival.
Think of this as moving from reading a map to running real simulations of the journey ahead. You’ll see your trading system not as a mystery box but as a process you can measure, adjust, and manage — all without turning into a mathematician overnight.
I promise you that in the next two posts, I’m going to turn these technical ideas into practical, actionable lessons. You’ll see exactly how to apply them to your own trading — and once you do, you’ll never look at a trading system the same way again.
And of course, I’ll share the visual examples and a downloadable Python notebook so you can experiment with your own data.
Nightly $SPY / $SPX Scenarios for August 12, 2025 🔮 Nightly AMEX:SPY / SP:SPX Scenarios for August 12, 2025 🔮
🌍 Market-Moving News 🌍
🇨🇳 Tariff Truce Extended 90 Days
The White House signed an order late Monday extending the U.S.–China tariff pause by 90 days—removing a key overnight risk into CPI day. Watch AMEX:SPY / SP:SPX , TVC:DXY , NASDAQ:TLT for the reaction.
💵 Dollar Firms Into CPI
The dollar edged higher ahead of this morning’s inflation print as traders recalibrate rate-cut odds; stocks and long U.S. yields were choppy into the release.
🗓️ Quiet Tape, Big Catalyst
Futures and global markets stayed cautious into CPI; positioning is tight after Monday’s drift lower.
📊 Key Data Releases & Events (ET) 📊
📅 Tue, Aug 12
6:00 AM — NFIB Small Business Optimism (July).
8:30 AM — CPI (July) & Core CPI (official BLS release).
10:00 AM — Richmond Fed Pres. Tom Barkin speaks (Chicago; 9:00 CT).
10:30 AM — Kansas City Fed Pres. Jeff Schmid speaks (9:30 CT).
2:00 PM — Monthly U.S. Federal Budget (July) (Treasury MTS, 8th business day).
⚠️ Disclaimer: Educational/informational only — not financial advice.
📌 #trading #stockmarket #economy #CPI #Fed #SPY #SPX #DXY #TLT
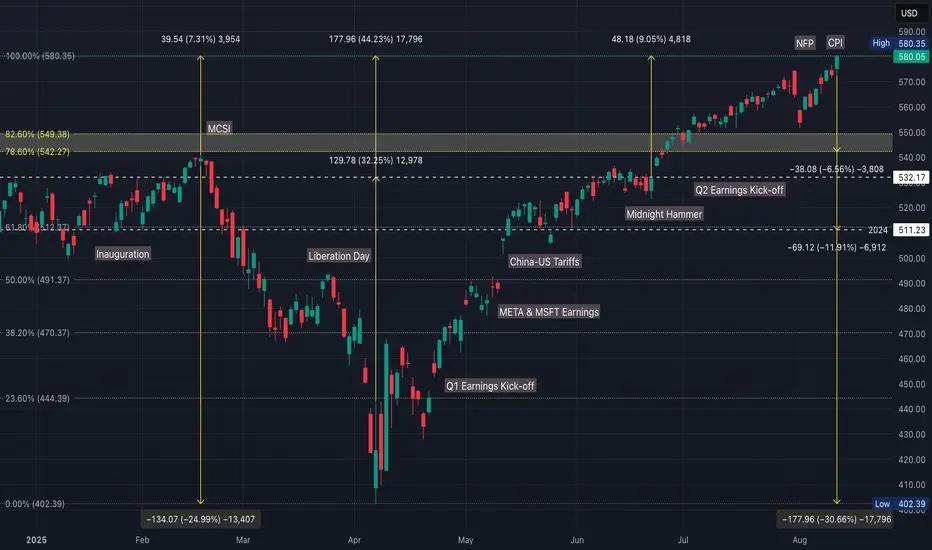
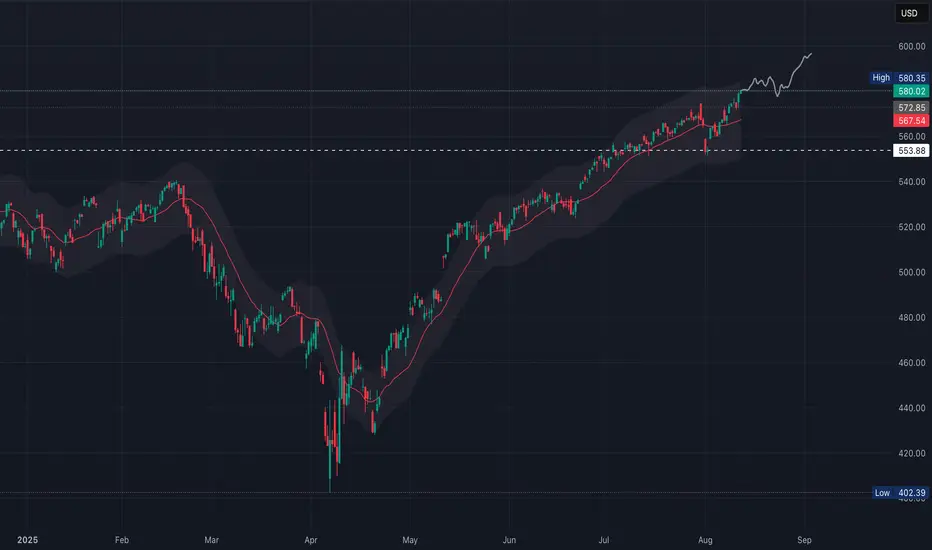
Has QQQ topped? Levels to the downsideI think we've seen a top here with the reversal that happened today. My levels held on SPY and that makes me more convinced the Nasdaq will have the same fate.
The top looks much clearer on Nasdaq futures. We have a double top, should the highs of today hold.
If you were to run a trend line through price, you'd see that all we've done on this rally is backtested the trend line from the April lows and have found resistance.
I think the next move is likely a large move down towards the lower support levels. Potentially CPI tomorrow is the catalyst.
Let's see where we end up, but I think it'll be one of the lower support levels should the highs hold throughout the week.