Principal Value ETF Quote | Chart & Forecast SummaryKey Indicators On Trade Set Up In General
1. Push Set Up
2. Range Set Up
3. Break & Retest Set Up
Notes On Session
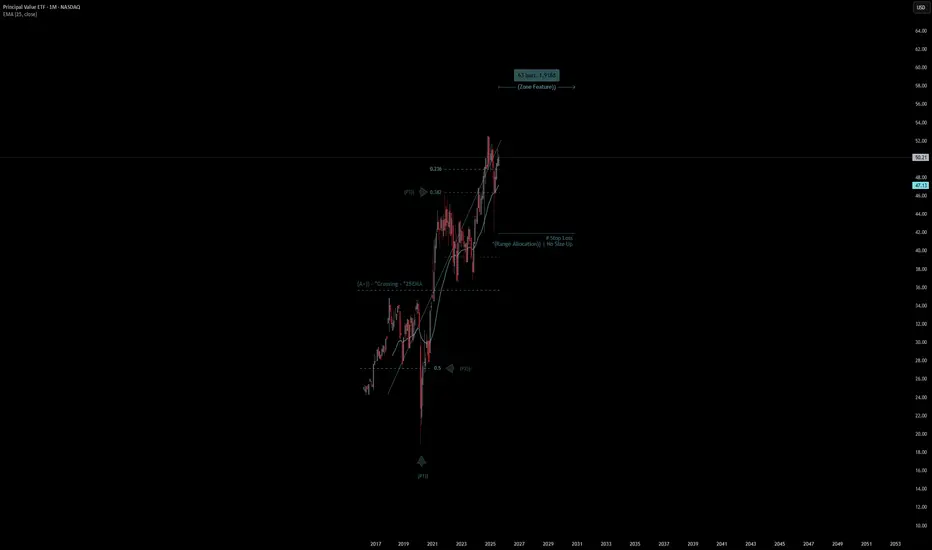
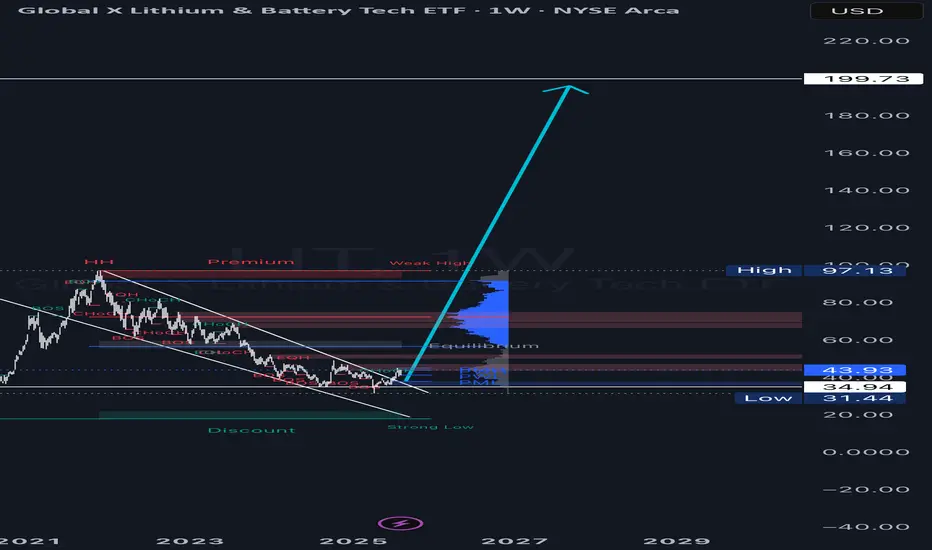
# Principal Value ETF Quote
- Double Formation
* (A+)) - *Crossing - *25EMA | Subdivision 1
* (Range Allocation)) | No Size Up | Completed Survey
* 63 bars, 1.918d | Date Range Method - *(Uptrend Argument))
- Triple Formation
* (P1)) / (P2)) & (P3)) | Subdivision 2
* Weekly Time Frame | Trend Settings Condition | Subdivision 3
- (Hypothesis On Entry Bias)) | Regular Settings
* Stop Loss Feature Varies Regarding To Main Entry And Can Occur Unevenly
- Position On A 1.5RR
* Stop Loss At 42.00 USD
* Entry At 48.00 USD
* Take Profit At 59.00 USD
* (Uptrend Argument)) & No Pattern Confirmation
- Continuation Pattern | Not Valid
- Reversal Pattern | Not Valid
* Ongoing Entry & (Neutral Area))
Active Sessions On Relevant Range & Elemented Probabilities;
European-Session(Upwards) - East Coast-Session(Downwards) - Asian-Session(Ranging)
Conclusion | Trade Plan Execution & Risk Management On Demand;
Overall Consensus | Buy
ETF market
Is iShares Russell 2000 ETF Setting Up for a Bullish Breakout?Current Price: $220.32
Direction: LONG
Targets:
- T1 = $226.04
- T2 = $231.21
Stop Levels:
- S1 = $218.54
- S2 = $216.78
**Wisdom of Professional Traders:**
This analysis synthesizes insights from thousands of professional traders and market experts, leveraging collective intelligence to identify high-probability trade setups. The wisdom of crowds principle suggests that aggregated market perspectives from experienced professionals often outperform individual forecasts, reducing cognitive biases and highlighting consensus opportunities in iShares Russell 2000 ETF.
**Key Insights:**
The iShares Russell 2000 ETF (IWM), a benchmark for U.S. small-cap stocks, is in consolidation mode after modest underperformance compared to large-cap indices like the S&P 500. Technical signals suggest a potential bullish setup as long as key support levels hold. Breakouts above resistance might reintroduce momentum for long-term gains. This setup comes at a time when large-cap movements may create spillover opportunities for the broader market.
The ETF is currently navigating a support zone, where the behavior of price action will determine its trajectory. Experienced traders emphasize watching for an ascending wedge pattern, signaling upward momentum as long as the $218 support holds firmly.
**Recent Performance:**
IWM has faced short-term bearish pressure despite maintaining its position above significant long-term moving averages. The ETF is trading in a neutral-to-bearish zone with sideways movement, reflecting investor uncertainty around small-cap stocks. While the past few months have seen moderate dips, the ETF has managed to remain resilient, stabilizing within a consolidation range.
**Expert Analysis:**
Financial analysts cite that current technical patterns favor a cautious approach but highlight potential upside if resistance levels near $225.69 are breached. This move could trigger a bullish continuation rally within the small-cap sector. Conversely, a close below $218.72 may signal deeper bearish trends. Experts also note that small-cap stocks could benefit from the so-called "January Effect," where historically, small-cap equities tend to outperform at the beginning of the year, a seasonality factor worth considering.
**News Impact:**
Broader macroeconomic concerns, including inflation and interest rate uncertainty, continue to dampen sentiment in the small-cap market. Additionally, weaker earnings reports from companies within the Russell 2000 Index have dampened enthusiasm. However, the release of positive economic data, including improved employment numbers and GDP growth, along with progress in diplomatic discussions, could spark renewed interest in U.S. smaller-capitalization equities.
**Trading Recommendation:**
The iShares Russell 2000 ETF is poised for potential upside as long as support levels at $218 are defended. Traders are encouraged to take a longer-term bullish stance with targets at $226.04 and $231.21. However, it is crucial to manage risks, with stop levels placed at $218.54 and $216.78 to safeguard positions in case bearish pressure resumes. Continued monitoring for breakout signals will be key for successful execution.

Industrial Sector Turnaround: Trading Strategy for XLI Next WeekCurrent Price: $150.83
Direction: SHORT
Targets:
- T1 = $147.50
- T2 = $145.00
Stop Levels:
- S1 = $153.00
- S2 = $155.00
**Wisdom of Professional Traders:**
This analysis synthesizes insights from thousands of professional traders and market experts, leveraging collective intelligence to identify high-probability trade setups. The wisdom of crowds principle suggests that aggregated market perspectives from experienced professionals often outperform individual forecasts, reducing cognitive biases and highlighting consensus opportunities in XLI.
**Key Insights:**
XLI (Industrial Sector ETF) shows signs of an overbought condition after its recent rally, suggesting an elevated probability of a short-term price correction. Rotational trends in the market are directing investor interest towards retail and consumer discretionary sectors, creating headwinds for industrial equities. Professional traders anticipate a temporary loss of momentum in the industrial sector as macroeconomic data and sector rotation align against the current overextension.
Fundamentally, XLI's valuation has diverged from its recent price action, reflecting residual momentum rather than organic growth or earnings-driven support. This dynamic, combined with limited capital inflows into sectors like industrials, strengthens the bearish case short-term, with support levels at $147.50 and $145.00 being key points of interest to monitor.
**Recent Performance:**
XLI has exhibited strong momentum over the past month, climbing steadily to its current price of $150.83. However, the ETF’s recent rally has pushed it into overbought territory as measured by technical indicators, with RSI levels suggesting unsustainable upward momentum. This performance aligns with broader cyclical trends in the S&P 500, where sector rotation has begun to emerge as a dominant theme.
**Expert Analysis:**
Several market analysts have voiced concerns over the prolonged rally in industrial equities, emphasizing that most of the potential upside from near-term catalysts is already priced in. Historical trading patterns for XLI suggest that overbought conditions typically precede modest pullbacks, especially in environments where rotational market flows favor sectors outside industrials. Analysts emphasize caution in adding further exposure at these levels, recommending instead a watchful eye on support zones nearing $147.50.
Technically, key resistance near $155.00 places a ceiling on short-term potential gains, while a breach of the $150.00 level could trigger broader selling pressure. Experts remain bullish on industrials in the medium-to-long term but highlight short-term risks due to fading momentum and a sector rotation narrative.
**News Impact:**
Recent economic reports did not bring any significant breakthroughs for the industrial sector, leaving investors to focus on broader market dynamics. Nevertheless, monetary policy updates and shifting sentiment towards less cyclical sectors could weigh on XLI in the immediate term. The lack of strong upward catalysts means that industrial equities must rely on support levels below current prices to stabilize.
**Trading Recommendation:**
In the short term, a bearish position on XLI is advised as the ETF shows significant signs of overbought conditions and aligns with broader rotational trends favoring other market areas. Traders are encouraged to target $147.50 (T1) and $145.00 (T2) while employing disciplined stop-loss levels at $153.00 (S1) and $155.00 (S2) to manage risk effectively. This setup offers a favorable risk-to-reward scenario for capitalizing on the sector's short-term pullback expectations.

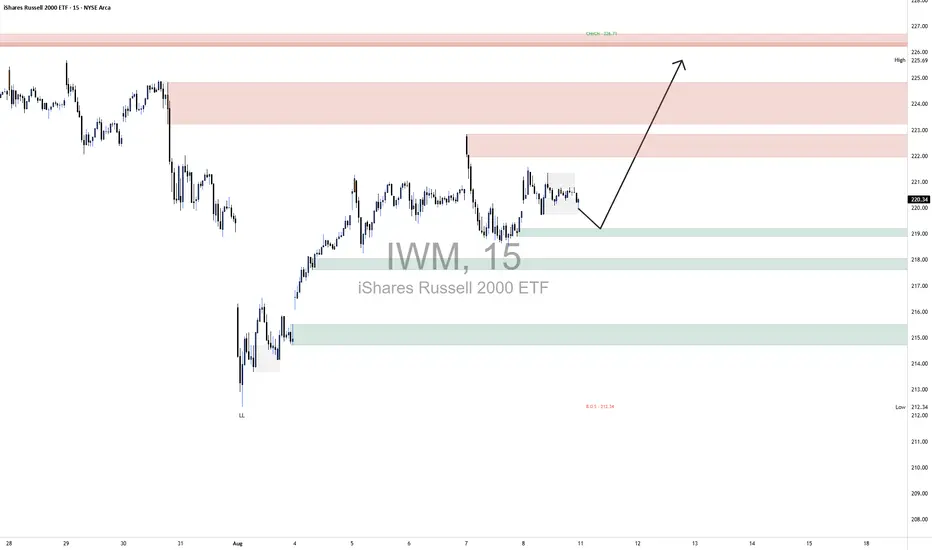
IWM LongOn the 15-minute IWM chart, the broader market structure recently shifted from bearish to bullish after printing a Change of Character (CHoCH) at 226.71, breaking above a prior lower high and signaling a potential reversal. This came after a strong rally from the 212.34 BOS point, where price had previously broken down and set a lower low. The current structure suggests buyers are attempting to reclaim control, and the higher-low pattern forming supports a continuation bias.
Demand is clustered between 217.80–218.80 and a deeper zone at 214.50–215.50. In both areas, buyers stepped in decisively in the past, causing swift upward moves, which marks them as strong zones. Supply is layered between 222.80–224.00 and 226.00–227.00. Price dropped sharply from both these regions previously, showing that sellers were aggressive there, with the upper zone being the key resistance tied to the CHoCH level.
In the marked region, price is consolidating just above the 218s demand zone, holding structure while failing to break higher immediately. This suggests a likely short pullback into the 218.00–218.80 area to reload buy orders before pushing toward the 224.00 mid-supply and possibly retesting the 226.71 high.
Trade bias: Bullish
Expected direction: Higher after a shallow pullback into demand
Invalidation level: A break below 217.80 would undermine the bullish setup
Momentum condition: Slightly favors buyers, with price maintaining higher lows despite stalling at resistance
Candle behavior: Small-bodied candles in consolidation, indicating accumulation rather than heavy selling
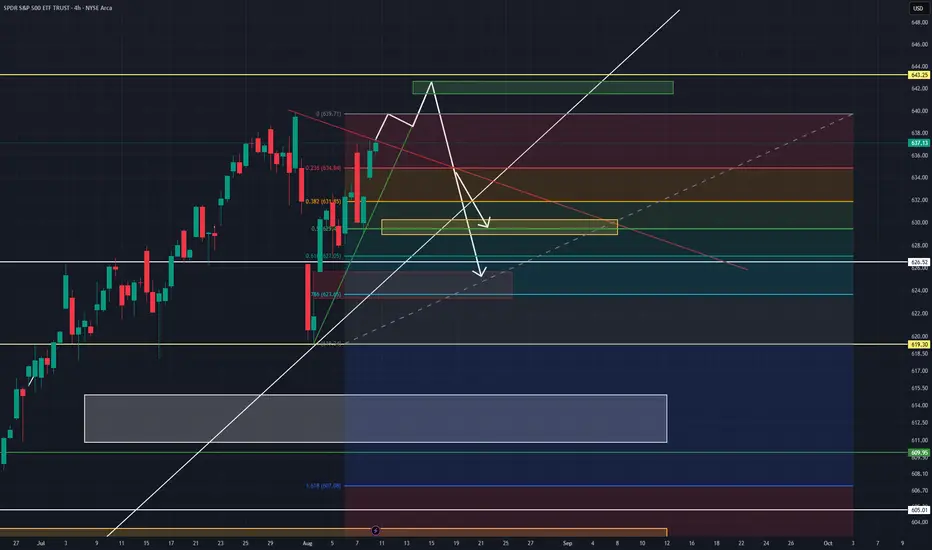
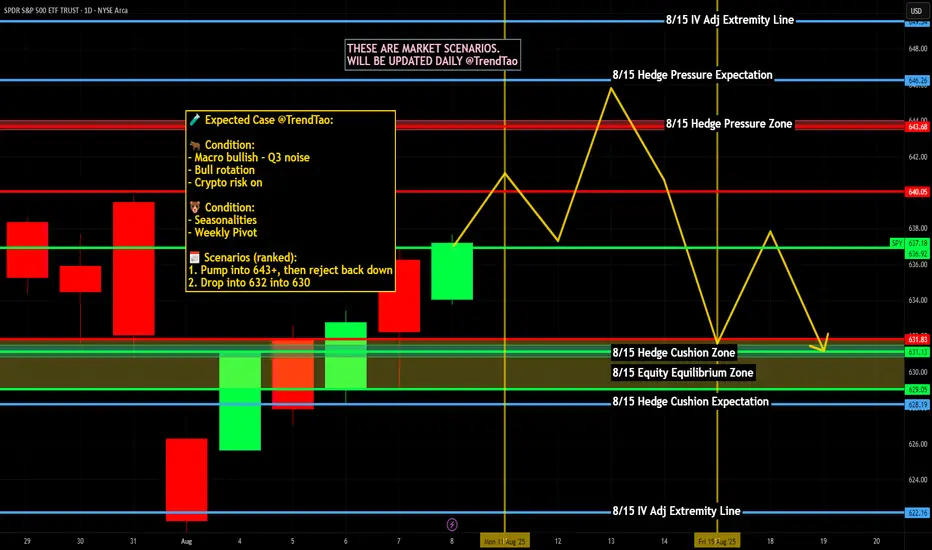
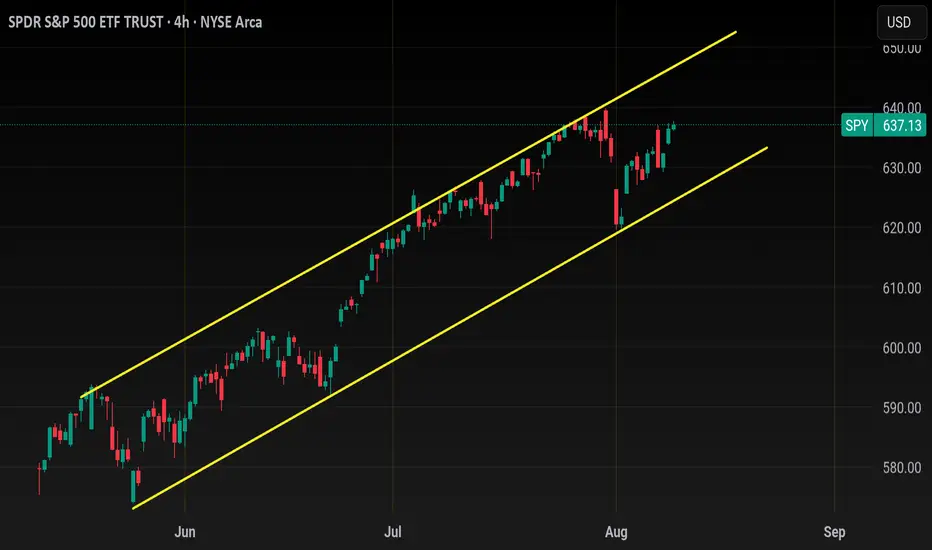
Spy looking to jump and dump? August 11-22This week watching AMEX:SPY I am looking at the Spy's rsi on a few time frames wanting more bullishness but lacking the strength. Watching some data this week or any news- this might be the catalyst to achieve the clear want for more upside (642-645) before any further flush. I see us, in this bullish case, to touch highs again and possibly test it or go a bit higher before playing out the bearish divergence and weakness that has been showing on the Adx, rsi, and price action (candles) over the last 2 weeks. I still see a flush this weak based on lack of strength in adx, and rsi possibly down to 624- 619 if not this week, next.
I also see the possibility due to weakness again that we drop immediately this week instead of a 14 day outlook this could very well be playing out this week, again maybe with the assistance of the data incoming this week. In this case if we drop before Wednesday I feel like the weakness will possibly be completed and we will see returning bullishness by end of week Friday or Monday- Tuesday next week. We are very low on the adx, meaning I do see big movement coming and good opportunity to be Ready and Prepared.
watch key support and resistance lines drawn horizontally and angled around trends and gathering of price action. A break of the lines could signal key support (bullishness) or key resistance (bearish) levels. Pay attention to places of interest and watch the bull v bear volume this next few days.
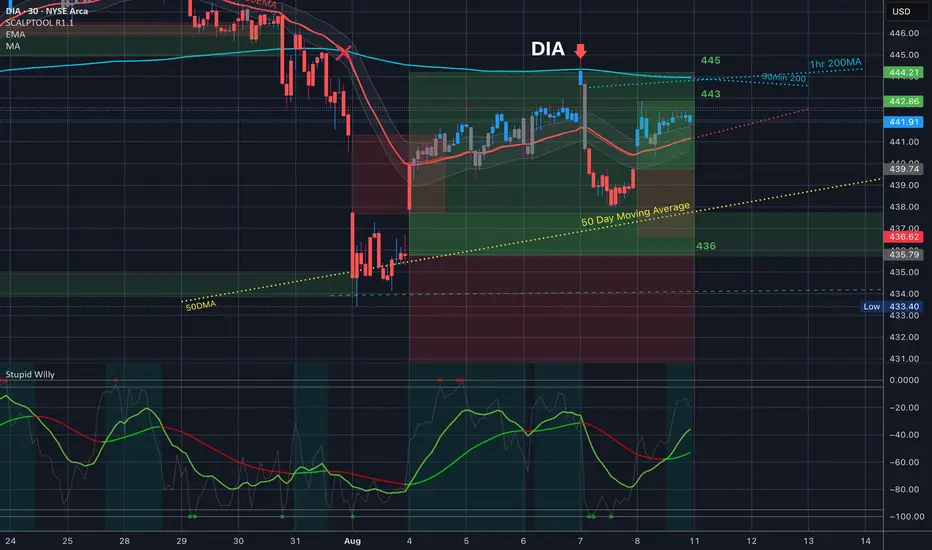
$DIA Closed in the Expected Move // Last Friday review
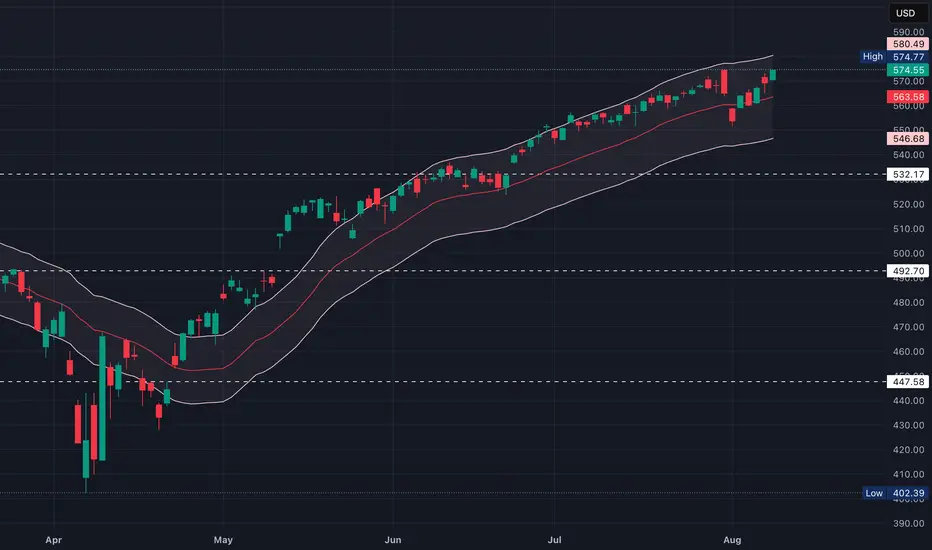
I absolutely love when price respects technicals and options. The Thursday gap up and rejection was so beautiful and we see, just like in IWM, the 30min and 1hr 200MA’s acting as resistance, and even more perfect it lined up with the top of the implied move at 445.
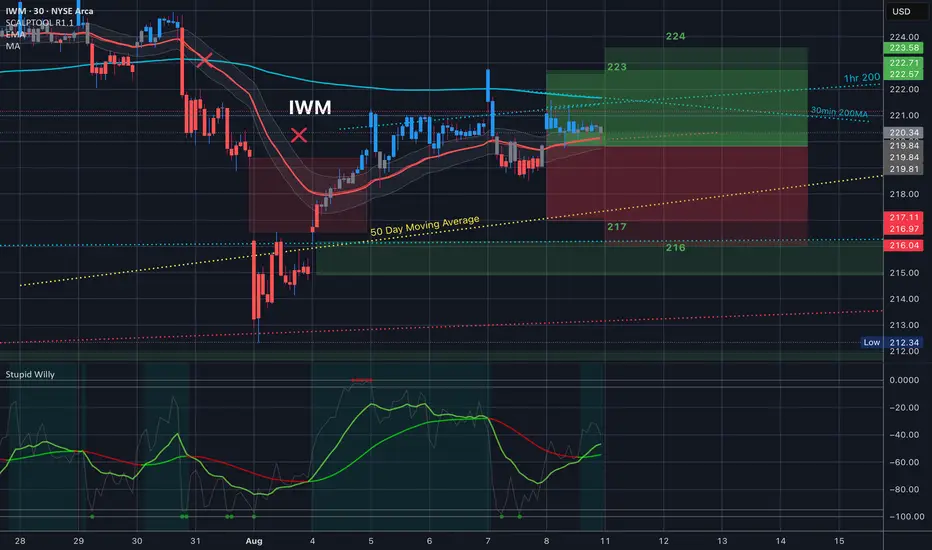
$IWM 30min200 & 1hr200 resistance // Last Friday reviewAMEX:IWM 30min200 & 1hr200 resistance // Last Friday review
Look at how the 1hr 200 and then the 30min 200 have been acting as resistance - and then how they potentially cross in tomorrow’s trading range, with the 35EMA (red line) underneath both of them.
We did start the week gapping up off of the 50Day moving average and we held that!!
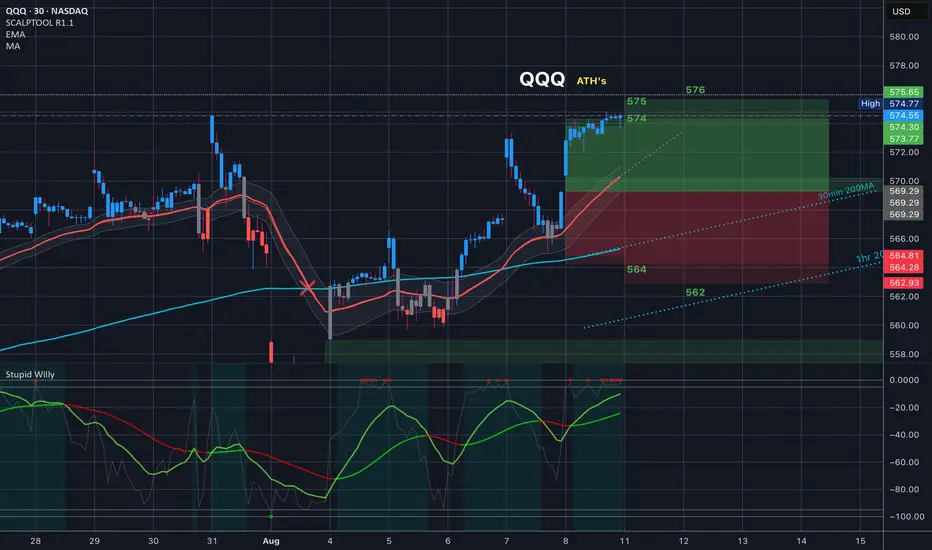
$QQQ Made new ATH’s // Last Friday review
QQQ made new ATH’s on Friday. Be careful spread traders QQQ has been blowing through the top of the trading range, but also because we did take it to the top of the trading range I would think we have a flat or down day here… 575/576 bear call spreads feel good to me. Do your own DD, but that’s what I’m looking at for tomorrow!!
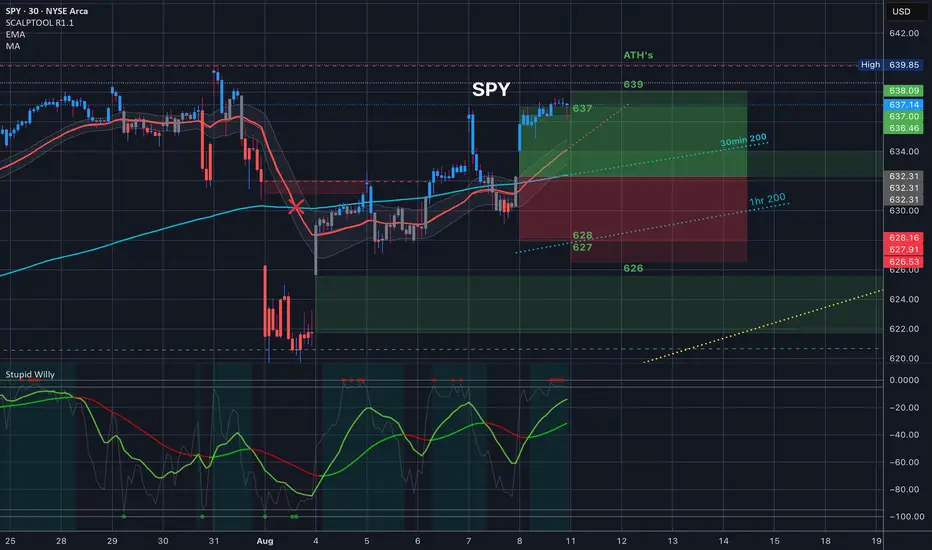
$SPY All Time High’s in view // Last Friday reviewThis is a review of last Friday’s price action. We opened with a gap up and a rally to the top of the implied move. We actually took it to the top of the 30 day average volatility, which rounded out was the same number 637.
The expected move for the next day (Monday) was 639 so spreads at 637/639 paid if you went in at 35% of the width of the spread (.70).
(hit GRAB THIS CHART) under the chart to populate my chart and setting onto your chart. 💃🏻
QQQ JUST FLASHED THIS SIGNAL FOR THE FIRST TIME SINCE 2019!!!A pattern has just showed up on QQQ for the first time in 6 years, and we have to talk about it because it has significant implications for the next 3 years of the stock market

Weekly $SPY / $SPX Scenarios for August 11–15, 2025🔮 Weekly AMEX:SPY / SP:SPX Scenarios for August 11–15, 2025 🔮
🌍 Market-Moving News 🌍
🇺🇸 Inflation Double-Header: CPI Tue + PPI Thu set the tone for AMEX:SPY / SP:SPX , rates, TVC:DXY , $TLT.
🏦 Fed Speaker Blitz: Barkin, Schmid, Goolsbee, Bostic—watch headlines for rate-path hints.
🛍️ Consumer Pulse Friday: Retail Sales + Industrial Production/Capacity Utilization = read on demand & output.
🧭 Keep it tight: Focus on CPI, PPI, Claims, Retail Sales, IP/CapU. Everything else is background noise.
📊 Key Data Releases (most impactful only) 📊
📅 Tue, Aug 12
• CPI (July) — Headline & Core (8:30 AM ET)
• Fed: Barkin & Schmid speak (10:00 AM ET)
📅 Thu, Aug 14
• Initial Jobless Claims (8:30 AM ET)
• PPI (July) — Headline & Core (8:30 AM ET)
• Fed: Barkin (2:00 PM ET)
📅 Fri, Aug 15
• Retail Sales (July) — Headline & Ex-Autos (8:30 AM ET)
• Industrial Production (July) (9:15 AM ET)
• Capacity Utilization (July) (9:15 AM ET)
• Consumer Sentiment (Prelim, Aug) (10:00 AM ET)
⚠️ Disclaimer:
Educational/informational only — not financial advice. Consult a licensed financial advisor before investing.
📌 #trading #stockmarket #economy #CPI #PPI #retailsales #Fed #SPY #SPX
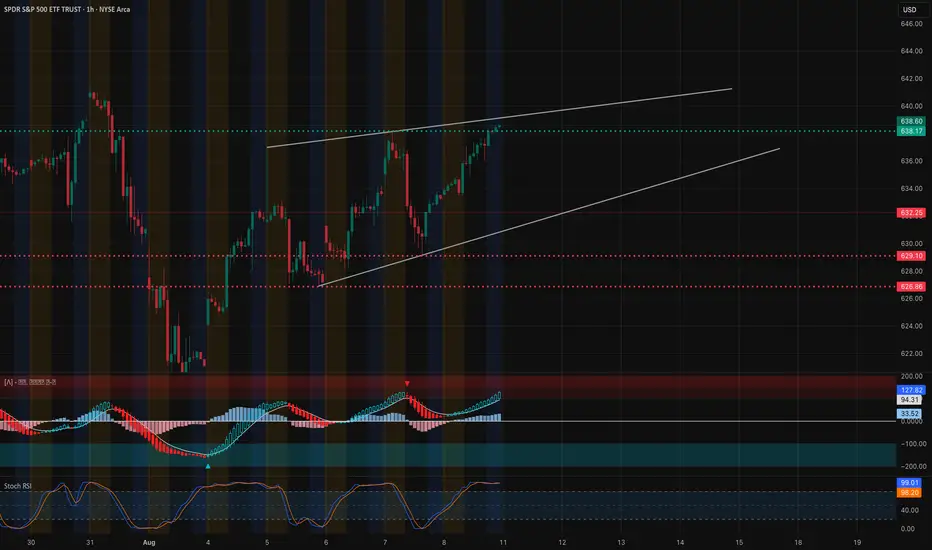
SPY Technical Analysis & GEX OutlookTechnical Analysis (1H Chart)
SPY is currently pressing into the upper boundary of a rising wedge pattern, approaching the 638–642 resistance zone. Price action has been in a controlled uptrend since the bounce from the 625 demand level, supported by higher lows. However, MACD shows strong momentum but is nearing extended territory, while Stoch RSI is overbought at ~99, signaling potential exhaustion. If price rejects at this wedge top, a pullback toward 632.25 (trendline & prior support) becomes likely. A clean breakout above 642 would invalidate the immediate bearish wedge bias and open a path to higher highs.
Key Support Levels:
* 632.25 – First support / trendline confluence
* 629.10 – Major shelf support
* 626.86 – Last strong demand zone before breakdown
Key Resistance Levels:
* 638.17 – First upside target
* 642.35 – Rising wedge breakout level & gamma wall
GEX & Options Sentiment
Options data shows the highest positive NET GEX at 638.60 (CALL resistance / gamma wall), with additional resistance stacking at 642. These levels act as dealer short gamma zones, meaning moves into them could slow unless there’s significant buying pressure. On the downside, large PUT support sits at 631 and heavier protection at 625 — losing this level could accelerate downside momentum.
Options Flow Snapshot:
* IVR: 12.4 (low vol environment; cheaper premiums)
* Call positioning concentrated at 638 & 642
* Put positioning heavier below 631, especially at 625
* GEX: Mildly bullish bias as long as SPY stays above 631
Trade Thoughts:
* Bullish Scenario: Break and hold above 642 → Target 646–648; favor short-dated calls or debit spreads while IV is low.
* Bearish Scenario: Rejection at 638–642 → Short with puts targeting 632, then 629.
* In both cases, watch for momentum shift as Stoch RSI resets.
Disclaimer: This analysis is for educational purposes only and is not financial advice. Always manage risk and trade according to your plan.
QQQ Technical Analysis & Options Sentiment Outlook. Aug. 11
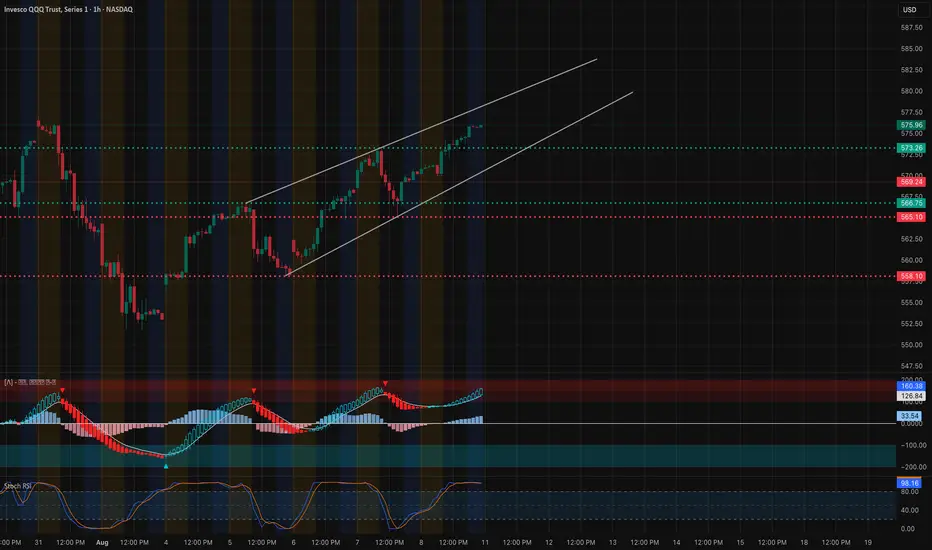
Technical Analysis (1H Chart)
QQQ is trading at $575.96, continuing to ride inside a well-defined ascending channel. The price action shows consistent higher highs and higher lows, with the current test near the upper boundary of the channel. Immediate resistance sits at 577–578, where the previous swing high and channel top converge. A breakout above 578 could open the path toward 580–582.5, aligning with the upper channel projection.
On the downside, the first support is at 573.2 (recent breakout zone), followed by 569.2 and 566.7 as deeper pullback levels. The MACD remains bullish with widening histogram bars, but Stoch RSI is overbought (>95), suggesting potential short-term consolidation or a minor pullback before continuation.
Bullish Scenario: Break above 578 with strong volume can push toward 580–582.5.
Bearish Scenario: Failure at 577–578 with rejection could bring a pullback toward 573.2 and possibly 569.2.
GEX / Options Sentiment (1H View)
* Key Call Walls:
* 577.00 – Highest positive NET GEX / Gamma Wall resistance
* 574.00–575.00 – 3rd Call Wall (54.5%)
* 572.00 – 2nd Call Wall (55.78%)
* Key Put Walls:
* 571.00 – 3rd Put Wall (-6.95%)
* 565.00–566.00 – HVL support & PUT wall
* 560.00 – Strong PUT support (-59.08%)
* GEX Bias: Positive above 572–573, meaning upside moves may slow due to dealer hedging, but still favor controlled grind higher. Negative GEX below 571 signals accelerated selling potential.
* Options Flow: Puts at 53.9% indicate a slightly defensive stance despite the bullish price structure. IVR is low at 11.7, suggesting cheaper options pricing.
Options Strategy Thoughts:
* Bullish Swing: Call debit spreads targeting 580–582 if price confirms above 578.
* Bearish Hedge: Short-term puts or put spreads if rejection at 577–578 aligns with overbought conditions.
* Neutral: Consider selling iron condors around 565–580 range if expecting channel-bound trade before a breakout.
Disclaimer: This analysis is for educational purposes only and does not constitute financial advice. Always do your own research and manage risk before trading.
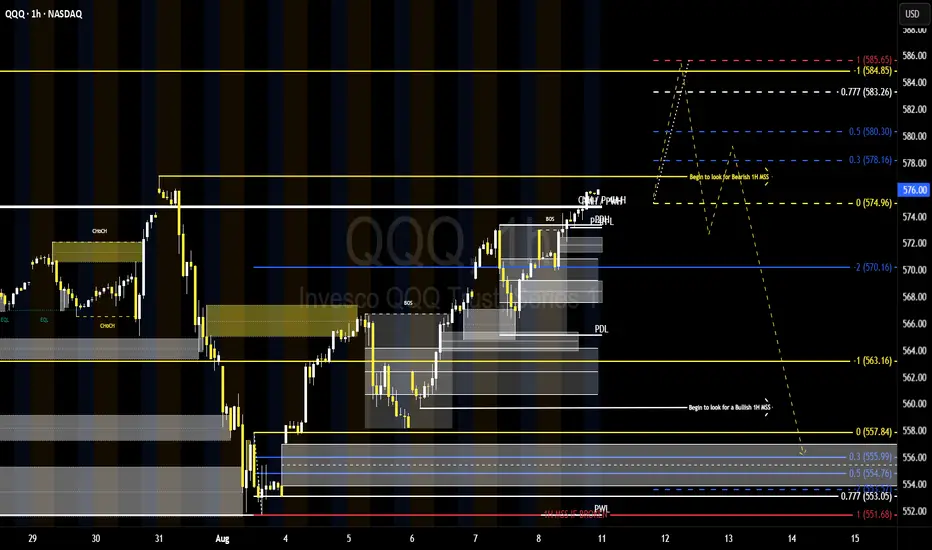
583–585 or Bust? QQQ Tests the CeilingQQQ 1H – FVGs, MSS & COT Positioning
Price is pressing into the 574–576 resistance zone, with upside liquidity resting toward 583–585 (FVG + Fib 0.777–1 confluence). A clean break above 576 could fuel a run into that zone, where I’ll watch for a Bearish 1H MSS setup.
If momentum stalls here, pullbacks toward 570 → 563 become likely, with a deeper test of the 557–560 FVG on a stronger breakdown—this is where I’ll look for a Bullish 1H MSS if structure shifts.
Latest COT data on NASDAQ-100 futures backs the caution: speculative longs have been cut while short positions increased, tilting sentiment bearish. This positioning aligns with potential rejection zones above, making the 583–585 area a key decision point for the next directional leg.
Key Levels:
Resistance: 574–576 → 583–585
Support: 570, 563, 557–560
QQQ: Bearish Continuation is Highly Probable! Here is Why:
Looking at the chart of QQQ right now we are seeing some interesting price action on the lower timeframes. Thus a local move down seems to be quite likely.
Disclosure: I am part of Trade Nation's Influencer program and receive a monthly fee for using their TradingView charts in my analysis.
❤️ Please, support our work with like & comment! ❤️
SpySo, all bearish weekly technicals from last week did not give a follow through. From experience, I've learned that if a stock closes bearish on the weekly candle then by Wed of the following week we should start heading lower and if that's not happening then I need to be open to upside.. Technicals analysis is not to be followed like the 10 commandments, it is a tool here to help take your trading/investment from a 50/50 gamble to a 80/20 Risk.
With that being said, in one of my previous Spy ideas I mentioned Spy 650, I think we are headed there now. I don't want to to rehash everything from that post so if you like , you can see the link at the bottom.
Market runs on tech...
This is where we stand with NASDAQ:QQQ
4 hour chart here
White line is our summer channel , the 3 green circles are highlighted to show uptrend validation. The yellow channel is our range from last week and I think this week we will continue trading inside to the upside.
We can either start the week with a pullback to 569 and trendline support before heading higher or we just grind higher from Monday
As of now things are only bearish back below 560..
Like said before, I think 585 will be the top on QQQ before the Fall reset and Sept correction.. But if you traded through Nov-Jan before you'd know that even a 10-15% correction in sept could be regained in that holiday squeeze (Seasonality).
AMEX:SPY
You are what you eat and Spy is identical to Qqq. Starting the week I wouldn't chase longs until price clears 640.00. A personal rule of mine when dealing with trading Spy is to wait for a 1$ move above or below previous resistance or support to short or long.
As you can see, the only time price has broken above 638 was with gap ups that flush back down so if you long anything early next week on Spy you should have stop below 637.00
634-637 is chopping range.
A lot of volume came in on that bearish engulfing on July 31st so 640 is the current hurdle and this is why I don't recommend longs below it.. in hindsight that july 31st move could've just been some last trading days of july shenanigans or some rotation
If price breaks below 634 then I like puts to 630.. ONLY BEARISH BELOW 625.00.
So yes, I'm looking for more upside this week because what I see on big tech; more specifically aapl wants higher, tsla is flirting a breakout and googl wants to close gap at 206.
AMEX:IWM
Small caps.. neglected like a middle child.
Lagged the market late week and at first glance it looks bearish, but when you zoom in ,
You'll see a triangle was born with lasts weeks price action. I circle the gap left over near 227 that would be the target of this triangle.
Iwm is bearish only below 218.00, below 218.00 and the triangle is invalid and we are headed back to the 200ma at 215 and below that 210.
How I would play the long side? Well you have 2 options,
1st - wait for a break over the daily 20sma and trendline resistance to long or calls above 222.00.
2nd. Buy near trendline support and price action around 219.50 - 220.00
Both long targets would be 225.50, price could melt to 227 gap close but I'd take profit at 225. As you can see , unrealized gains and turn into pain around 225..
In an extreme upside move you'd get this
But don't quote me on this unless price can close above 225 for the week.
TVC:DJI
Dow jones
Not much to right about Here, with exception of April's dip , price has pretty much range traded
And the fact that we are headed in to Sept leads me to belive we might not break over 45k this quarter.
The smaller price action of the last 2 weeks is similar to AMEX:IWM and without making a short story long I think a triangle is brewing here too. Triangle target would be gap close at 45k
As far as the triangle on TVC:DJI and AMEX:IWM
I think CPI or PPI will make or break so we will find out early in the week
Trade idea
The first is NASDAQ:AAPL
Weekly breakout of an ascending triangle here with a 13% measured move to 245 incoming
I think this week we get another high to 236-240
Me personally, I'm a sticker for entries, so I'd like to hop aboard on a slight pullback to 224-225, then ride it up to 240 gap close. An ascending triangle is the most explosive bullish pattern , and on top of that is this pattern took 4 months to make and consolidate so if I don't get a pullback amd price continues to melt up or 230 early in the week I'll understand but I won't chase
Let's see what happens, but I'll tell you this, after Wed you will see of strength from $aapl.
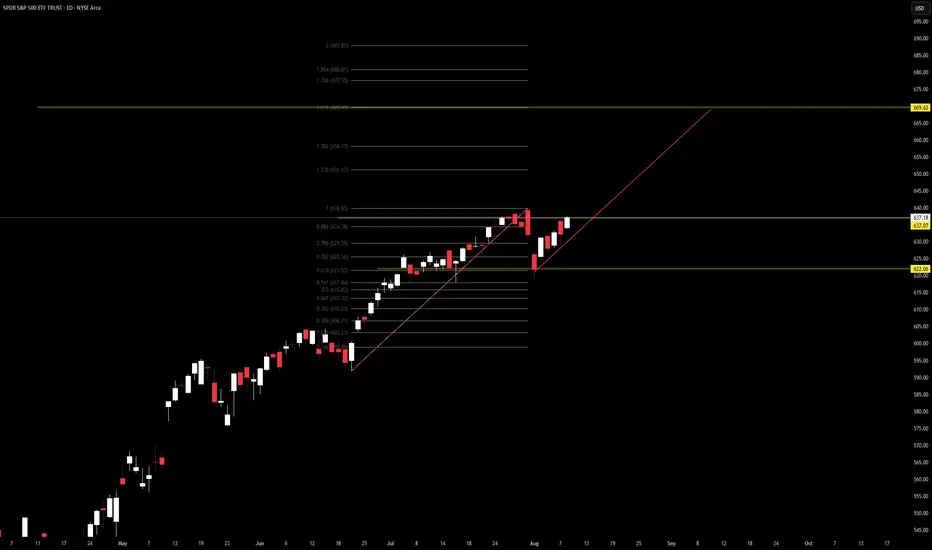
VolanX Macro & Technical Outlook — SPDR S&P 500 ETF (SPY)📊 VolanX Macro & Technical Outlook — SPDR S&P 500 ETF (SPY)
WaverVanir International LLC | Aug 10, 2025
Macro Context:
U.S. equities remain in a late-cycle rally phase, supported by liquidity flows and resilient earnings.
Fed policy uncertainty is easing; market participants are pricing in rate stability with a potential pivot in the next 6–9 months.
Geopolitical risk remains a latent factor but hasn’t disrupted risk-on sentiment.
Technical Structure (Daily Chart):
Primary Trend: Bullish continuation, respecting the ascending trendline.
Fib Levels: Price reclaimed the 0.786 zone ($629.59) and is pushing toward 0.886 ($634.38).
Current Resistance: $637.18 — breaking and holding above opens path to $669.62 (1.618 extension).
Support Levels:
Strong: $622.06 (Fib confluence)
Critical: $603.21 (trend invalidation zone)
Risk Assessment:
Upside Risk: Overextension into 1.618–2.0 Fib zones could precede sharp retracements.
Downside Risk: Loss of $622.06 could trigger accelerated selling toward $603.21.
Macro Correlation: High beta to liquidity conditions; strong dollar or bond yield spikes could dampen momentum.
Targets:
Near-term: $637.18 break confirmation → $651.17
Mid-term: $669.62 major target (1.618 extension)
Stretch: $687.81 (Fib 2.0) if macro tailwinds persist
VolanX Strategy Bias:
Positioning: Favor long bias with partial profit-taking at $651.17.
Risk Management: Tighten stops under $622.06 on swing positions.
Scaling Plan: Add on confirmed breakout of $637.18 with volume expansion.
💡 WaverVanir Takeaway:
This setup is a textbook late-cycle breakout structure with healthy retracements and controlled risk zones. Patience and disciplined scaling will be key in capturing the 1.618 target zone.
#VolanX #WaverVanir #SPY #Macro #TradingStrategy #FibAnalysis #RiskManagement #StockMarket
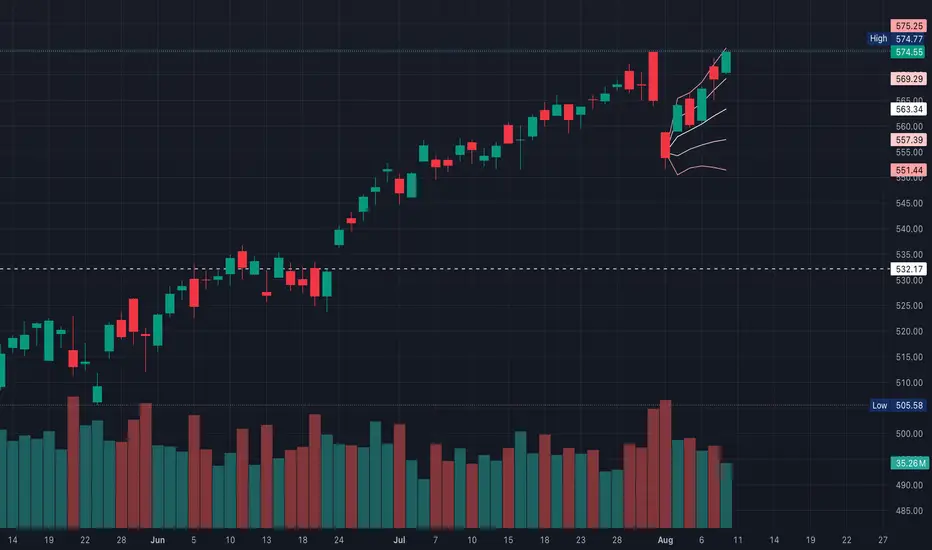
QQQ make or break?QQQ appears like it’s entering a make or break moment where breakouts above resistance run fast, but a failure often leads to a retest of recent support levels
Trend is still bullish with price above all short-term MAs, 5d EMA ($569.29) & 10d EMA ($563.34) as support
Volume is lower than the earlier push, which might suggest the rally is running on lighter participation or profit-taking
Immediate resistance is $575.25 so a break above with volume could trigger continuation toward $580
Support levels at $569.29, then $563.34, with stronger support around $557.39
Chart shows a bullish engulfing continuation pattern
The green candle’s body fully engulfs the prior small red candle’s body
It appears after a short pullback inside an overall uptrend
This is a continuation signal, not a reversal, since the trend was already bullish before it appeared
Given it’s pressing right against a recent high ($575.25), this may be a mini bull flag breakout attempt, but it still needs to close above that high to confirm
QQQ is at a prime reversal risk area
Price is testing resistance ($575.25) after multiple green closes (extended moves into resistance often attract profit-taking)
Volume is lighter on this push than earlier in the rally, showing less conviction
Price is several points above the 5d EMA ($569.29), so mean reversion risk is higher given short-term overextension
If Monday opens higher, but fails to break $575.25 & closes red, that would print a potential shooting star/hanging man depending on wick length, both bearish signs
So while the default bias is still up until support breaks, QQQ is at the inflection point where,
Break above $575.25 with strong volume, then a possible continuation higher
Failure & close under $569, then short-term reversal lower may play out
Some possible reversal levels on QQQ based on the chart
$575.25 - if price breaks above, but quickly rejects & falls back under this level on high selling volume, it’s a bull trap signal
$572.00 - a break below this with momentum increases reversal odds
A close below $569.29 (5d EMA) after Friday’s breakout attempt may be the first technical sign of reversal
The 10d EMA of $563.34 is the prior pivot low, so a close lower could possibly confirm a short-term trend shift
Some possible confirmation signals
Big upper wick near highs & red close on Monday may suggest a bearish candlestick confirmation
Spike in volume on a red candle may suggest that institutions are distributing at the top
RSI rolling over from overbought levels
If Monday opens strong, but stalls near $575.25, suggests a high-probability day trade short for a pullback to $569-$570
If price gaps above $575.25 & holds, the reversal risk is lower until at least $580
* I am not a licensed professional & these posts are for informational purposes only, not financial advice
Stock Market Forecast | TSLA NVDA AAPL AMZN META MSFTStock Market Forecast | CME_MINI:NQ1! CME_MINI:ES1! QQQ SPY
MAG 7 Forecast NASDAQ:TSLA NASDAQ:NVDA AAPL AMZN META MSFT GOOGL

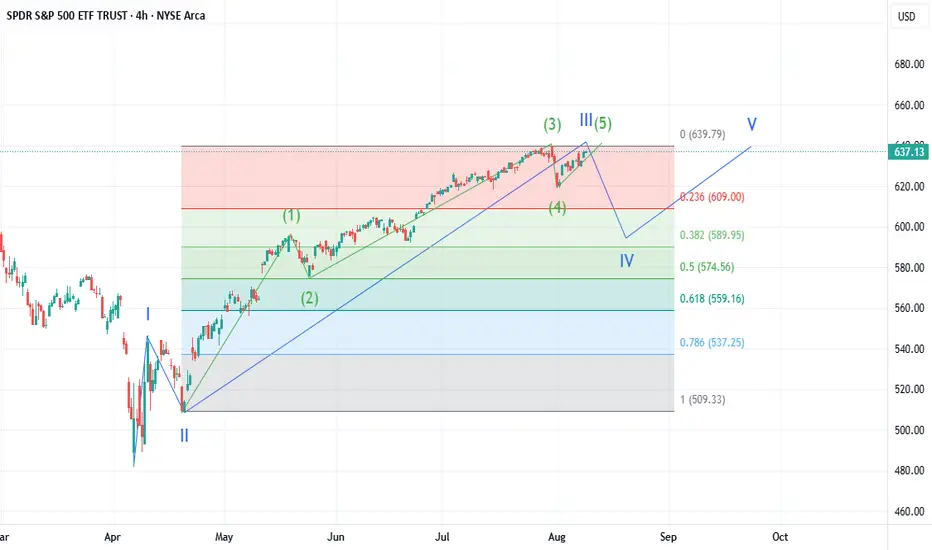
SPY: End of Wave 3Based on how I see the wave structure of SPY, SPX, NQ1, and QQQ, it seems more likely that we are at the end of Wave 3 rather than Wave 5. Over the next 2 to 4 weeks, I expect a sharp decline in SPY to 591 before a final rally to 640 - 660.
QQQ (8 August)Uptrend continues spite selective leadership - only 5.9% new highs
Target @ $564 for next week off a new high based on an expectation CPI/PPI is higher than expected which coupled with weakening growth expectations (GDP, housing, etc.) jinxes the narrative around September's rate cut hopes
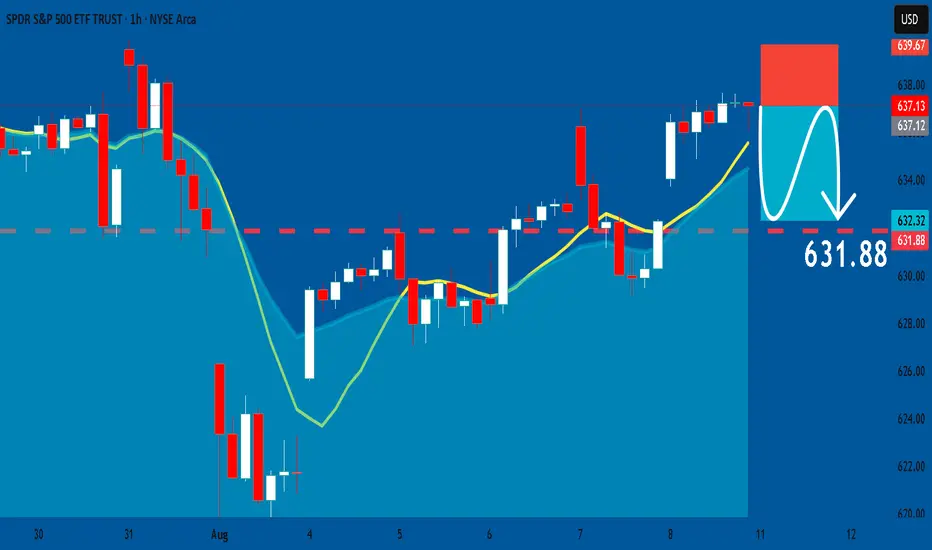
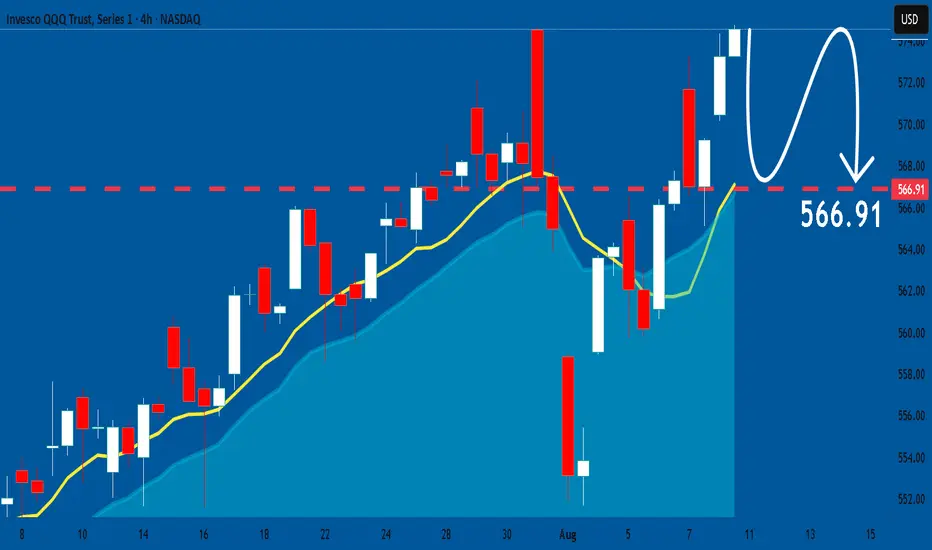
SPY: Short Trade with Entry/SL/TP
SPY
- Classic bearish formation
- Our team expects pullback
SUGGESTED TRADE:
Swing Trade
Short SPY
Entry - 637.13
Sl -639.67
Tp - 631.88
Our Risk - 1%
Start protection of your profits from lower levels
Disclosure: I am part of Trade Nation's Influencer program and receive a monthly fee for using their TradingView charts in my analysis.
❤️ Please, support our work with like & comment! ❤️