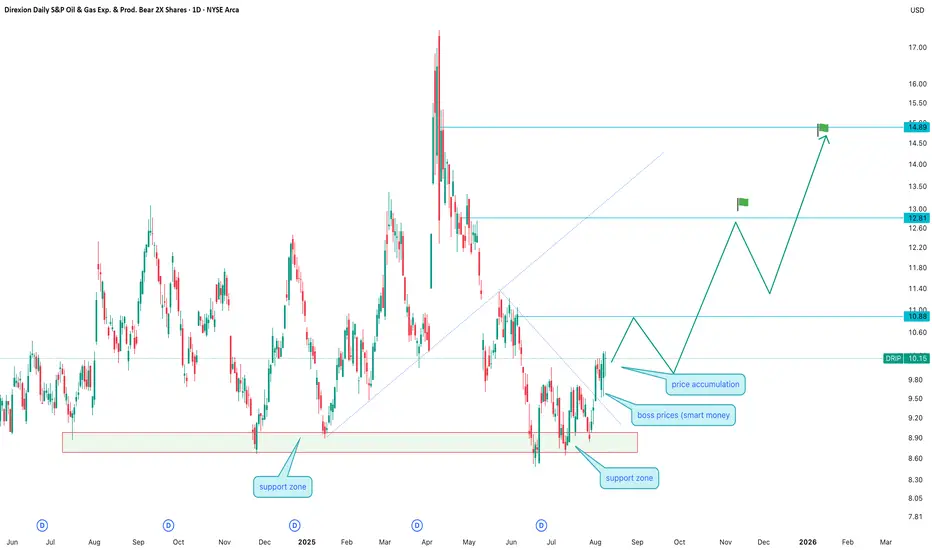
DRIP: the bear in an oilskin ready to huntDRIP: the bear in an oilskin ready to hunt
Technical analysis:
DRIP has built a solid support zone between 8.60–9.00, showing volume accumulation and smart money activity. After a recent bounce, the price broke above the 10.00 level and is holding above 10.15. The next resistance is at 10.88, followed by 12.81 and the strategic target of 14.89.
EMA and MA have turned upward, confirming a short-term trend change. MACD is moving toward the positive zone, while RSI remains neutral with room to rise.
Tactical plan: consider buying on a pullback to 10.00-10.15 with targets at 10.88, 12.81, and 14.89. Stop loss below 9.80.
Fundamental overview:
DRIP is an inverse ETF on the oil & gas sector, delivering 2x returns opposite to the market trend. Growing interest is linked to expectations of oil price declines amid potential commodity market correction, geopolitical instability, and seasonal demand slowdown. Another factor is possible OPEC+ announcements on production cuts, which could boost volatility.
Conclusion:
If oil prices stumble over geopolitical hurdles, DRIP might stage a rally where the only bored ones will be those left without a position.
ETF market
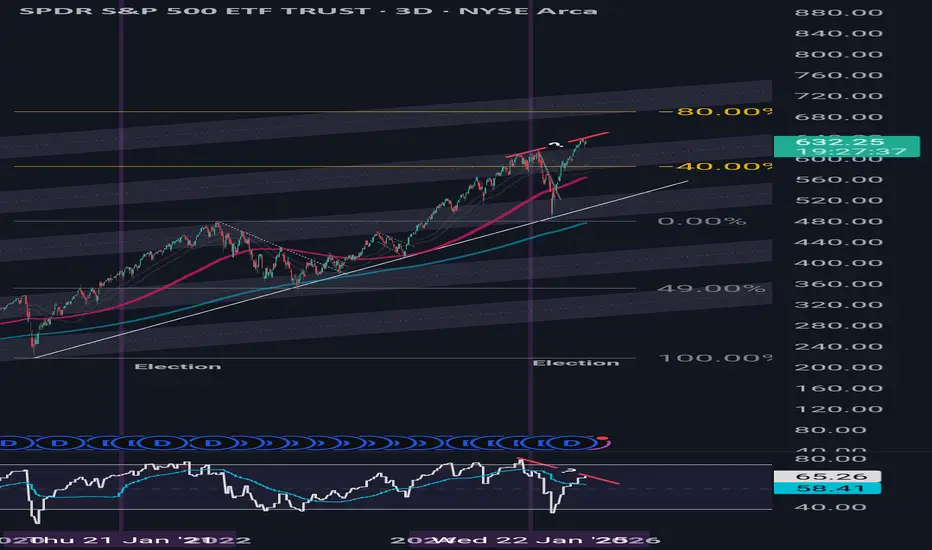
SPY | Bullish | Day Trading AMEX:SPY
SPY has confirmed a bullish structural shift on the 1H chart following the August 1st liquidity sweep.
Key Developments:
A Higher Low (HL) was formed after a significant breakdown and volume climax.
Price has since reclaimed the descending trendline and is now trading above all major EMAs.
Momentum continues to build, supported by:
A clean break of the 38.2% Fibonacci retracement (631.37)
Bullish RSI posture with values trending above 50
Volume profile showing absorption on red candles and confirmation on green
Target Levels:
635.26: Prior resistance and key structural target
637.51: Upper liquidity zone and TP2 based on extension geometry
Support & Risk Management:
Primary structural support: 631.00–630.70
Invalidation level: 629.50
As long as price holds above 631, I remain bullish and expect continuation toward the 635–637 range in the next 1–2 sessions. Pullbacks into the 631 zone would present a potential re-entry or add-on opportunity.

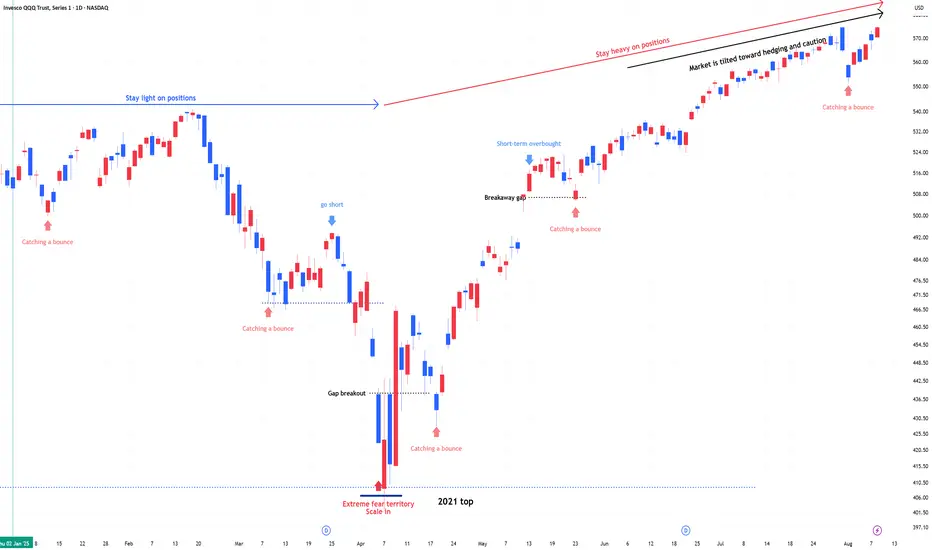
QQQ , Stay heavy on positionsQQQ , Stay heavy on positions. (QLD, TQQQ)
Despite the rebound, the market remains tilted toward hedging and caution.
In stay light on positions zones, I hold QQQ and reduce exposure.
In stay heavy on positions zones, I increase allocation using a mix of QLD and TQQQ.
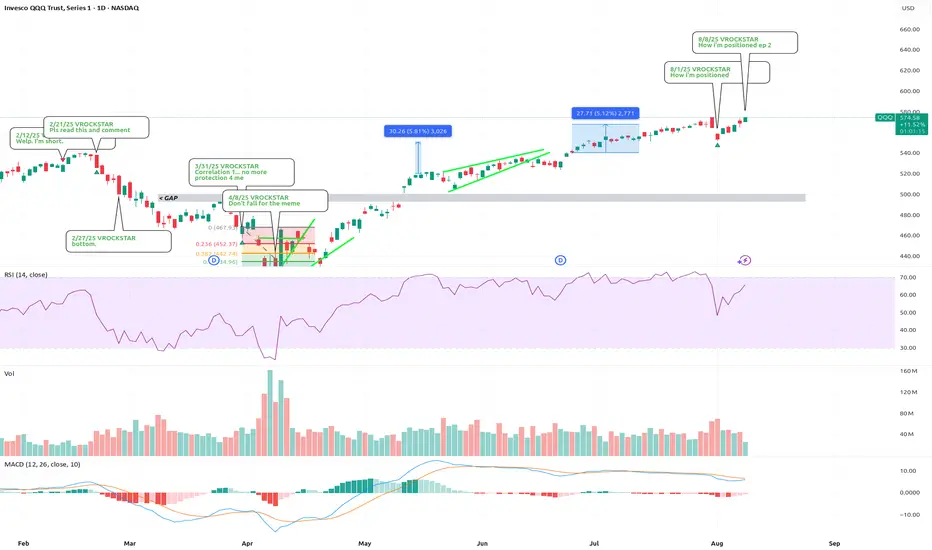
8/8/25 - $qqq - How I'm positioned ep 28/8/25 :: VROCKSTAR :: NASDAQ:QQQ
How I'm positioned ep 2
- TV's tools suck so bad that i went to check something and it deleted my note in draft, so instead of just saying eff it, i'll retype the TL;DR points
- index headed higher into YE, but feels like needs to reset either a bit lower or grind sideways before it can "leap"
- a ton of names trade MSD++ fcf yields and grow MSD-DD+ and are easy MT buys, hard to differentiate, but supportive of index too beyond mega cap
- that being said, hard to beat oppty cost of OBTC given S-1 filed this week, i'd link it but tradingview doesn't like me helping people do DD - so go to EDGAR to pull it up
how i'm positioned
65% OBTC/ 35% ibit gross short. playing the spread 12% discount to spot on OBTC as we speak. preparing for this to close in anywhere from 1 to 3 months. best guess would be it's LIVE by end of oct
OTC:OBTC/BINANCE:BTCUSDT/0.000324
NXT at 8% notional/ 15% gross (ITM leaps)
Deck at 5% notional/ 15% gross (ITM leaps)
ONON at 2% notional/ 8% gross (ITM leaps)
GAMB at 2% notional/ 6% gross
SES 5% but covered above $1 thru oct
10-15% cash for ammo, prob to further stack $OBTC.
have a good weekend.
V
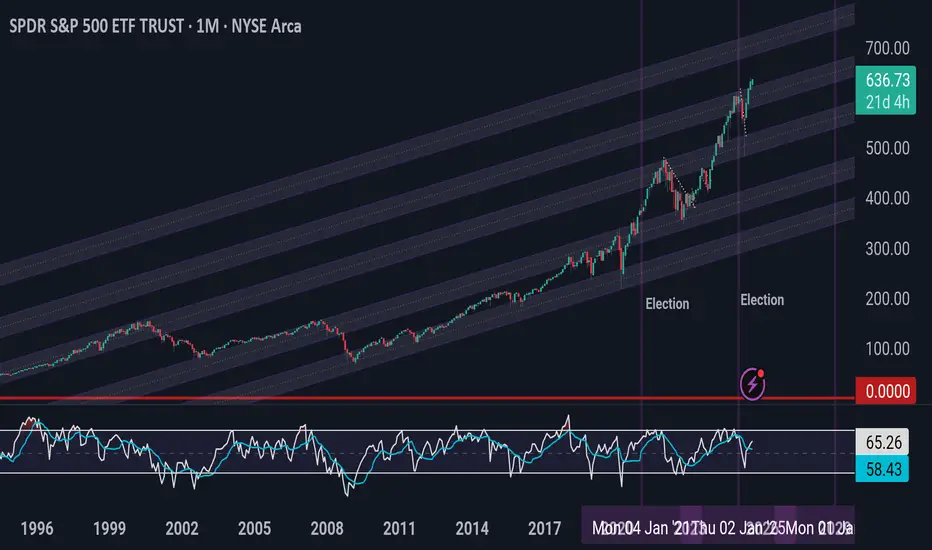
My Spy chartMy Spy chart with the same ghost levels.
As you can see, these levels hold up nicely going al the way back to 1999 - Now
Hope ths helps. Have a wonderful Friday and God Bless.
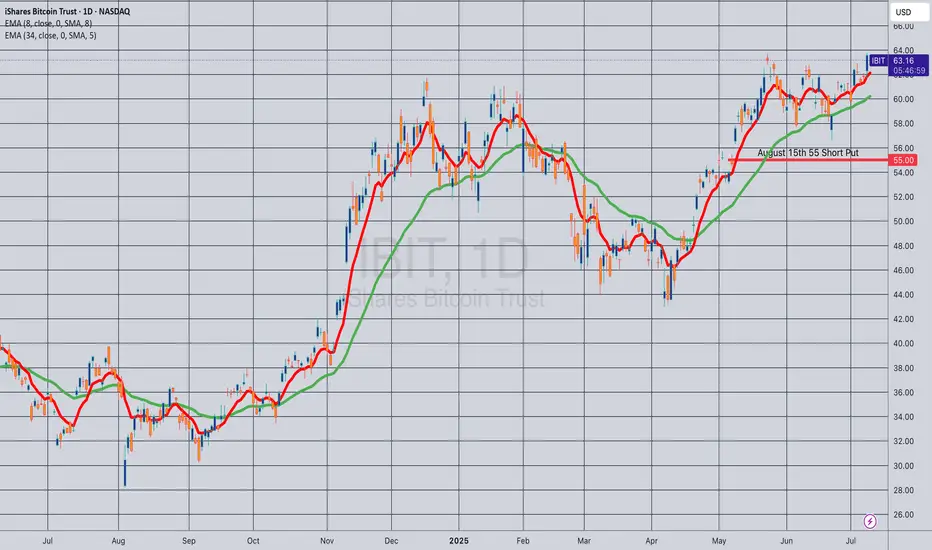
Opening (IRA): IBIT August 15th 55 Short Put... for a .62 credit.
Comments: One of the higher IV ETF's on my board. Targeting the strike paying around 1% of the strike price in credit.
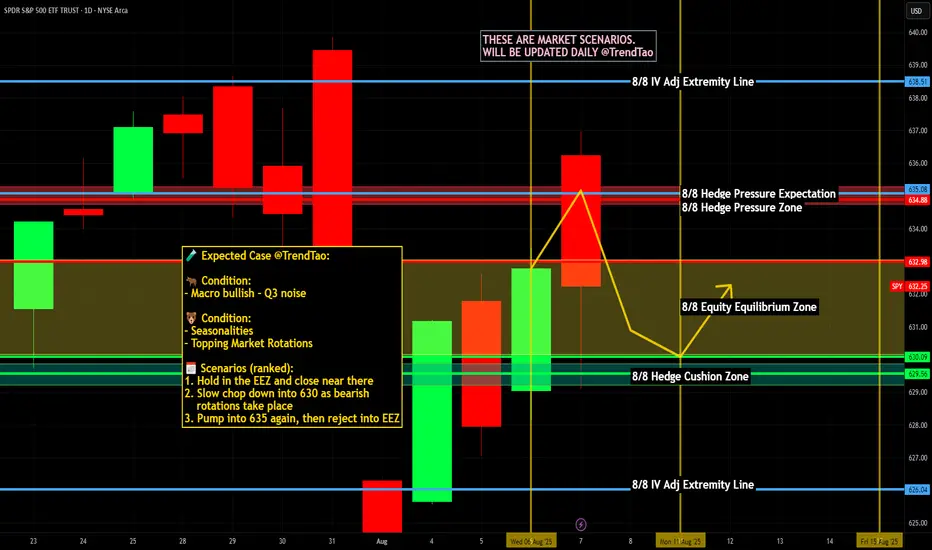
Nightly $SPY / $SPX Scenarios for August 8, 2025🔮 Nightly AMEX:SPY / SP:SPX Scenarios for August 8, 2025 🔮
🌍 Market-Moving News 🌍
🧾 Tariff Shock → Day 2 Positioning
Markets are still digesting the new tariff regime (10%–41% on broad imports) and the proposed 100% levy on imported semiconductors with carve-outs for firms investing in U.S. production. Expect continued dispersion: U.S.-capex-heavy names bid; globally exposed hardware, autos, and consumer electronics face margin risk until rules are clarified.
💬 Policy Signaling Risk
Fed speakers are leaning cautious on growth and inflation pass-through from tariffs; Bostic flagged skepticism that tariff-driven price effects fade quickly. Translation: don’t count on a rapid dovish pivot because of tariffs alone.
⛽ Energy & Positioning Into the Weekend
Oil beta in focus: Baker Hughes U.S. rig count (1:00 pm ET) and CFTC COT (3:30 pm ET) hit this afternoon—both can nudge energy, USD, and risk appetite into the close.
📊 Key Data Releases & Events 📊
📅 Friday, August 8, 2025
10:20 AM ET – St. Louis Fed President Alberto Musalem (remarks)
Market angle: watch for any tariff-inflation commentary and guidance on the path/timing of cuts.
1:00 PM ET – Baker Hughes U.S. Rig Count
Reads on drilling activity; oil services beta and crude sentiment.
3:30 PM ET – CFTC Commitments of Traders (weekly)
Positioning update across futures/FX; risk heading into next week.
(No major Tier-1 U.S. macro prints scheduled today; next CPI is Tuesday, Aug 12.)
Bureau of Labor Statistics
⚠️ Disclaimer:
Educational info only, not financial advice. Do your own research.
📌 #trading #stockmarket #economy #Fed #tariffs #chips #energy #rigcount #COT
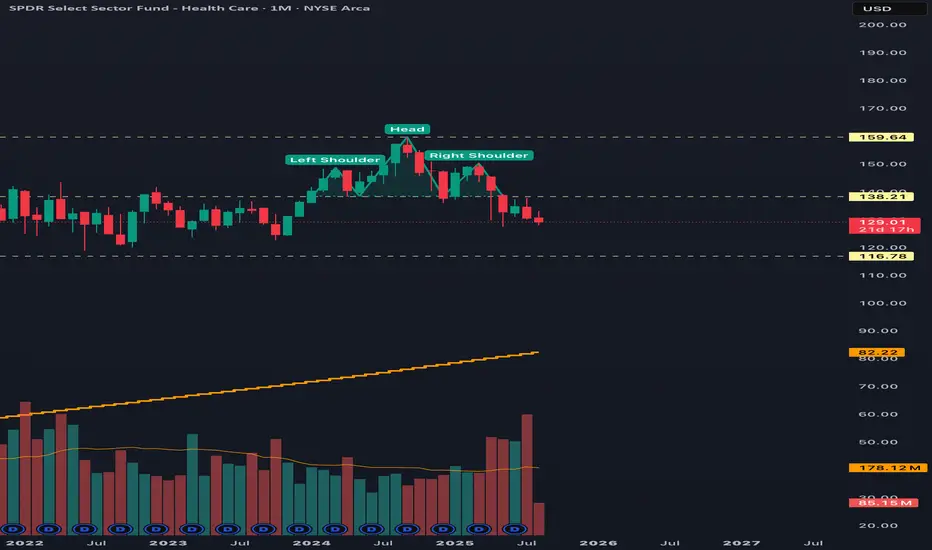
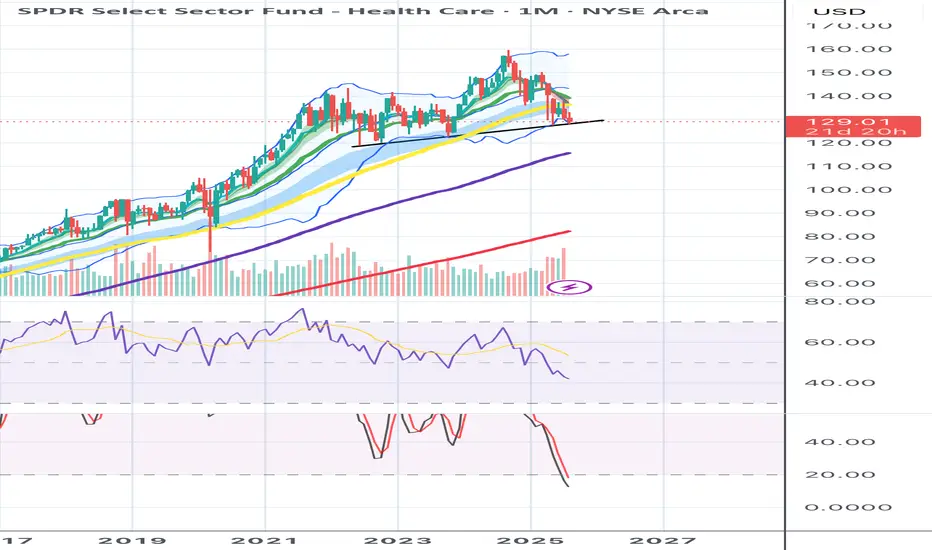
XLV SHORTMonthly chart - Head and shoulders pattern with a break below neckline and 200MA. Target for the pattern is around 118 looking to pick up long term shares there.
2 Way StreetReal Quick:
Price is bouncing off my zone. Which could lead to a bigger push higher to my 2nd tp.
Or it could be a trap, leading into a bearish divergence. That could be bad.
Im still somewhat bullish, but I doalready locked in some profits.
“Disclaimer: The information provided is NOT financial advice. I am not a financial adviser, accountant or the like. This information is purely from my own due diligence and an expression of my thoughts, my opinions based on my personal experiences, and the way I transact.
Healthcare bottomed (or only 0-3% away). AMEX:XLV has the most oversold readings since 2008.
- Specifically, the 1M slow stochastic is actually MORE oversold now then it was in 2007.
- We are sitting at a major trend line support. There’s plenty of 1-2M hammer candles along this area as well.
- we have pierced the Monthly Bollinger bands today. Every time we’ve pierced it (since 2008), it’s been bottom. We could pierce it deeper but I’d argue we don’t drop more than 2-3% from here.
My largest positions are in healthcare and crypto.
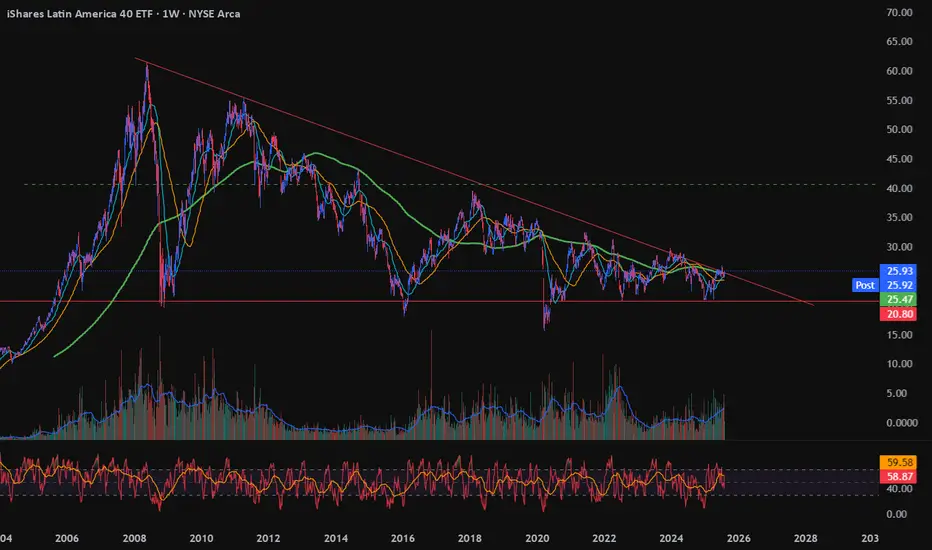
latAm is showing some strengthwith trade barriers going up, and cheap labor, natural resources in need, Latin America might have its say at significant levels. keeping watch for it some opportunity in the area
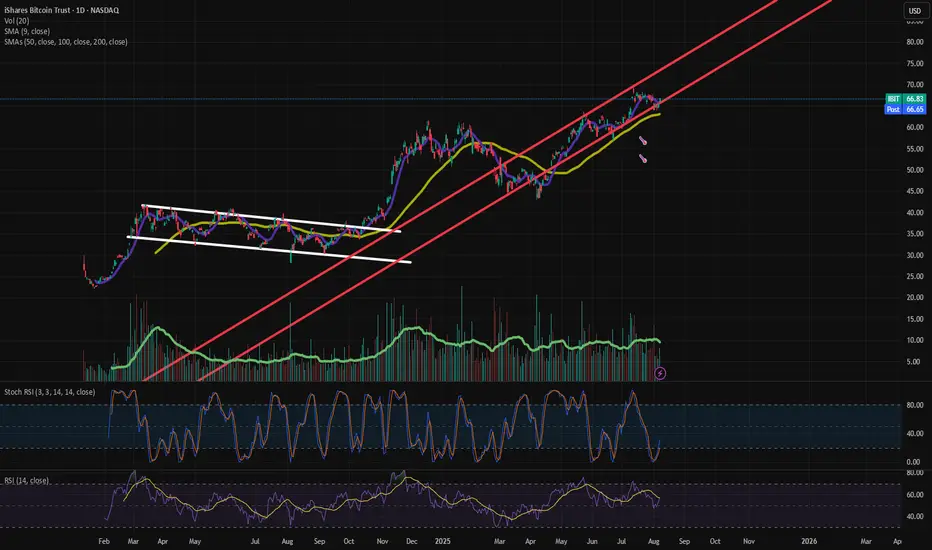
IBIT – Bitcoin Trust Tracking the Channel with PrecisionTicker: NASDAQ:IBIT – iShares Bitcoin Trust
Timeframe: 1D (Daily)
Current Price: $66.83
Bias: Bullish within ascending channel
Outlook: Continuation possible after Stoch RSI reset and trendline bounce
🧠 Idea Summary
IBIT has been trading within a strong ascending channel (marked in red) since late 2023. After a brief consolidation near the channel midline, price is attempting a bounce from key support levels. This resembles the previous bullish flag breakout pattern (white lines) seen in mid-2023.
🔍 Technical Breakdown
📌 Red Ascending Channel
Price has followed a rising parallel channel since late 2023.
The current price is bouncing from the lower bound of this channel.
📌 Previous Bull Flag (White)
In 2023, IBIT broke out of a long consolidation channel with a strong rally — the current structure is mirroring that behavior.
📌 Support/Resistance Levels
🔶 Support: ~$63 (200 SMA)
🔶 Resistance: ~$70 (channel top)
Holding above $63 maintains the bullish structure.
📈 Moving Averages
9 SMA and 50 SMA are both sloping upward, suggesting bullish strength.
Price is currently holding above both, a positive sign for continuation.
🔄 Momentum Indicators
Stoch RSI: Rebounding from oversold (~19), indicating a potential fresh upside leg
RSI (14): Hovering near 57 — still has room to run before overbought territory
📊 Volume
Volume has been consistent with bullish moves, but a breakout above $70 should ideally be accompanied by a volume spike.
🚀 Potential Price Targets
🎯 Target 1: $70 (Channel top & psychological resistance)
🚀 Target 2: $75+ (Channel extension if momentum picks up)
⚠️ Risk Management
A breakdown below $63 and the lower trendline would invalidate the bullish channel and signal a potential trend shift.
Watch for volume divergence or failed follow-through on bullish setups.
🔔 Conclusion
IBIT is respecting technical structure and preparing for a possible continuation move. The recent bounce off the lower trendline, supported by Stoch RSI reset, offers a compelling long setup if momentum follows through. Keep an eye on $70 for breakout confirmation.
✅ Like this idea if you find it useful
💬 Share your thoughts or levels below
📌 Follow me for more crypto/ETF swing setups
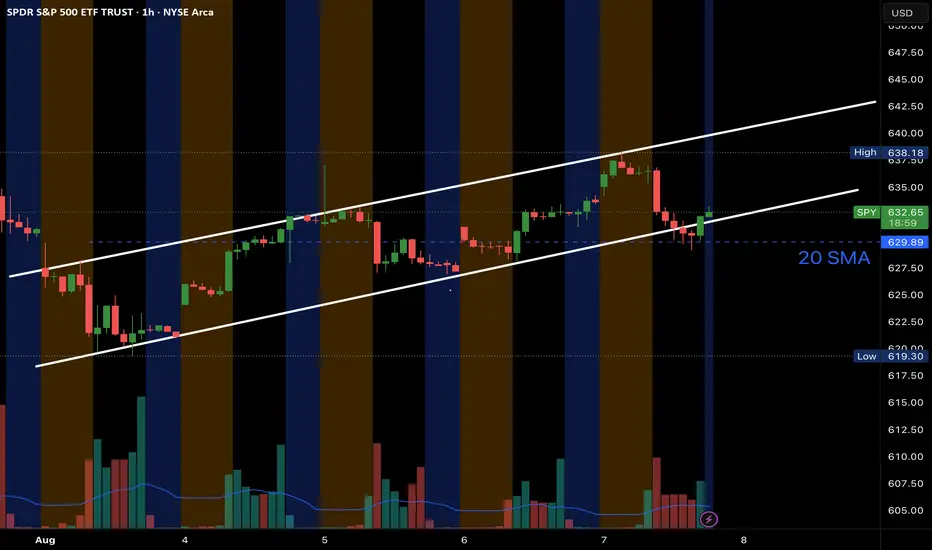
Spy holding this channel at 20 SMASpy bulls are holding above the 20 SMA. Let’s see if this trend holds!
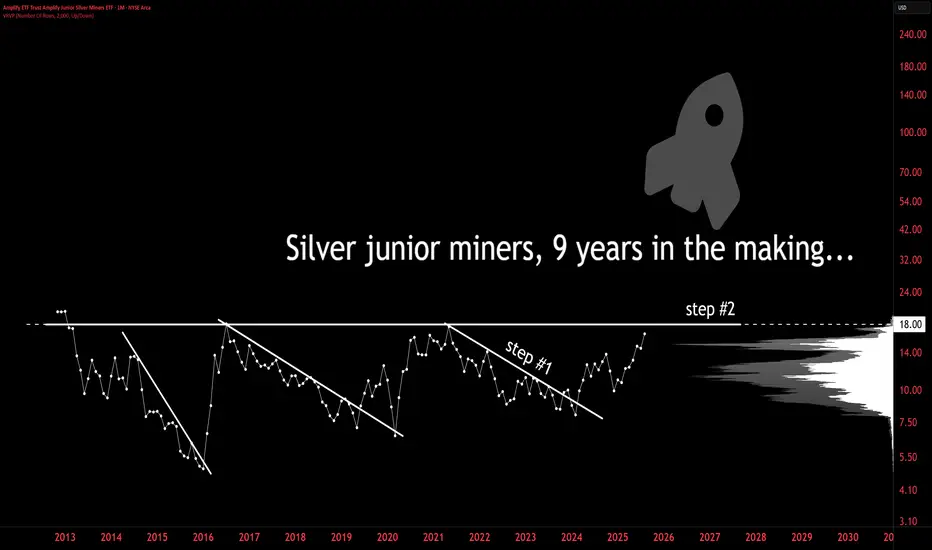
SILVER JUNIORS: 9 YEARS IN THE MAKING🚨 SILVER JUNIORS: 9 YEARS IN THE MAKING
✅ Step 1: Internal breakout
🔜 Step 2: Final resistance @ $18
When these go, they don’t walk — they sprint.
The chart says it all.
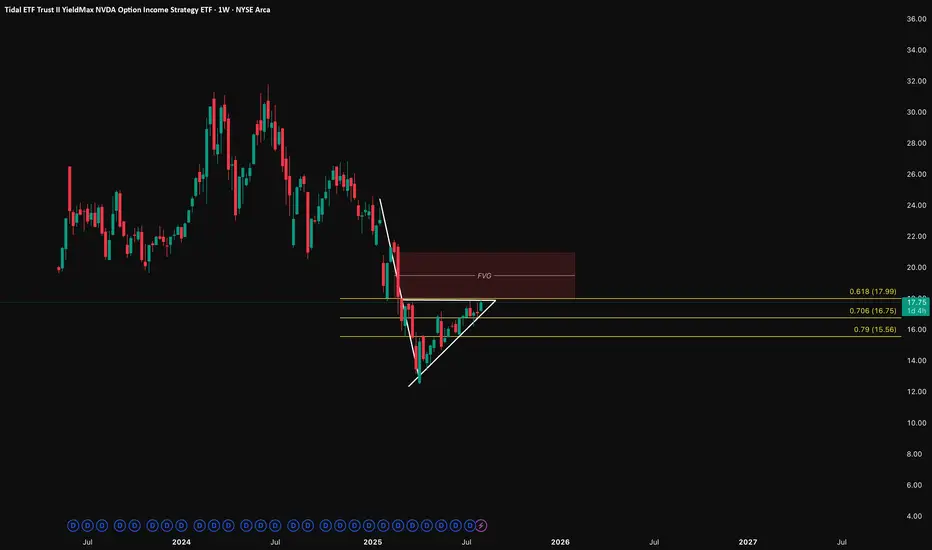
NVDA Option Income Strategy ETF (NVDY) – Daily & Weekly TA BreakBeen watching AMEX:NVDY closely — wanted to share some confluence I found between the daily and weekly charts.
🪜 Weekly Chart Breakdown
Zoomed out, drew fibs on the big swing — top to bottom. Here’s where we’re cooking:
• 0.618 at 17.99
• 0.706 at 16.75
• 0.79 at 15.56
We’re dancing right at that golden pocket, and there’s a nasty little FVG above just waiting to get filled. This thing dumped hard, and now it’s walking its way back up like it remembered it had bills to pay.
🕵️♂️ Daily Chart Breakdown
Caught a tight ascending triangle pressing up into that 0.618 level.
Price is respecting both trendline and resistance like it’s trying to decide if it’s ready to throw hands or fold.
• Higher lows stacking like bricks.
• Resistance is flatlined right under $18.
• Volume’s low but steady — pressure’s building.
⚔️ What I’m Watching
• Breakout above $18 with volume? We could rip into that FVG like butter. Eyes on $20–21 for potential fill.
• Rejection at the top? I’m not crying — I’ll catch it at $16.75 or $15.56. That’s where the fib gods are lurking.
Final Word
I ain’t trying to overcomplicate this — the levels are speaking loud.
Weekly gave me the roadmap, daily gave me the ignition.
Watching close. This one’s either a send or a snipe.
Let me know if y’all see it the same or if I missed something.
SPY Massive Long! BUY!
My dear subscribers,
My technical analysis for SPY is below:
The price is coiling around a solid key level - 621.72
Bias - Bullish
Technical Indicators: Pivot Points Low anticipates a potential price reversal.
Super trend shows a clear buy, giving a perfect indicators' convergence.
Goal - 629.55
About Used Indicators:
By the very nature of the supertrend indicator, it offers firm support and resistance levels for traders to enter and exit trades. Additionally, it also provides signals for setting stop losses
Disclosure: I am part of Trade Nation's Influencer program and receive a monthly fee for using their TradingView charts in my analysis.
———————————
WISH YOU ALL LUCK

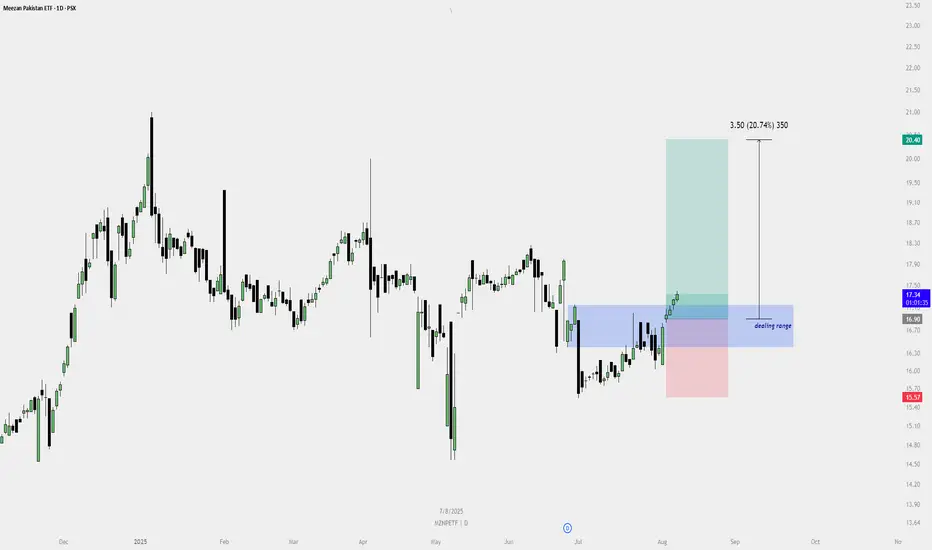
Buy Plan: Meezan Pakistan ETF (MZNPEFT)✅ Buy Plan: Meezan Pakistan ETF (MZNPEFT)
📅 Date of Setup: August 7, 2025
🕐 Timeframe: Daily (D1)
🔍 Technical Context:
Dealing Range: Marked in blue zone between ~16.30 to ~17.34.
Entry Zone: Entry executed near top of dealing range at ~16.90.
Stop Loss: Below dealing range low at 15.57.
Target: Previous structural high at 20.40.
Risk-to-Reward Ratio (RRR): 1:3+
➤ Gain Potential: +3.50 points (+20.74%)
➤ Loss Risk: -1.33 points (~7.86%)
📈 Reasons to Buy:
HTF Context Support: Price reacted from a strong bullish POI (potential FVG or structural swing).
Valid Dealing Range Formed: Price closed above the red candle series, showing strength.
Break of Structure (BoS): Price broke above minor resistance and confirmed shift in orderflow.
Bullish Momentum: Strong bullish candles closing above mid-range confirms buyers' control.
FVG Alignment (if applicable): Likely formed a bullish Fair Value Gap on lower TF inside dealing range.
📌 Execution Plan:
Parameter Value
Entry Price 16.90
Stop Loss 15.57
Target Price 20.40
Risk per Trade As per account (suggest 1%)
RRR ~2.6R
🧠 Management Strategy:
✅ If price closes above 17.50 → Consider partial profit.
🔄 If price pulls back into mid of dealing range (around 16.80) → Opportunity for re-entry.
❌ Invalidate bias if price breaks and closes below 15.50.
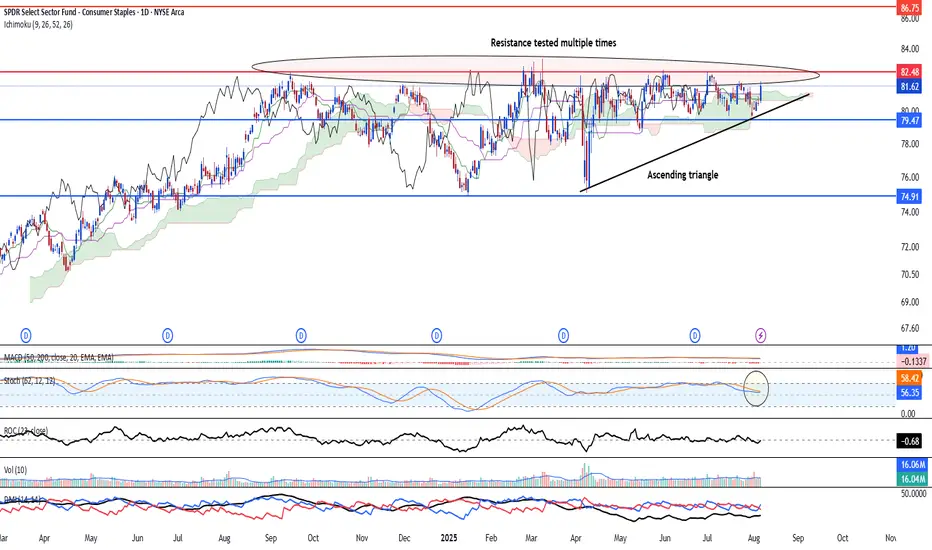
Consumer staples likely coming back Consumer staples is looking to regain its upside after ranging for a period since October 2024. The resistance at HK$82.48 has been tested multiple times and is likely to be weakened, therefore increasing its probability of an upside break. Prices also stays supported above the psychological support of US$80.00 since May 2025. Long-term MACD remain flat and despite the histogram stays negative, the signal line continues to stay elevated above the zero line, which signals a potential chances of breaking to the upside.
Stochastic Oscillator shows a possible crossover above the 50-midpoint line and 23-period ROC is rising again, aiming to break above the zero line. Volume remains in a healthy expansion.
Target will be at 86.00 and 92.35. 78.00 key support will be a good level to add if there's a correction.
SPY 0DTE Bearish Setup – Max Pain in Play (Aug 7)## ⚠️ SPY 0DTE Bearish Setup – Max Pain in Play (Aug 7)
**Low-Conviction Market = Short-Term Put Opportunity?**
### 🧠 Summary of Consensus:
All major models (Grok, Gemini, Claude, Llama, DeepSeek) flag the **lack of bullish momentum**.
💡 **Key Bearish Signals**:
* 📉 Price below VWAP
* 📊 Weak volume
* 📉 RSI & flow: neutral to bearish
* 🎯 Max pain hovering near current price
---
### 🤖 AI Model Breakdown:
| Model | Bias | Action |
| -------------- | ------------------- | ---------------------------- |
| Grok / Gemini | 🔻 Weak Bearish | No trade (wait for clarity) |
| Claude / Llama | 🔻 Moderate Bearish | Buy PUT at \$630 |
| DeepSeek | ⚖️ Mixed Bearish | Monitor – no high-conviction |
🧭 **Consensus Direction**: **Weak Bearish**
---
### 🔧 Trade Setup (0DTE)
| Metric | Value |
| ---------------- | ------------- |
| 🎯 Instrument | SPY |
| 🔀 Direction | PUT (SHORT) |
| 💵 Entry Price | 0.78 |
| 💣 Strike Price | 630.00 |
| 🛑 Stop Loss | 0.39 |
| 🎯 Profit Target | 1.56 |
| 📅 Expiry | Aug 07 (0DTE) |
| ⏰ Entry Timing | Market Open |
| 📈 Confidence | 60% |
📊 **Risk/Reward**: 1:2
📉 **Time Decay Alert**: Tight stop-loss due to fast 0DTE decay.
---
### ⚠️ Key Watchouts:
* 📈 Reclaiming VWAP = **exit immediately**
* 🔊 Sudden volume spike = momentum shift risk
* 🧯 Keep position size small – this is a **scalp**, not a swing
---
### 🧠 Final Take:
> If SPY stays pinned below VWAP & max pain remains, this **0DTE put could print**. But discipline is everything — tight stop, tight leash. ⚔️
---
🧠 **Follow for daily AI-backed earnings & SPY plays**
📉 **Not financial advice – manage risk like a pro**

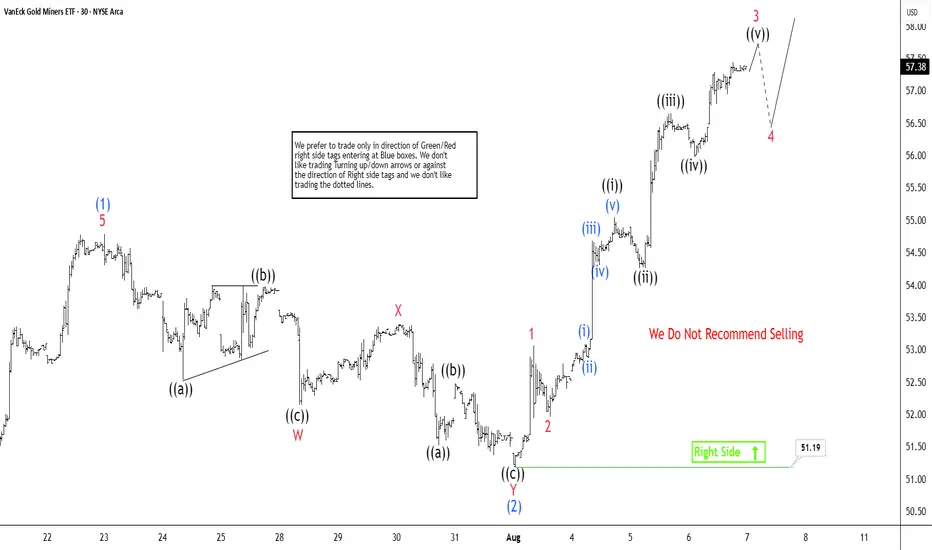
GDX Elliott Wave Outlook: Strong Wave 3 Surge with $58 3 TargetThe Gold Miners ETF (GDX) continues its upward trajectory, forming a pattern of higher highs and higher lows since its September 2022 bottom, signaling a robust bullish market. From the July 17, 2025 low, GDX has embarked on a five-wave impulse Elliott Wave structure in the shorter cycle. The hourly chart shows wave (1) peaking at 54.79, followed by a wave (2) dip concluding at 51.19. Wave (2) unfolded as a double three Elliott Wave pattern, with wave W declining to 52.15, wave X rallying to 53.41, and wave Y completing the correction at 51.19.
GDX has since surged within wave (3), structured as a lower-degree impulse. From wave (2), wave 1 climbed to 53.06, and a brief wave 2 pullback ended at 51.96. The ETF then advanced in wave 3, with sub-wave ((i)) reaching 55.05 and sub-wave ((ii)) retracing to 54.26. Sub-wave ((iii)) pushed higher to 56.66, followed by a sub-wave ((iv)) dip to 55.99. The ETF should soon complete sub-wave ((v)) of wave 3, followed by a wave 4 pullback before resuming upward in wave 5 of (3). As long as the 51.19 pivot holds, pullbacks should find support in a 3, 7, or 11-swing sequence, paving the way for further gains. The bullish momentum remains strong, with 58.3 as a potential target.
Nightly $SPY / $SPX Scenarios for August 7, 2025🔮 Nightly AMEX:SPY / SP:SPX Scenarios for August 7, 2025 🔮
🌍 Market‑Moving News 🌍
📦 Major Tariffs Implemented Today
Sweeping tariffs ranging from 10% to over 40% officially took effect today on imports from numerous countries, significantly escalating global trade tensions. Markets are closely tracking initial reactions across affected sectors, especially pharmaceuticals and semiconductors.
💻 Semiconductor Tariff Shakes Tech Sector
President Trump introduced a substantial 100% tariff on semiconductor imports, with notable exemptions for U.S. investors such as Apple, Nvidia, and AMD. Apple shares surged 5.1% amid investor optimism, while broader tech stocks saw mixed reactions.
🚀 Firefly Aerospace IPO Debut
Firefly Aerospace launched its IPO today, pricing shares at $45. The stock began trading on Nasdaq under ticker "FLY," attracting significant attention due to its positioning in the space and defense technology sector.
📊 Key Data Releases & Events 📊
📅 Thursday, August 7, 2025:
8:30 AM ET – Initial Jobless Claims (week ending Aug 2)
Forecast: 221,000
Previous: 218,000
8:30 AM ET – U.S. Productivity (Q2)
Forecast: 1.9%
Previous: –1.5%
8:30 AM ET – U.S. Unit Labor Costs (Q2)
Forecast: 1.3%
Previous: 6.6%
10:00 AM ET – Wholesale Inventories (June)
Forecast: N/A
Previous: –0.3%
10:00 AM ET – Speech by Atlanta Fed President Raphael Bostic
Topic: Monetary policy outlook; market-sensitive for potential Fed signals.
3:00 PM ET – Consumer Credit (June)
Forecast: N/A
Previous: $5.1B
⚠️ Disclaimer:
This content is for educational and informational use only and is not financial advice. Always consult a licensed financial advisor before making investment decisions.
📌 #trading #stockmarket #economy #tech #earnings #IPO #Fed #tariffs #semiconductors

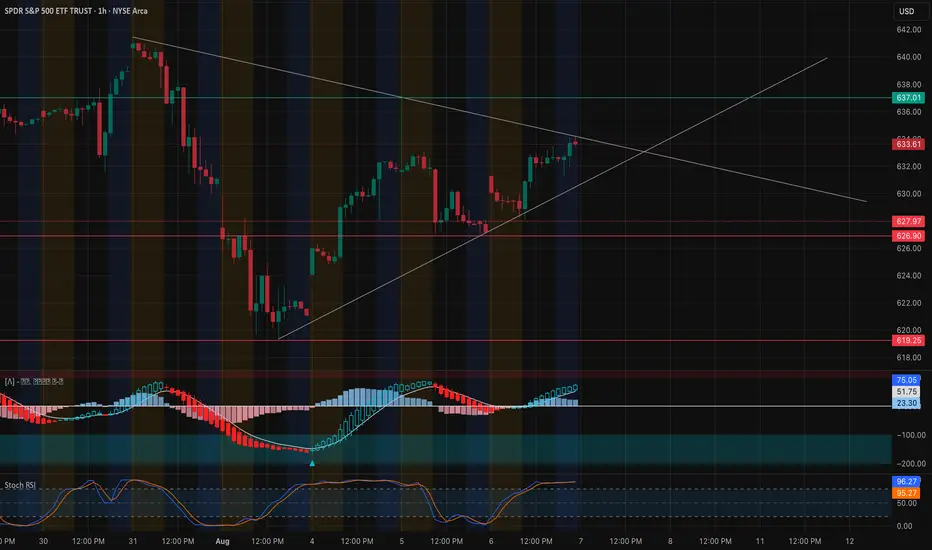
SPY Approaching Apex — Breakout or Trap Ahead? Aug 7SPY Approaching Apex — Breakout or Trap Ahead? 🔥
📊 Technical Analysis (1H Chart)
SPY has reclaimed the rising wedge support trendline and is now grinding just beneath a confluence of resistance near 633.61. This is the third test of this breakout zone, forming a squeeze triangle with lower highs and higher lows.
Key Structure Notes:
* Bullish momentum continues to build on the MACD histogram with rising blue bars and a bullish cross already established.
* Stoch RSI is extremely overbought (96+), which suggests caution — SPY is vulnerable to rejection if buyers lose steam.
* Price action remains orderly and within trendline compression. A breakout above 634 could unleash aggressive buying, while losing 631 opens the door to retest 627–628 demand.
Intraday Levels to Watch:
* 📈 Resistance: 633.61 → 634.20 → 637.00 (key horizontal resistance and fib extension)
* 📉 Support: 631.00 → 628.20 → 626.90 → 619.25
🔍 Options GEX & Dealer Positioning
The GEX board favors bullish continuation — but also hints at gamma traps near the top:
* 🟢 634.00–634.20: 91.11% GEX concentration at 2nd CALL Wall — this is the biggest dealer hedge wall; could act as resistance or gamma squeeze fuel if broken.
* 🟢 637.00: Highest positive net GEX → if SPY pushes above 634 and holds, momentum could carry toward 637.
* 🔴 626.00–625.00: Layered PUT walls and HVL zone provide strong downside cushion.
* 🧭 Net GEX is moderately positive, suggesting dealer flows will slow upside moves unless a sharp squeeze kicks in. Watch IVR (15.3) — low enough to allow scalps but not favorable for selling premium.
🧠 Game Plan & Thoughts
* 🔓 Bullish Scenario: Break and hold above 634 confirms the triangle breakout → target 637–638 next.
* 🛑 Bearish Rejection: Failure at 633.61 or loss of 631 reopens path back to 628.20–626.90 zone.
* 🎯 Suggested Setup: Long scalp above 634 → TP: 637 | SL: 631.
Short setup below 631 → TP: 627 | SL: 634.
Momentum is on the bulls' side for now, but you're buying into a potentially crowded breakout zone. Watch volume and reaction around 634 — breakout or fade will decide next leg.
This analysis is for educational purposes only and does not constitute financial advice. Always manage your risk.
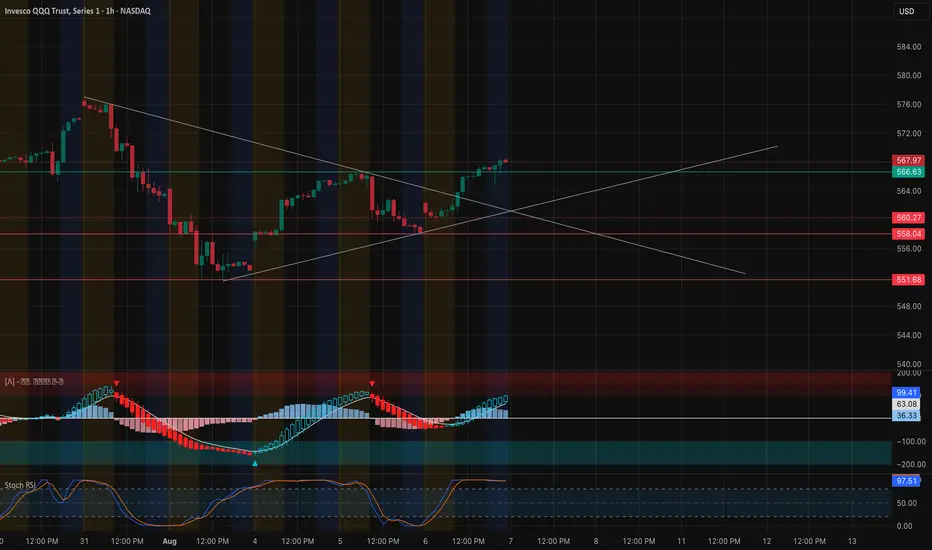
QQQ Breaks Out! Can the Bulls Defend the Zone Above 566? Aug7Technical Analysis (1H)
QQQ has finally broken out of the symmetrical wedge pattern, closing above the key 566–567 resistance zone and now testing the 568.60 level. This move confirms bullish momentum as the price holds above the trendline retest.
* Trendline Breakout: Clean breakout from the descending wedge with follow-through candles.
* Structure Shift: Higher lows and higher highs are forming, signaling trend reversal.
* Momentum:
* MACD: Bullish crossover with increasing histogram bars supports the breakout.
* Stoch RSI: Topped near overbought but still pointing upward — watch for potential divergence or consolidation.
* Support Zones:
* 566.60 → Retest zone from prior breakout
* 563.40 → Demand zone aligning with GEX support
* 560 → Critical support and prior resistance
* Resistance Zone:
* 568.60 → Current price testing a key rejection area from prior supply zone
If QQQ holds above 566 on retest, continuation toward 572–574 is likely. If it breaks below 563, short-term weakness may follow.
Options Sentiment & GEX Analysis
GEX data supports a tight battle zone around 567–568.
* Resistance Clusters:
* 568.63 → Highest positive NETGEX and heavy 3rd CALL wall (13.56%)
* 570–572 → GEX7 to GEX10 cluster (light resistance)
* Support Levels:
* 566 → Strong 2nd CALL Wall (15.68%)
* 563.40–564 → GEX9 and GEX8 support (cumulative ~5%)
* 560 → HVL, key pivot for downside protection
* Options Flow:
* Puts at 62.9% dominance → Contrarian bullish bias forming
* IVR 15 / IVx avg 17.9% → Low implied volatility; premium buyers are favored
* GEX 0% → Neutral gamma pressure, so price can move more freely with volume
This GEX structure shows call walls above, but strong net gamma support below. If bulls hold 566–567, they can attempt a push toward 572 into mid-August expiration.
Conclusion:
Bulls are in control above 566. As long as QQQ holds that breakout zone, upside momentum could target 572+. A breakdown back below 563 opens up downside back to 560 or lower. Watch for volume confirmation and IV expansion.
Disclaimer: This analysis is for educational purposes only and does not constitute financial advice. Always do your own research and manage risk accordingly.