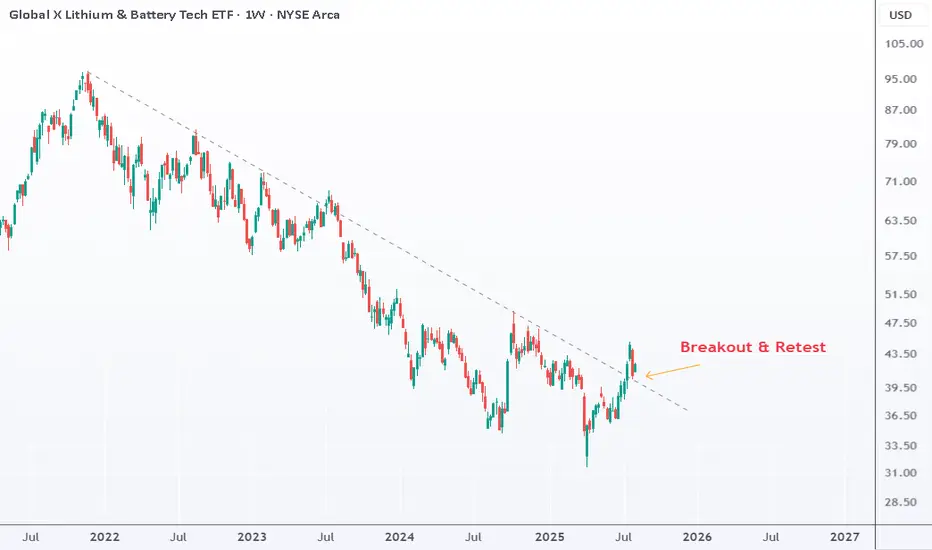
LIT: Breaking the downtrend, Setting up for a bullish cycle LIT has broken out of its long-term bearish trend and last week retested the breakout level along with the 200-day moving average. These are encouraging signs that point to a potential new bullish cycle.
ETF market
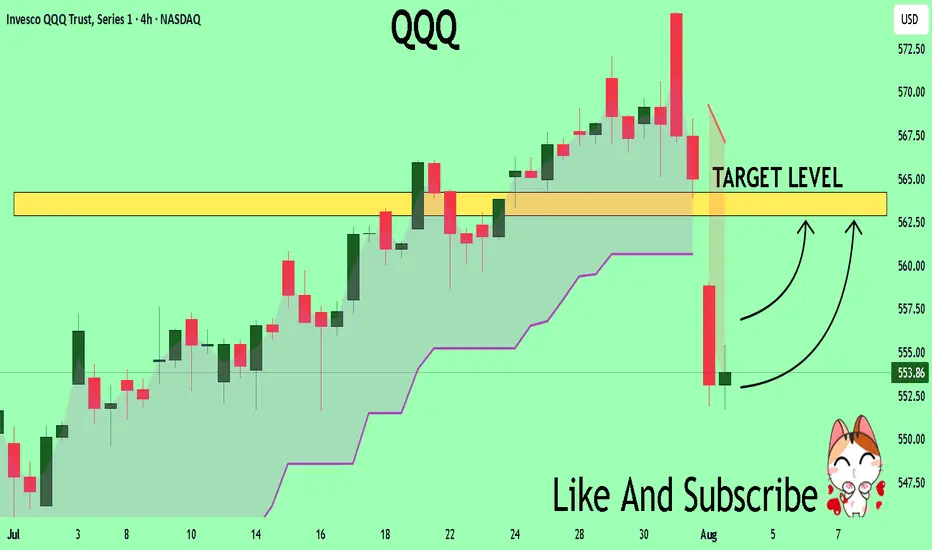
QQQ The Target Is UP! BUY!
My dear friends,
Please, find my technical outlook for QQQ below:
The instrument tests an important psychological level 553.86
Bias - Bullish
Technical Indicators: Supper Trend gives a precise Bullish signal, while Pivot Point HL predicts price changes and potential reversals in the market.
Target - 562.88
About Used Indicators:
Super-trend indicator is more useful in trending markets where there are clear uptrends and downtrends in price.
Disclosure: I am part of Trade Nation's Influencer program and receive a monthly fee for using their TradingView charts in my analysis.
———————————
WISH YOU ALL LUCK
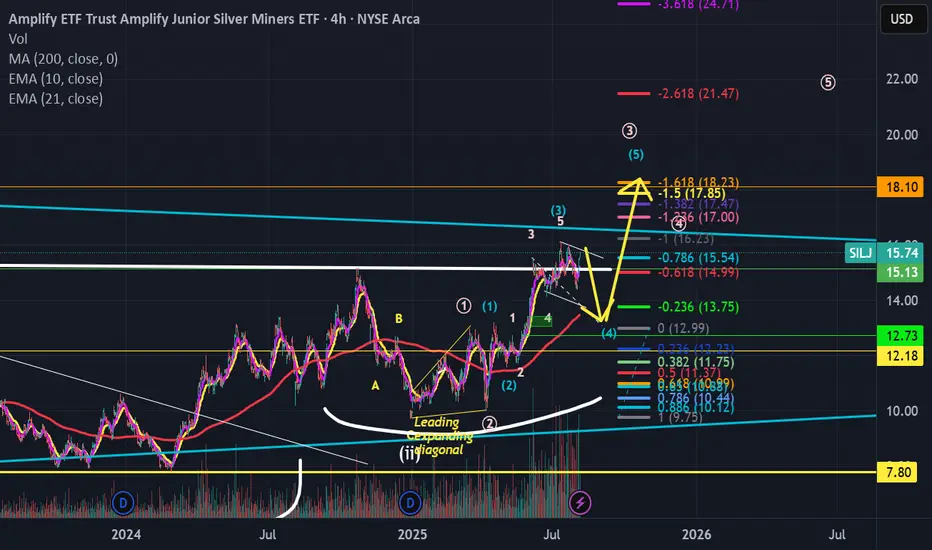
Short term pb likelyI am thinking that this move up on silver and more specifically SILJ is overdone and a decent size pull back is coming short term...yes...I remain boolish long term, however in the near term I think we will see a pb that can be traded to the downside for the next couple of weeks...but I could be wrong!
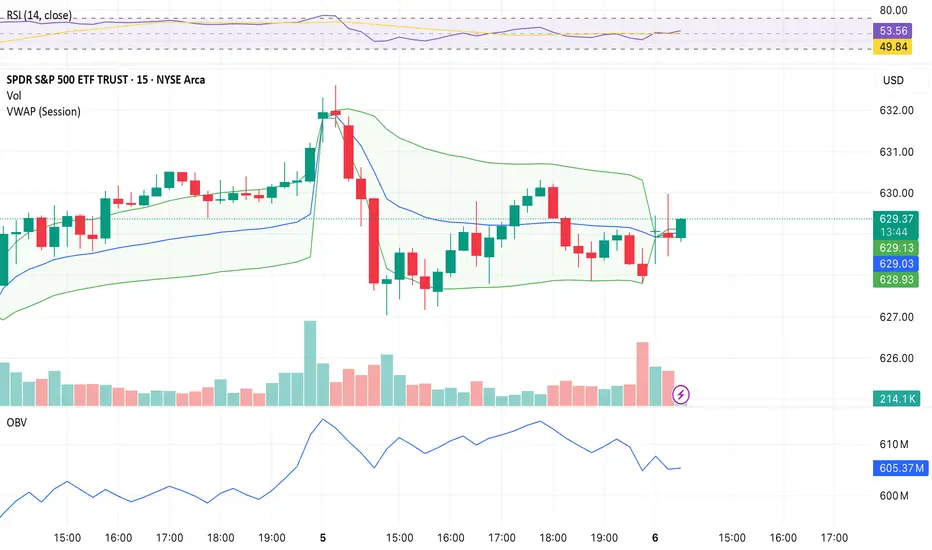
Options Trading for SPY - Bear Spread Oct 17I'm setting up a Bear Put Spread on AMEX:SPY with the following legs:
Buy 630 Put
Sell 620 Put
Expiration: October 18, 2025
Thesis: I'm expecting a bearish move or neutral-to-bearish consolidation over the coming weeks, likely driven by macroeconomic pressure and technical weakness around the 630 level.
Current Price: ~$629.50
Risk/Reward: Defined risk strategy with a maximum loss equal to the net debit paid.
Breakeven Point: $630 – net debit
Max Profit: If SPY closes below $620 at expiration
Max Loss: If SPY closes above $630 at expiration
Technical indicators include:
Price rejection around VWAP
Decreasing OBV during consolidation
RSI divergence suggesting weakening momentum
Watching for further confirmation on breakdown from current levels. Will monitor volume and macro news.
56This channel is not providing individualized trading or investment advice, nor is it a banking service, brokerage service, trading service, investment service or money management service

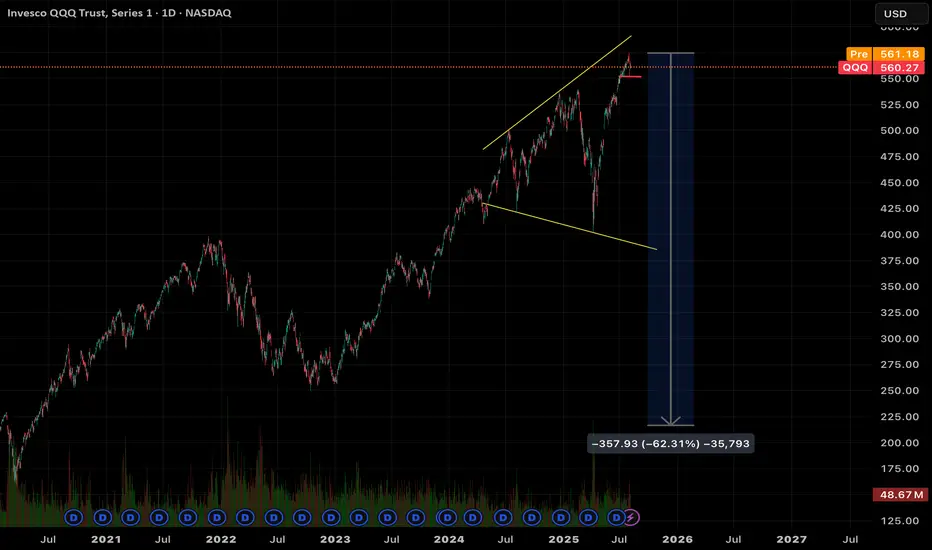
Nasdaq at or near end of trend?Broadening top seen, with current PO if the recent high is the top. There’s still room to run higher to test the upper boundary of this pattern. Should the current potential head and shoulders top on the hourly chart break out to the downside then the odds of the top being in now increases.
The same head and shoulders pattern is showing up in the major averages and also for Berkshire Hathaway.
SPY/QQQ Plan Your Trade Update For 8-5This short video is to provide my followers with an update.
I'm still here. I'm still working on projects and new TV code. I have developed a couple of new strategies that I like and that seem to continue to perform.
Overall, I'm still doing my best to deliver superior analysis/results for my followers.
This video covers the SPY/QQQ, Gold/Silver, and BTCUSD (plus extras).
Hope you are all getting some great profits from these moves.
GET SOME.
#trading #research #investing #tradingalgos #tradingsignals #cycles #fibonacci #elliotwave #modelingsystems #stocks #bitcoin #btcusd #cryptos #spy #gold #nq #investing #trading #spytrading #spymarket #tradingmarket #stockmarket #silver

PSIL breaks the lower highs - is the new weekly support set?PSIL daily bounce has broken the lower highs, which is the first clue our new weekly support may be set. To be certain, we will have to confirm the daily uptrend, but that will take likely into next week to see.
The key levels going into tomorrow are today's high and today's low. If we break the high, the bounce continues and we will look up to recent resistances and see where we top out. If the low breaks, we will look down to the low of last week in search of a daily higher low, and then hope to change the daily trend back to bullish from there.

Nightly $SPY / $SPX Scenarios for August 6, 2025🔮 Nightly AMEX:SPY / SP:SPX Scenarios for August 6, 2025 🔮
🌍 Market‑Moving News 🌍
🪙 Citi Lifts Gold Price Forecast Amid Global Uncertainty
Citi raised its short-term gold outlook to $3,500/oz, citing surging safe-haven demand driven by trade instability, softening labor metrics, and heightened geopolitical risk. Risk premiums and volatility remain elevated.
📉 Equities Tumble as Risk Aversion Returns
U.S. stocks slipped on renewed caution—investors rotated into bonds and precious metals following weaker job indicators and escalating trade friction. The dollar and gold strengthened, while equity futures pulled back.
📊 Key Data Releases & Events 📊
📅 Wednesday, August 6:
No major U.S. economic data releases scheduled for today. Markets are closely monitoring corporate earnings reports and commentary from Fed officials, including San Francisco Fed President Mary Daly later in the day.
⚠️ Disclaimer:
This content is for educational and informational purposes only—it is not financial advice. Always consult a licensed financial advisor before making investment decisions.
📌 #trading #stockmarket #economy #trade #currency #gold #earnings

SPY Stuck Below Downtrend Resistance. TA for Aug. 6SPY Stuck Below Downtrend Resistance – Sellers Still Pressing
Market Structure (1H View)
* SPY continues to trade inside a descending channel, with repeated failures near the upper trendline around $641–$644.
* Recent price action shows a lower high rejection followed by consolidation under resistance, signaling a cautious market tone.
* The macro downtrend remains intact unless bulls can break and hold above the descending trendline.
Key Price Levels
* Immediate Resistance: $631 (local reaction high)
* Major Resistance: $641–$644 (trendline + prior supply zone)
* Support Zone: $619–$620 (key demand zone)
* Deeper Support: $603–$605 (previous low and psychological support)
Indicators
* MACD: Recently flipped bearish with red momentum bars increasing — suggests momentum is shifting back toward sellers.
* Stoch RSI: Oversold bounce attempt possible, but currently still near the lower range.
* Trendlines: Price remains capped under the descending resistance line.
Current Bias
SPY is struggling to sustain bullish momentum after the recent push into resistance. Sellers are defending the upper channel, keeping pressure on the downside toward $620.
Scenarios to Watch
🟢 Bullish Case:
* Break & close above $631 with follow-through volume → retest $641–$644.
* Needs strong buying interest to flip the macro trend bias.
🔴 Bearish Case:
* Failure to reclaim $631 + sustained weakness could send price back toward $620 support.
* If $620 breaks, risk increases for a sharper drop toward $603–$605.
Trade Ideas (Not Financial Advice)
* Short Bias: Look for rejection near $631 or the trendline; target $620, then $605 if breakdown accelerates.
* Long Setup: Only if price reclaims $631 convincingly and breaks the $641–$644 resistance zone.
📌 Final Thoughts
SPY remains bearish-biased inside a descending channel. Bulls need a decisive breakout above $641 to change sentiment; otherwise, sellers will continue targeting $620 and potentially lower.

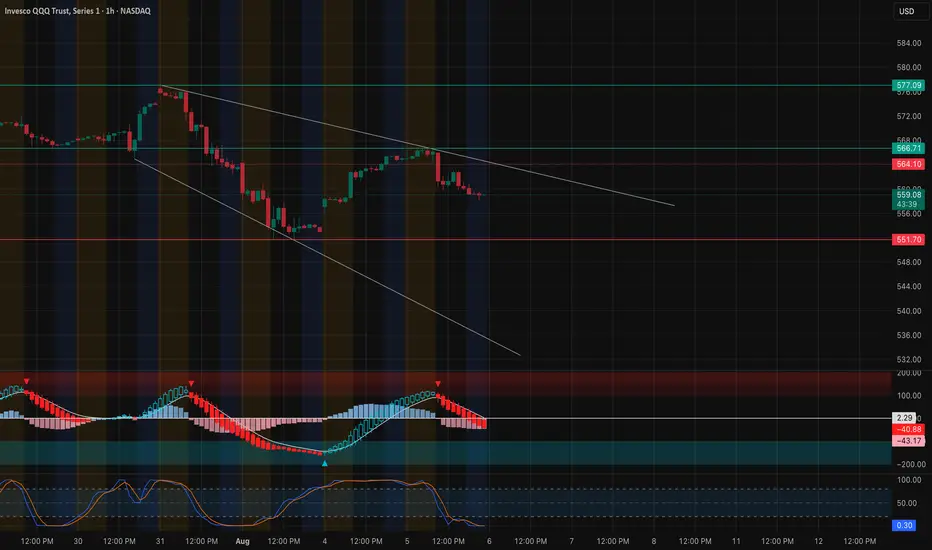
QQQ Pressured Below Downtrend Line. TA for Aug. 6QQQ Pressured Below Downtrend Line – Bearish Momentum Building
Market Structure (1H View)
* QQQ remains in a descending channel, with price recently rejecting near the upper trendline resistance around $566–$567.
* The recent drop signals sellers defending the downtrend line, pushing price back toward mid-channel.
* Macro structure still leans bearish until price can break and hold above the channel.
Key Price Zones
* Immediate Resistance: $564–$567 (trendline rejection zone)
* Major Resistance: $577 (macro swing high level)
* Support: $551–$552 (key demand zone + previous consolidation base)
* Deeper Support: $545–$546 (prior low / psychological level)
Indicators
* MACD: Bearish crossover forming; momentum bars turning red, signaling increased downside pressure.
* Stoch RSI: Cooling off from overbought levels, moving lower—suggesting potential continued weakness.
* Trendlines: Price trapped between descending resistance and mid-channel support.
Current Bias
The rejection near $566–$567 and drop in momentum suggest sellers are regaining control. A retest of $551–$552 is possible if bearish momentum accelerates.
Scenarios to Watch
🟢 Bullish Case:
* Break & close above $567 → likely move toward $577.
* Needs strong buying volume and MACD bullish reversal to confirm breakout.
🔴 Bearish Case:
* Failure to reclaim $564 with sustained selling → drop toward $552 support.
* If $552 fails, deeper flush toward $545–$546 possible.
Trade Ideas (Not Financial Advice)
* Short Bias: If rejection continues at $564–$566 zone, target $552 with tight stop above $567.
* Long Setup: Only if price breaks $567 with strong bullish momentum; target $577.
📌 Final Thoughts
QQQ is in a pressure cooker at the top of its descending channel. Without a bullish breakout soon, the path of least resistance remains lower toward $552. Keep a close watch on intraday momentum shifts for confirmation.
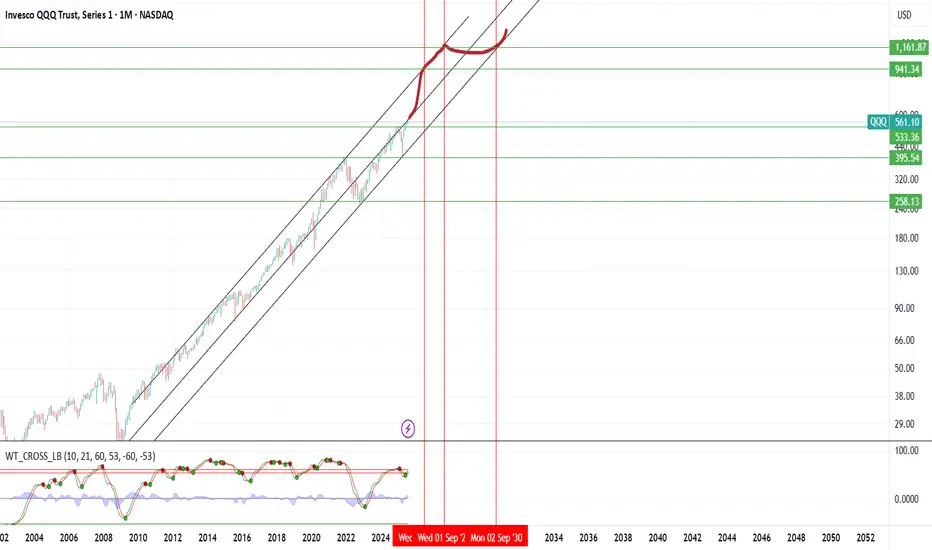
Knock knock Neo ... See my prediction hereupper band , trails the band , then slow till the dip. Good luck
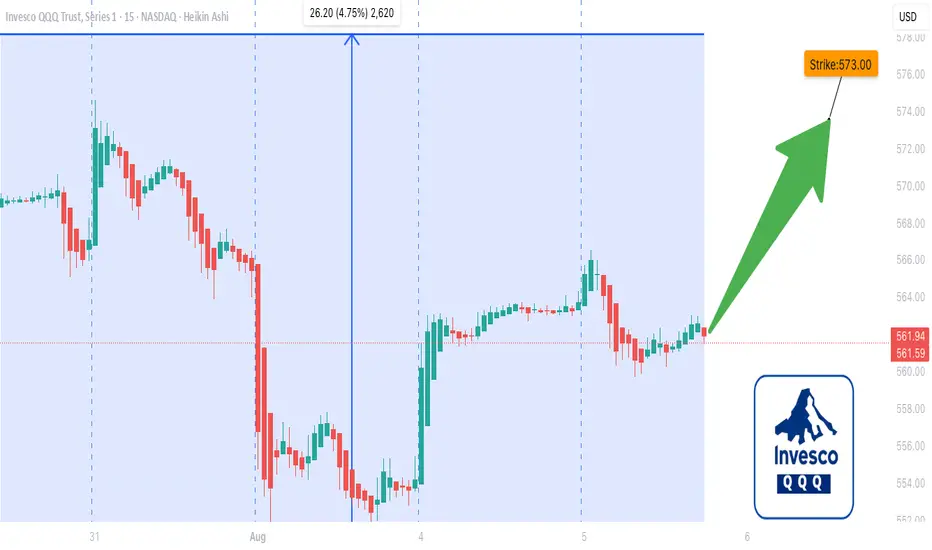
QQQ $573C Looking HOT **QQQ \$573C Looking HOT 🔥 Weekly RSI Surges – Models Align on Call Setup 🚀**
---
### 📊 **Post Body (Formatted for TradingView):**
**QQQ Weekly Options Play — Aug 8 Expiry (3DTE) 💥**
📈 **Momentum Snapshot:**
* **Weekly RSI:** 🔼 67.9 and rising
* **Daily RSI:** ⚖️ Mixed (short-term weakness)
* **Volume Trend:** Mixed — bullish accumulation OR institutional selling
* **Gamma Risk:** ⚠️ Moderate
* **Time Decay:** ⏳ Accelerating
---
🧠 **Model Consensus Summary:**
* **Grok / Claude / Llama:** 🔥 Bullish — Weekly RSI + volume support
* **Gemini (Google):** 🧊 No trade — Conflicted volume view
* **DeepSeek:** 😐 Bullish with caution — Volume red flag acknowledged
✅ **Consensus Direction:** **Moderate Bullish**
🛠️ **Trade Setup:** Long CALL
---
### 🧾 **Trade Specs:**
* 🟢 **Instrument:** QQQ
* 📈 **Strike:** \$573
* 📅 **Expiry:** Aug 8, 2025
* 💵 **Entry Price:** \$0.86
* 🎯 **Target:** \$1.30
* 🛑 **Stop:** \$0.43
* 📏 **Size:** 2 contracts
* 💪 **Confidence Level:** 70%
* ⏰ **Entry:** Market Open
* 🕒 **Posted:** 2025-08-05 08:03 EDT
---
🚨 **Risk Notes:**
* Institutional selling may cap upside 📉
* Mixed RSI suggests staying nimble ⚠️
* Only 3 DTE — exit FAST if it runs 💨
---
📦 **Trade JSON (Copy for Auto-Loggers):**
```json
{
"instrument": "QQQ",
"direction": "call",
"strike": 573.00,
"expiry": "2025-08-08",
"confidence": 0.70,
"profit_target": 1.30,
"stop_loss": 0.43,
"size": 2,
"entry_price": 0.86,
"entry_timing": "open",
"signal_publish_time": "2025-08-05 08:03:16 EDT"
}
```
---
### 🏷️ **Tags (TradingView Format):**
`#QQQ #OptionsAlert #WeeklyOptions #CallOptions #TechStocks #MomentumTrading #RSI #EarningsPlay #OptionsFlow #GammaSqueeze #TradingSignals #QQQTrade #Nasdaq100 #TradingStrategy #SPYQQQ`
Still undecidedEdged the top and bottom 4hr fibs. In a 4hr fvg. Idk. Anyone have any thoughts on this or nah

SPY: This might be probable today. Watching the price action at spy. It landed at a mod-fib and it is trying to look for a direction. Let's see if we can find a trade here.

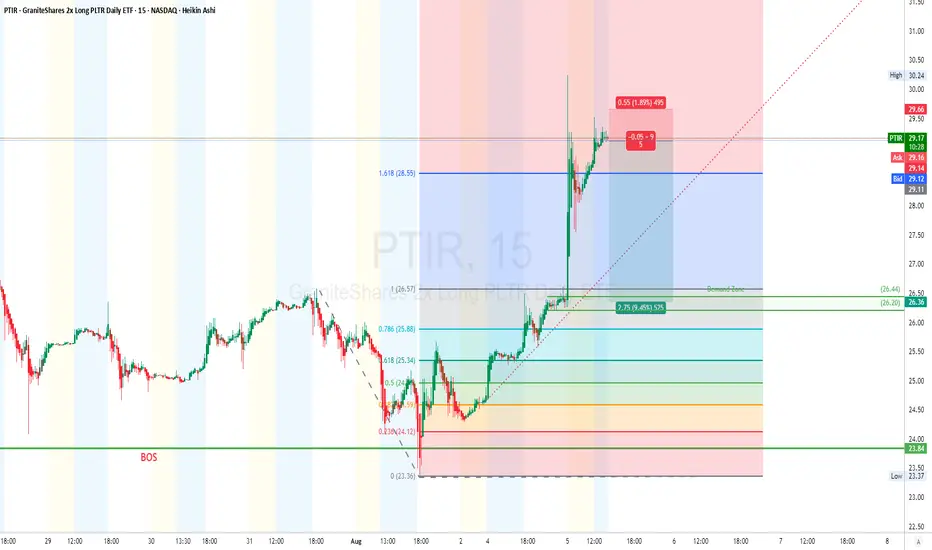
PTIR short setup on 15-minShort setup on PTIR 15-min** using **Fibonacci retracement** and recent PA:
#### 📌 **Context**
“PTIR just slammed the 1.618 extension like a brick wall. RSI's giving up, supply’s stacked, and we’ve got a clean Fib ladder down for targets. Time to ride that elevator back to value town. This ain’t the time to chase green — it’s time to fade the froth.”
* Price just tagged the **1.618 Fib extension** from the prior impulse (\$25.30 → \$26.57).
* RSI divergence confirmed → momentum fading.
* Rejection wick at **\$30.24** + supply zone forming → prime shorting conditions.
### 🔻 **Short Setup**
* **Entry Zone (Sell):**
Between **\$29.33 – \$29.44** (Fib extension zone + supply)
* **Stop Loss:**
Above recent high: **\$29.66**
* **Take Profit Levels (using Fib Retracement of entire move \$25.30 → \$30.24):**
* **TP1:** $26.36** (Demand Zone)
### 🧮 **Risk/Reward Estimate**
* Entry: \~\$29.60
* SL: \~\$30.60
* TP: \~\$26.36 → **R\:R \~ 3.25**
*“Markets are never wrong – opinions often are.”* — Jesse Livermore
### ⚠️ **Disclaimer**
This is **not financial advice**. Short setups carry **high risk** — always confirm with your own system and **manage risk** like a pro.
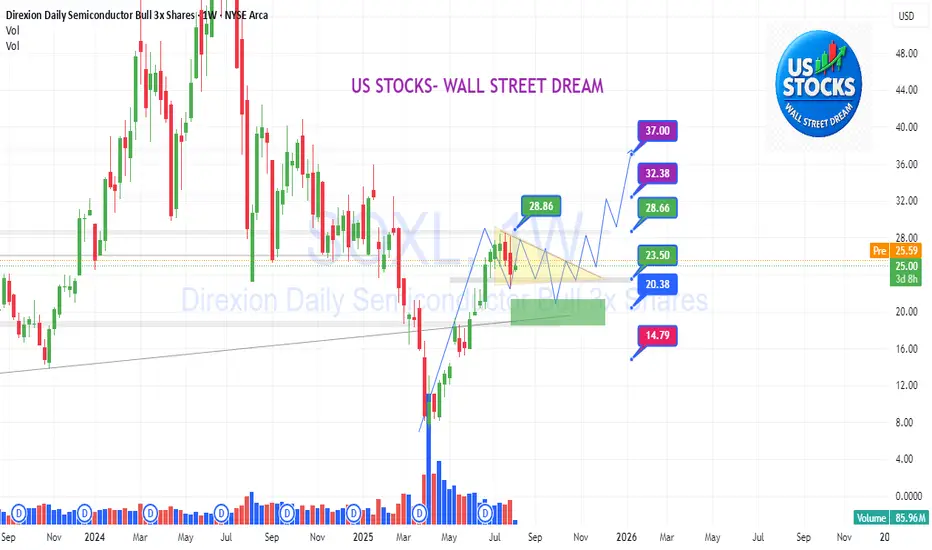
SOXL: A boring reaccumulation phase ahead!SOXL:
-Currently in a boring re-accumulation phase, with supply absorption swings happening within a narrow range and gradually declining volume. Watch for the completion of this process and time your entry when signals appear.
-Don’t forget a potential scenario: a clean shakeout breaking the Inside Bar pattern — and catching the bottom right at that opportunity, if it happens.
.
US STOCKS- WALL STREET DREAM- LET'S THE MARKET SPEAK!
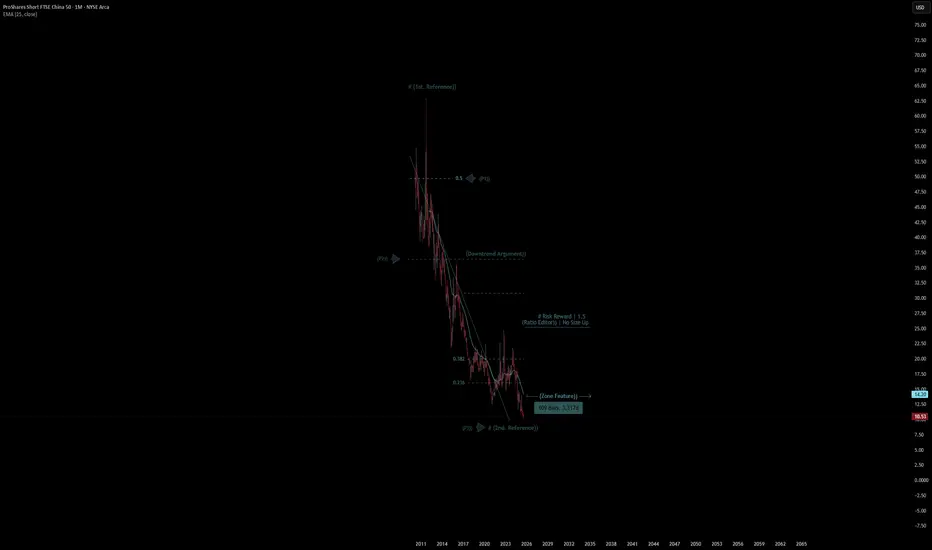
ProShares Short FTSE Quote | Chart & Forecast SummaryKey Indicators On Trade Set Up In General
1. Push Set Up
2. Range Set Up
3. Break & Retest Set Up
Notes On Session
# ProShares Short FTSE - Quote
- Double Formation
* (Downtrend Argument)) At 35.00 USD | Subdivision 1
* # Risk Reward | 1.5 - *(Ratio Editor)) | No Size Up | Completed Survey
* 98 bars, 2.980d | Date Range Method - *(Uptrend Argument))
- Triple Formation
* (P1)) / (P2)) & (P3)) | Subdivision 2
* Weekly Time Frame | Trend Settings Condition | Subdivision 3
- (Hypothesis On Entry Bias)) | Regular Settings
* Stop Loss Feature Varies Regarding To Main Entry And Can Occur Unevenly
- Position On A 1.5RR
* Stop Loss At 28.00 USD
* Entry At 20.00 USD
* Take Profit At 7.00 USD
* (Downtrend Argument)) & No Pattern Confirmation
- Continuation Pattern | Not Valid
- Reversal Pattern | Not Valid
* Ongoing Entry & (Neutral Area))
Active Sessions On Relevant Range & Elemented Probabilities;
European-Session(Upwards) - East Coast-Session(Downwards) - Asian-Session(Ranging)
Conclusion | Trade Plan Execution & Risk Management On Demand;
Overall Consensus | Sell
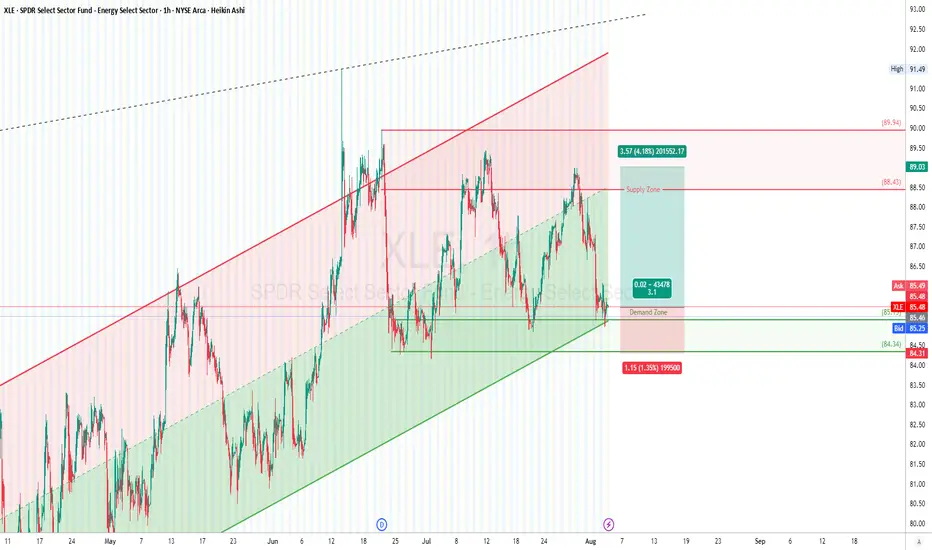
XLE 1H Long Setup🔥 **XLE 1H Long Setup** — SPDR Energy Sector ETF
*Powered by Dubai Traders Hub*
“Energy bulls just tapped the gas at channel support — and the wick says it all. High-prob bounce off demand, riding it up to where the bears got clapped last time. Classic range-to-range flow. Don't sleep on it.”
### 🧠 **Technical Breakdown**
* XLE is trading inside a well-defined **ascending channel** (green zone = bullish midline support).
* Price just tapped into a strong **Demand Zone** at **\$84.30 – \$85.00** — historically defended area.
* Structure supports a **bounce play** toward the upper half of the channel.
### 🟩 **Demand Zone**
* **\$84.31 – \$85.00**: Multi-touch support zone + mid-channel base.
* Entry was sniped right at the bounce wick — showing buyer absorption.
### 🟥 **Supply Zone**
* **\$88.43 – \$89.94**: Resistance cluster + prior rejection highs.
* Perfect zone to TP on mean reversion within channel.
### 🧾 **Trade Setup (Long)**
* **Entry:** \~\$85.49
* **Stop Loss:** \$84.31 (below demand zone structure)
* **Take Profit:** \$89.00 (supply zone)
* **Risk/Reward:** \~**1:3**
*“Buy low in the fear, sell high in the greed.”* — Old trader wisdom
### ⚠️ **Disclaimer**
This is for **educational purposes only**. Not financial advice. Always DYOR and size your risk.
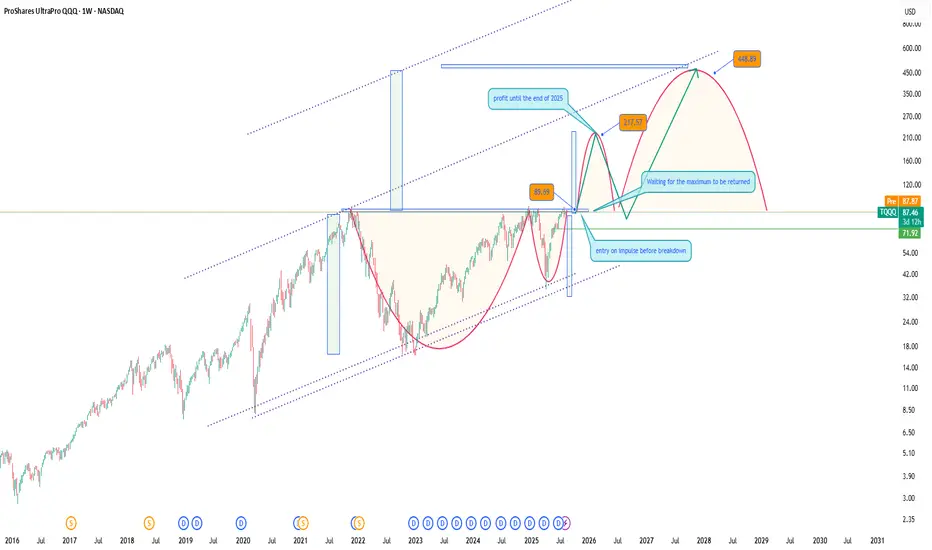
ProShares UltraPro QQQ (TQQQ) LONGThe Technology Sector Continues to Break Records
The tech sector keeps setting new highs, and alongside individual stocks, it's a great idea to consider investing in an ETF that mirrors the profits of the NASDAQ 100 index. One of the most attractive options is TQQQ - it’s more affordable than the index itself, yet offers similar growth potential aligned with the entire tech sector.
I expect continued growth through the end of the year, assuming the geopolitical landscape remains relatively stable.
From a technical standpoint, those looking to minimize risk might prefer to wait for a retest of previous highs. However, my approach is to gradually build a position both before the breakout and after the retest of the highs.
A classic technical analysis pattern -the cup formation, also supports the bullish case for entry. As George Soros wrote in his book: “What moves the market : our expectations or the events themselves?” I’d say it’s both. The key is not to miss the wave.
P.S. Don’t forget: with TQQQ, you also receive dividends - a nice bonus while riding the trend.
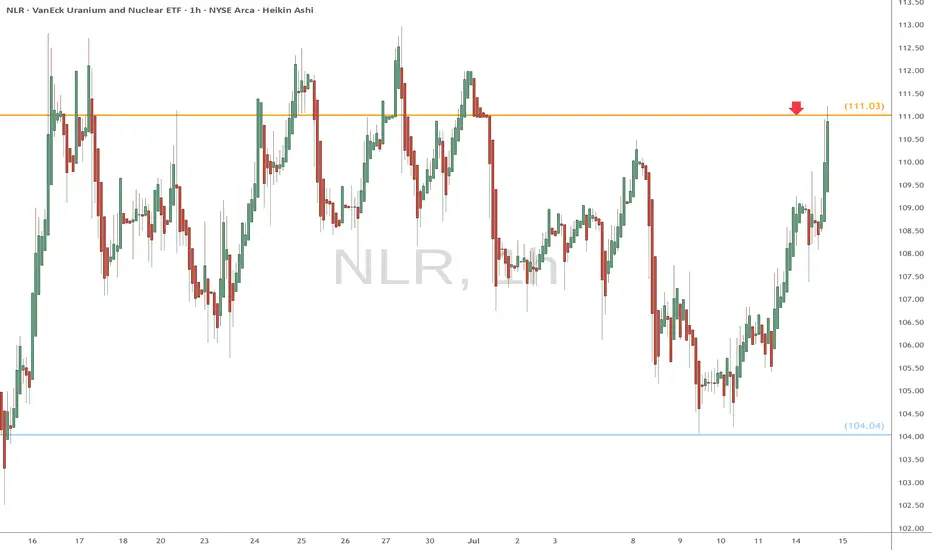
NLR eyes on $111.03: Golden Genesis fib holding up new ATH NLR NLR struggling with this Golden Genesis fib at $111.03
Ultra High Gravity fib has shown its strength repeatedly.
This push might be "the one", the one to finally break away.
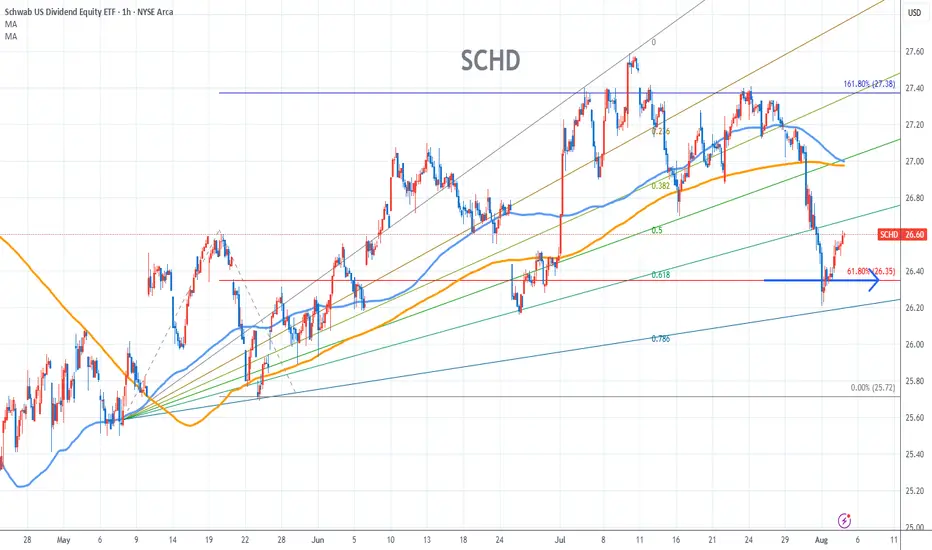
SCHD Chart Fibonacci Analysis 080425Trading Idea
1) Find a FIBO slingshot
2) Check FIBO 61.80% level
3) Entry Point 26.3/61.80%
Chart time frame:B
A) 15 min(1W-3M)
B) 1 hr(3M-6M)
C) 4 hr(6M-1year)
D) 1 day(1-3years)
Stock progress:C
A) Keep rising over 61.80% resistance
B) 61.80% resistance
C) 61.80% support
D) Hit the bottom
E) Hit the top
Stocks rise as they rise from support and fall from resistance. Our goal is to find a low support point and enter. It can be referred to as buying at the pullback point. The pullback point can be found with a Fibonacci extension of 61.80%. This is a step to find entry level. 1) Find a triangle (Fibonacci Speed Fan Line) that connects the high (resistance) and low (support) points of the stock in progress, where it is continuously expressed as a Slingshot, 2) and create a Fibonacci extension level for the first rising wave from the start point of slingshot pattern.
When the current price goes over 61.80% level , that can be a good entry point, especially if the SMA 100 and 200 curves are gathered together at 61.80%, it is a very good entry point.
As a great help, tradingview provides these Fibonacci speed fan lines and extension levels with ease. So if you use the Fibonacci fan line, the extension level, and the SMA 100/200 curve well, you can find an entry point for the stock market. At least you have to enter at this low point to avoid trading failure, and if you are skilled at entering this low point, with fibonacci6180 technique, your reading skill to chart will be greatly improved.
If you want to do day trading, please set the time frame to 5 minutes or 15 minutes, and you will see many of the low point of rising stocks.
If want to prefer long term range trading, you can set the time frame to 1 hr or 1 day.
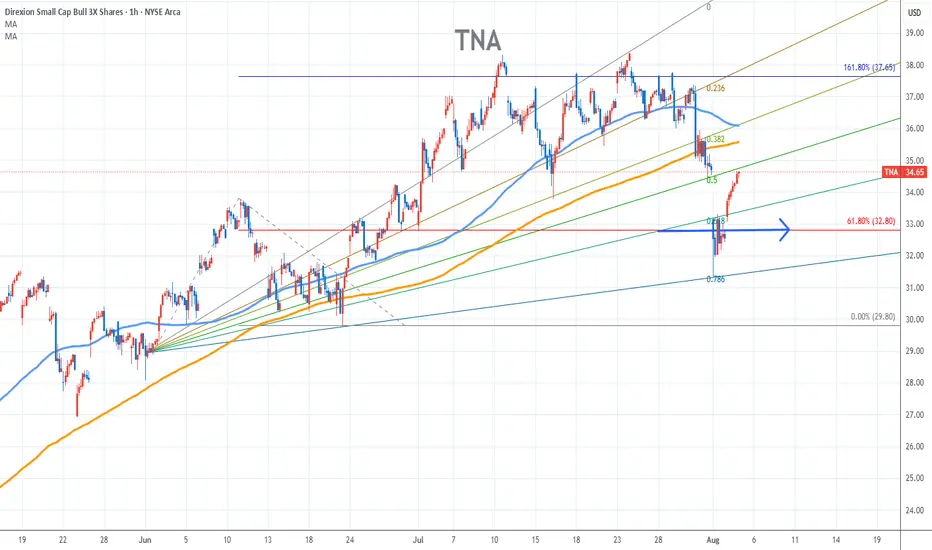
TNA Chart Fibonacci Analysis 080425Trading Idea
1) Find a FIBO slingshot
2) Check FIBO 61.80% level
3) Entry Point 32.8/61.80%
Chart time frame:B
A) 15 min(1W-3M)
B) 1 hr(3M-6M)
C) 4 hr(6M-1year)
D) 1 day(1-3years)
Stock progress:A
A) Keep rising over 61.80% resistance
B) 61.80% resistance
C) 61.80% support
D) Hit the bottom
E) Hit the top
Stocks rise as they rise from support and fall from resistance. Our goal is to find a low support point and enter. It can be referred to as buying at the pullback point. The pullback point can be found with a Fibonacci extension of 61.80%. This is a step to find entry level. 1) Find a triangle (Fibonacci Speed Fan Line) that connects the high (resistance) and low (support) points of the stock in progress, where it is continuously expressed as a Slingshot, 2) and create a Fibonacci extension level for the first rising wave from the start point of slingshot pattern.
When the current price goes over 61.80% level , that can be a good entry point, especially if the SMA 100 and 200 curves are gathered together at 61.80%, it is a very good entry point.
As a great help, tradingview provides these Fibonacci speed fan lines and extension levels with ease. So if you use the Fibonacci fan line, the extension level, and the SMA 100/200 curve well, you can find an entry point for the stock market. At least you have to enter at this low point to avoid trading failure, and if you are skilled at entering this low point, with fibonacci6180 technique, your reading skill to chart will be greatly improved.
If you want to do day trading, please set the time frame to 5 minutes or 15 minutes, and you will see many of the low point of rising stocks.
If want to prefer long term range trading, you can set the time frame to 1 hr or 1 day.