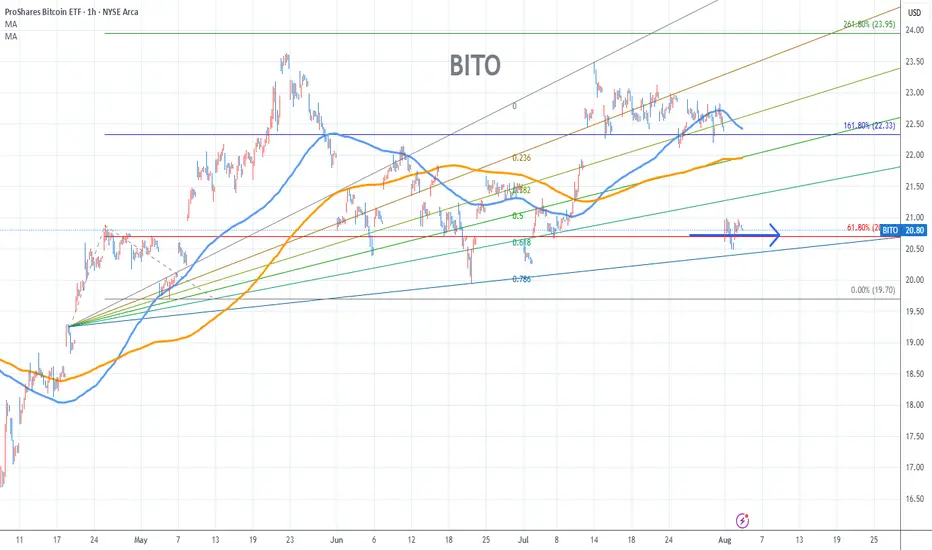
BITO Chart Fibonacci Analysis 080425Trading Idea
1) Find a FIBO slingshot
2) Check FIBO 61.80% level
3) Entry Point 20.7/61.80%
Chart time frame:B
A) 15 min(1W-3M)
B) 1 hr(3M-6M)
C) 4 hr(6M-1year)
D) 1 day(1-3years)
Stock progress:C
A) Keep rising over 61.80% resistance
B) 61.80% resistance
C) 61.80% support
D) Hit the bottom
E) Hit the top
Stocks rise as they rise from support and fall from resistance. Our goal is to find a low support point and enter. It can be referred to as buying at the pullback point. The pullback point can be found with a Fibonacci extension of 61.80%. This is a step to find entry level. 1) Find a triangle (Fibonacci Speed Fan Line) that connects the high (resistance) and low (support) points of the stock in progress, where it is continuously expressed as a Slingshot, 2) and create a Fibonacci extension level for the first rising wave from the start point of slingshot pattern.
When the current price goes over 61.80% level , that can be a good entry point, especially if the SMA 100 and 200 curves are gathered together at 61.80%, it is a very good entry point.
As a great help, tradingview provides these Fibonacci speed fan lines and extension levels with ease. So if you use the Fibonacci fan line, the extension level, and the SMA 100/200 curve well, you can find an entry point for the stock market. At least you have to enter at this low point to avoid trading failure, and if you are skilled at entering this low point, with fibonacci6180 technique, your reading skill to chart will be greatly improved.
If you want to do day trading, please set the time frame to 5 minutes or 15 minutes, and you will see many of the low point of rising stocks.
If want to prefer long term range trading, you can set the time frame to 1 hr or 1 day.
ETF market
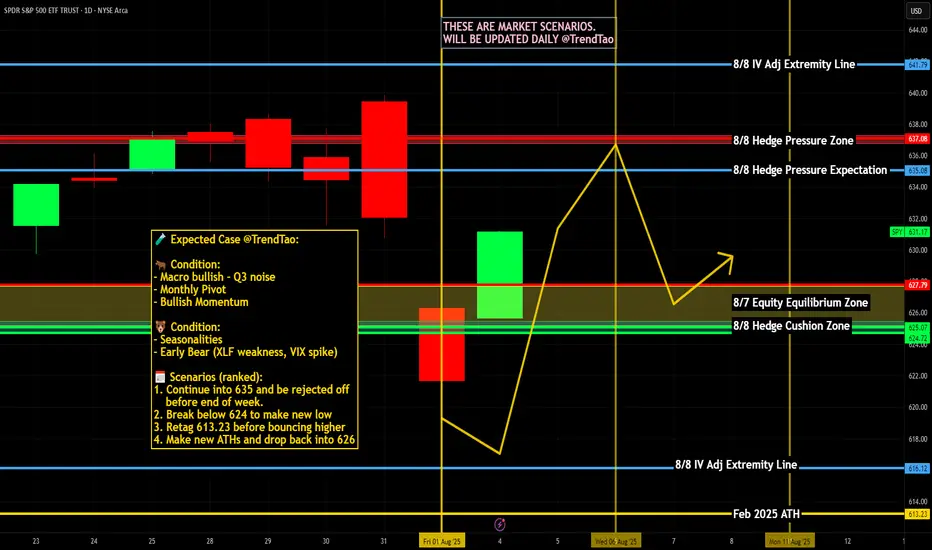
SPY – Bullish Recovery Faces Key Resistance. Aug. 5SPY – Bullish Recovery Faces Key Resistance 🚀
1H Technical Analysis & GEX Overview
SPY has staged a notable recovery from the recent pullback, breaking out of the descending channel and now pressing toward a key resistance cluster near 631–633. This zone aligns with the Highest Positive NETGEX and a 2nd Call Wall, making it a pivotal area to watch for continuation or rejection.
* Support Levels:
* 621–622 → Key structure support and HVL zone (08/04). Losing this could reopen downside toward 615 and 610.
* 615 / 610 → Next downside targets aligned with 2nd & 3rd Put Walls.
* Resistance Levels:
* 631–633 → GEX resistance & 2nd Call Wall; breakout here could fuel a run toward 640+.
GEX Insights
* Positive GEX builds above 628, signaling potential dealer hedging that could limit extreme upside but support gradual climbs.
* Negative GEX dominates under 621, suggesting increased downside momentum risk if price breaks support.
* Put positioning remains elevated at 81.3%, hinting at cautious sentiment but also squeeze potential if shorts get trapped.
Trade Scenarios
* Bullish Case:
* Break and close above 633 opens path to 640+.
* Options: Consider short-term Call spreads targeting 640 if breakout confirmed with strong volume.
* Bearish Case:
* Rejection from 631–633 and break below 621 could send SPY toward 615/610.
* Options: Put spreads targeting 615 with tight risk management.
15-Minute View (Intraday)
* Momentum is holding strong above VWAP, but intraday resistance at 631 is visible.
* A clear BOS above 631 with volume could trigger fast upside continuation intraday.
* Best scalp entries: pullbacks to 628–629 if defended as support.
Outlook
Bias leans cautiously bullish into the 631–633 test. Watch for confirmation on volume before chasing upside. If rejection occurs, expect choppy pullback toward 625–622 for a potential bounce.
Disclaimer: This analysis is for educational purposes only and not financial advice. Always do your own research and manage your risk before trading.
Nightly $SPY / $SPX Scenarios for August 5, 2025🔮 Nightly AMEX:SPY / SP:SPX Scenarios for August 5, 2025 🔮
🌍 Market‑Moving News 🌍
🔹 PBOC Moves Prompt FX Backlash
On August 5, 2019, China’s central bank allowed the yuan to depreciate over 2% to its lowest level since 2008. That same day, the U.S. Treasury officially designated China as a currency manipulator, citing the PBOC’s moves as retaliation for recent U.S. tariff actions. In response, China ordered state-owned enterprises to suspend purchases of U.S. agricultural goods—a significant blow to U.S. exporters.
🔹 EU Suspends Counter-Tariffs for Six Months
Following a negotiated framework with the U.S., the European Union suspended retaliatory tariffs on U.S. goods for six months. The move aims to de-escalate trade tensions while joint discussions continue.
🔹 Citi Raises Gold Price Outlook to $3,500/oz
Citi revised its short-term trading range for gold to $3,300–$3,600 per ounce, based on weakening U.S. labor data, rising inflation pressure from tariffs, and growing demand for safe-haven assets. Spot gold traded around $3,356 oz on Monday.
📊 Key Data Releases & Events 📊
📅 Tuesday, August 5:
8:30 AM ET – U.S. Trade Balance (June)
Expected to improve modestly to –$67.6 billion (from –$71.5B), reflecting tariff-influenced shifts in import/export volumes.
9:45 AM ET – S&P Global U.S. Final Services PMI & ISM Non-Manufacturing Index (July)
Key indicators of service-sector strength. Readings above 50 suggest expansion; below 50, contraction. Flash estimates forecast moderated growth in activity.
⚠️ Disclaimer:
This content is for educational and informational use only—not financial advice. Consult a licensed financial advisor before making investment decisions.
📌 #trading #stockmarket #economy #trade #data #inflation #currency
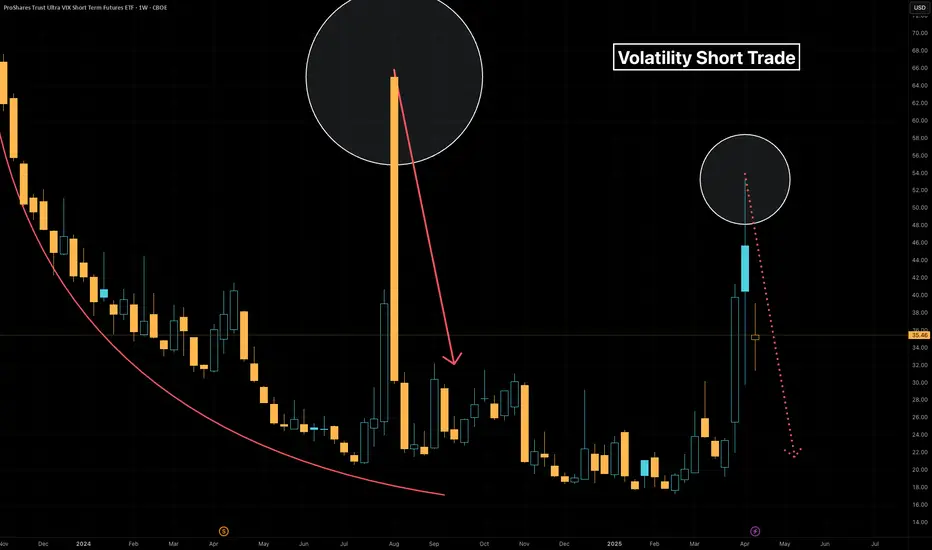
Short Volatility during rare spikes using leveraged ETF $UVXYOverview
Volatility represents how greatly an asset’s prices swing around the mean price. Historically there are rarely brief volatility flare-ups that present trading opportunities. Trying to anticipate volatile events can be costly, because other market participants generally expect the same well known events, and one never knows how big a volatility spike might arise from a given event. Instead if one merely awaits extreme volatility events, which historically are ephemeral, there's a higher probability trade in shorting it. I've thought about this previously, and took the opportunity with Liberation Day to successfully short volatility.
Volatility Instrument Selection
Choosing an appropriate instrument can aid in the likelihood of a successful short position. Among the options CBOE:UVXY looks attractive for the trade, because it's a leveraged ETF, is highly liquid, and provides options with granular strike prices and expiration dates. Leveraged ETFs are known to decline over time due to
Daily rebalancing and compounding effects
Volatility drag
Cost of leverage
Management fees and expenses
Path dependency
These characteristics of leveraged ETFs provide a structural tailwind to a short position, because the instrument naturally declines over time. This phenomenon easy enough to see on a CBOE:UVXY weekly chart
Moreover selection of a liquid product is prudent. At the time of writing CBOE:UVXY has an average daily volume north of $22 million dollars for the past 30 days.
Trade execution
Execution of the trade starts with recognition of a highly volatile event, this is both technical and discretionary. From there a trader is advised to use their preferred tactics to select entry, stop-loss and exit points. Personally I like to use chart patterns across different timeframes in tandem with Relative Strength Index, and to a lesser extent volume to identify trading setups. I use longer term charts to identify a trend, and shorter timeframe charts to determine entry and exit points. The timeframe(s) depend on the particular instrument and what the charts look like at the time of the trade.
During the Liberation Day Volatility Short trade, I've been using 1W, 1D, 4H and 1H charts.
The 1H chart has been suitable for entering an exiting trades. Head & Shoulders patterns have manifested both on price and momentum alongside declining volume. I've posted a couple CBOE:UVXY minds along the way.
Additional Thoughts
Volatility can also be used generally to anticipate moves in other asset classes, such as stocks, bonds, crypto and commodities. Using the levels from that last chart fed into successful NASDAQ:TQQQ & NASDAQ:SQQQ trades in the aftermath of Liberation Day.
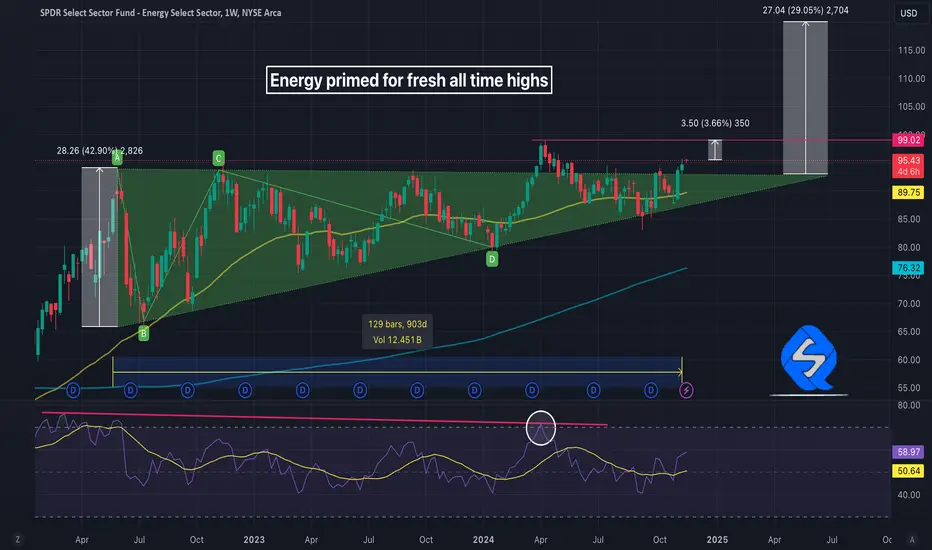
Energy printing fresh highs within weeksHere's a better chart than the one shared in October, showing that energy has been consolidating above an upward sloping triangle formation, over 900 days in the making .
With just under 4% remaining to reach prior highs set in April, fresh highs could be just weeks away. Looking at the height of the triangle to project potential gains, there could be a whopping 30% upside ahead.
Lately I've stepped back to ponder the fundamental underpinnings of this move. During the same period, the price of oil has cratered by 40%.
Charting XLE/BRENT shows an astonishing double during the bullish XLE triangle formation
Could it be something to do with the hot war in Ukraine? Anecdotally we know OPEC+ (Saudio Aramco et al) has continued to hold on output increases, while their western peers (XLE) are pushing more product than ever. One theory is XLE companies have taken market share to account for the decline in prices.
Two questions remain:
would oil prices in the $40's be enough to tank XLE shares?
if XLE can hold historic value during a deeper oil price decline, where could its valuation be headed during the next bull cycle in oil?
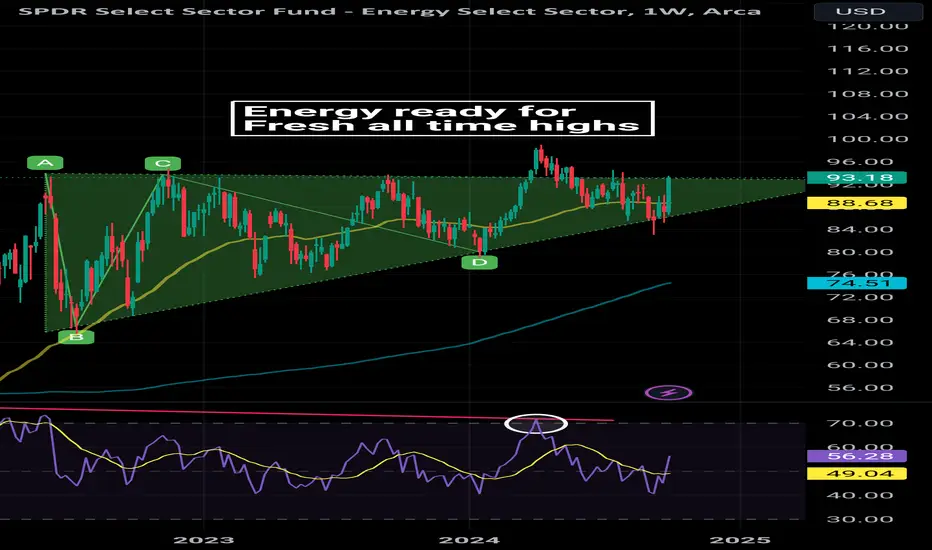
Energy stocks poised for fresh ATHEnergy stocks (XLE) have been in a clear ascending triangle for some months now on the weekly chart. There was a false breakout not too long back, but the pattern held up after breaking down and price is again pushing up against resistance at the top of the triangle.
Having recently posted a massive green candle with the angst in the Middle East, coming weeks and months could bear witness to fresh all time highs.
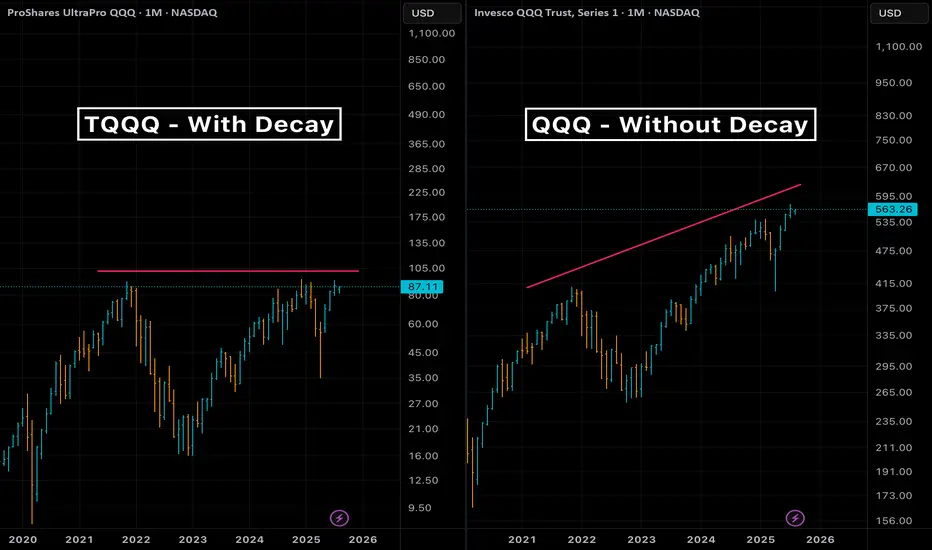
Turning leveraged ETF decay into preyWelcome to this guide on harnessing the natural decay in leveraged ETFs as a strategic edge, rather than fighting against it. We’ll assume you have a basic understanding of options and are comfortable using at-the-money (ATM) strikes as a conservative reference point—advanced users can tailor strike selection to their own edge.
Overview of Leveraged ETFs
What they are and how they reset
• Leveraged ETFs (e.g. NASDAQ:TQQQ , NASDAQ:SQQQ ) aim to deliver a constant multiple (×2 or ×3) of daily returns of an index.
• Inverse ETFs provide –2× or –3× daily exposure without using options.
• Daily reset and compounding create path dependency, leading to “decay” over multi-day holds.
The Decay Mechanism
A quick reminder
• Volatility drag (aka “gamma decay”) causes leveraged ETFs to underperform their stated multiple over longer horizons in sideways or choppy markets.
• The longer you hold beyond one day, the more cumulative leak you face.
Using Decay as a Tailwind
• Rather than avoiding decay, structure trades to benefit from it when your directional bias is robust.
• Combine traditional technical setups with the telescoping of leverage + decay to magnify returns on the correct market view.
• Small notional capital can control large effective exposure via a leveraged ETF + ATM option.
Strategy Execution
• To short the market : buy long puts on a bullish leveraged ETF (e.g. NASDAQ:TQQQ puts).
• To go long the market : buy long puts on an inverse leveraged ETF (e.g. NASDAQ:SQQQ puts).
• Use ATM options for defined risk and to capture both directional move and extra tailwind from ETF decay.
• Position size example: controlling $10k of market exposure might only require $200–$500 in option premium, depending on expiry.
Time Horizon for Decay Tailwind
• Empirically, decay compounds meaningfully over more than one trading day.
• Short-term horizons (2–5 trading days) often capture a useful drift without excessive market risk.
• Back-test your preferred ETF to find the sweet spot for your volatility regime.
High-Volume ETFs to Watch
Bear (inverse) ETFs:
• AMEX:BITI • AMEX:LABD • NASDAQ:SQQQ • AMEX:TZA • AMEX:SOXS • AMEX:SPXS
Bull (long) ETFs:
• AMEX:BITU • AMEX:LABU • NASDAQ:TQQQ • AMEX:TNA • AMEX:SOXL • AMEX:SPXL
Closing Thoughts & Disclaimers
This tutorial highlights how to position decay as a tailwind when your outlook aligns with market direction. Leveraged instruments and options carry amplified risks—only trade with capital you can afford to lose and always define your risk parameters before entry.
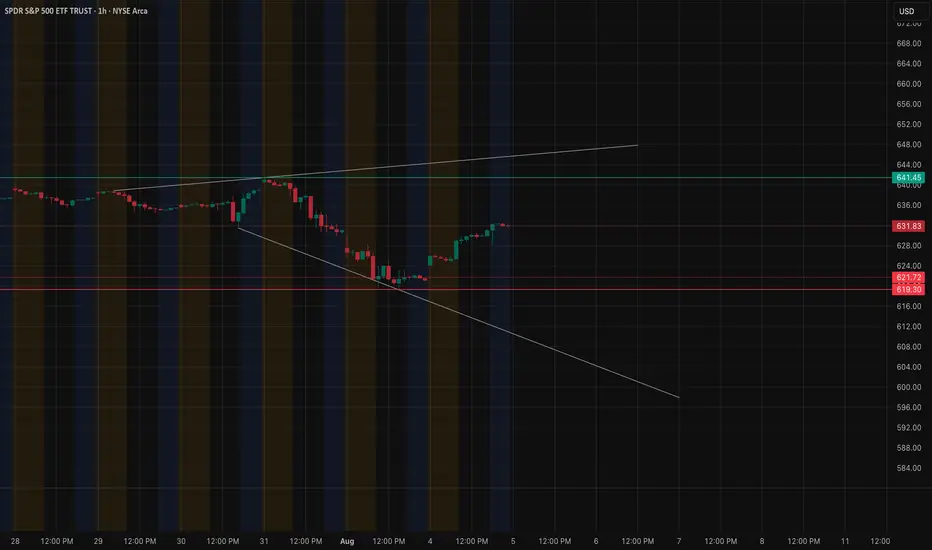
Gapperzville in SPY Both ways“Gappersville” indeed — this SPY 15-minute chart is lit with strategic gaps that are magnetizing price back to equilibrium.
Quick Breakdown:
🔍 Gap Analysis (Intraday Bias)
Two visible unfilled gaps:
First Gap: ~624 to ~627 (partially mitigated)
Second Gap: ~628 to ~630.75 (currently testing EQ of this zone)
Price is now in the Premium Zone (above 0.5 Fibo) from the swing high drop — nearing liquidity sweep territory.
⚙️ Smart Money Concepts (SMC)
Multiple CHoCH and BOS confirm dynamic shifts in structure.
That recent BOS above 627.39 is key — suggesting a short-term bullish microstructure.
Equilibrium at 629.77 is now being tested — price may chop here unless liquidity gets swept above 630.76.
🟦 Discount Zone Support
Deep discount zone lies between 614.06 – 611.96.
This demand zone is still untouched and could act as a high-probability reversion target if the premium structure fails.
🧮 Fibonacci Clusters
Heavy cluster from 630.84 – 633.64 = major confluence + potential rejection/sell zone.
If price gaps up into this zone on low volume, expect short entries from liquidity-based traders.
🔊 Volume Profile
Spike on Aug 2 & 4 suggests buy programs were activated—likely institutional reaction to demand near 620–624.
🔮 Strategic Forecast (as of Aug 4 close)
⚠️ Bearish bias remains intact unless SPY reclaims and closes above 637.57 (weak high).
🎯 Watch for:
Shorts around 633–635 (confluence zone)
Mean reversion into 624.01 or even 619.70
Final demand: 614–612 zone

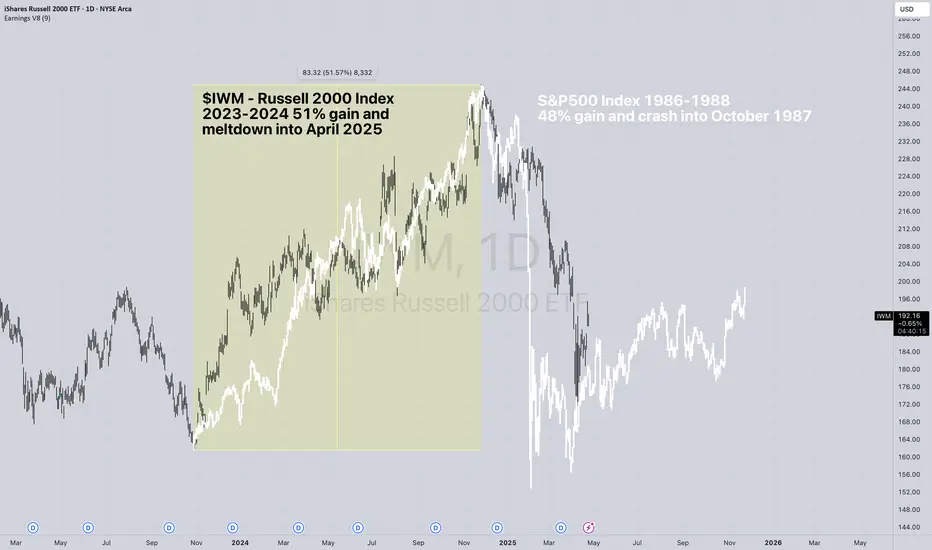
The Ghost of 1986-1987 Stock Market Overlay onto $IWMThe 1986-1987 stock market advance was 48% as measured by the S&P500 Index SP:SPX from the low in late 1986 which peaked in August 1987 and crashed into October 19th's spectacular 20% decline in one day.
The advance in the Russell 2000 Index from the low in 2023 to the high in 2024 was 51%, topping the 48% gain in the SP:SPX and the meltdown wasn't as spectacular, but it was similar.
There were similar patterns in fears of trade wars, US dollar declines, new tax laws going into effect back then and tax laws sunsetting this time. Those you can go into by reviewing my other charts I have published over the years here.
I stretched the 1987 pattern to fit the low to the high, so it isn't "exactly" the same time day-to-day for this pattern.
I found it interesting because the chart of AMEX:IWM all by itself had the same "look" to me as the 1987 bull market and crash so I decided to put it together for you all here to see.
I would expect a choppy market from here on as people adjust to the new uncertainties. Sellers of this decline will be shy to reinvest anytime soon and buyers are likely afraid to step up and get aggressive with so much uncertainty.
Sentiment as measured by AAII shows an extremely fearful and reluctant investor class, which is typical to see at major market bottoms.
Wishing everyone peace and prosperity!
Tim West
11:17AM EST April 24, 2025
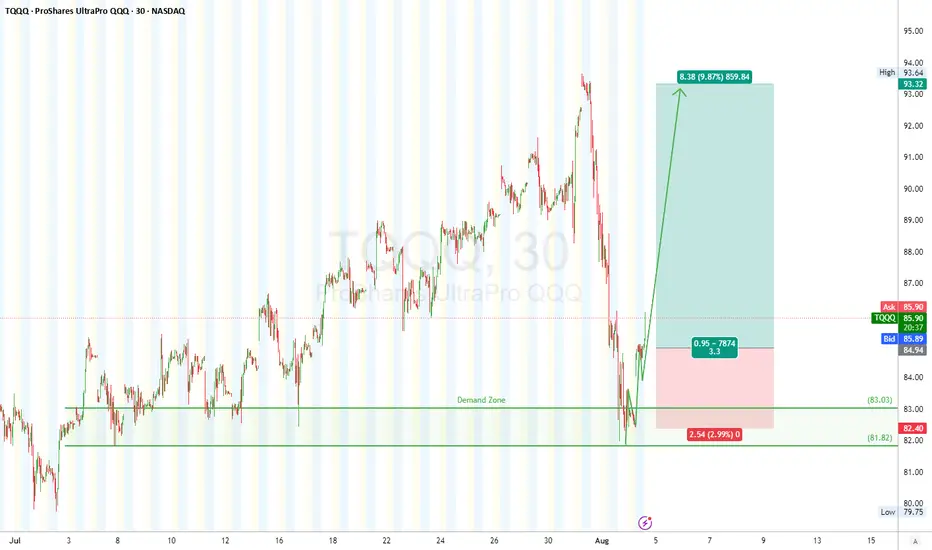
TQQQ Long SetupTQQQ 30-min Chart
Classic textbook move — 5-wave dump, corrective ABC grind, RSI divergence, and now we’re gunnin’ for that sweet Wave (3) explosion. Bulls sniped the bottom like sharpshooters at \$82–83. Strap in — this one’s cookin’ for a breakout!
### 🟩 **Demand Zone (Reversal Area)**
* Strong **demand zone** between **\$82.40 – \$83.75**, confirmed by previous price reactions and RSI divergence.
* Price reacted perfectly at this demand zone, tagging bottom at **\$81.82**.
### 🟥 **Supply Zone (Target Area)**
* Initial resistance/supply around **\$93.30 – \$94.00** — end of Wave (1) structure and prior sell-off zone.
### 🧾 **Trade Setup (Long)**
* **Entry:** \$84.06 (already triggered)
* **Stop Loss:** \$81.82 (beneath the low of Wave (2))
* **Take Profit:** \$93.30 (top of Wave (1) — valid for Wave (3) rally)
* **Risk/Reward:** \~**1:3.3** (Solid R\:R setup)
*“The goal of a successful trader is to make the best trades. Money is secondary.”* — Alexander Elder
### ⚠️ **Disclaimer**
This analysis is for educational purposes only and not financial advice. Always do your own research and manage risk accordingly. Trade safe! 💼📉
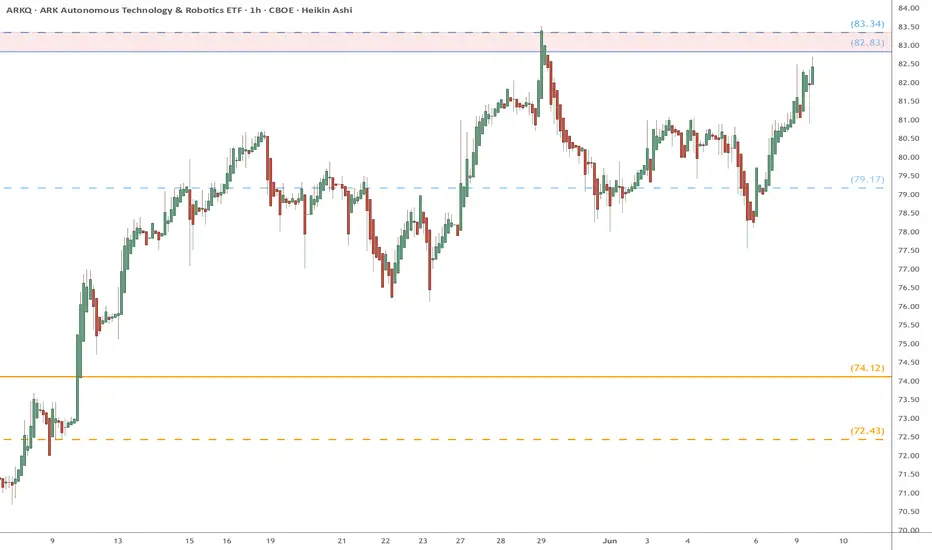
ARKQ heads up at $83.xx: Proven Resistance break should RUN hardARKQ about to try a well proven resistance again.
Dual fibs mark the rejection zone $82.83-83.34
Looking for a Break-and-Retest for long entries.
$IBITIn crypto there are only two lines.
We would be lucky if we blessed in Dec with:
IBIT 42$
Bitcoin 75K$

A potential Swing Trade soon on SPY!?OptionsMastery:
🔉Sound on!🔉
📣Make sure to watch fullscreen!📣
Thank you as always for watching my videos. I hope that you learned something very educational! Please feel free to like, share, and comment on this post. Remember only risk what you are willing to lose. Trading is very risky but it can change your life!

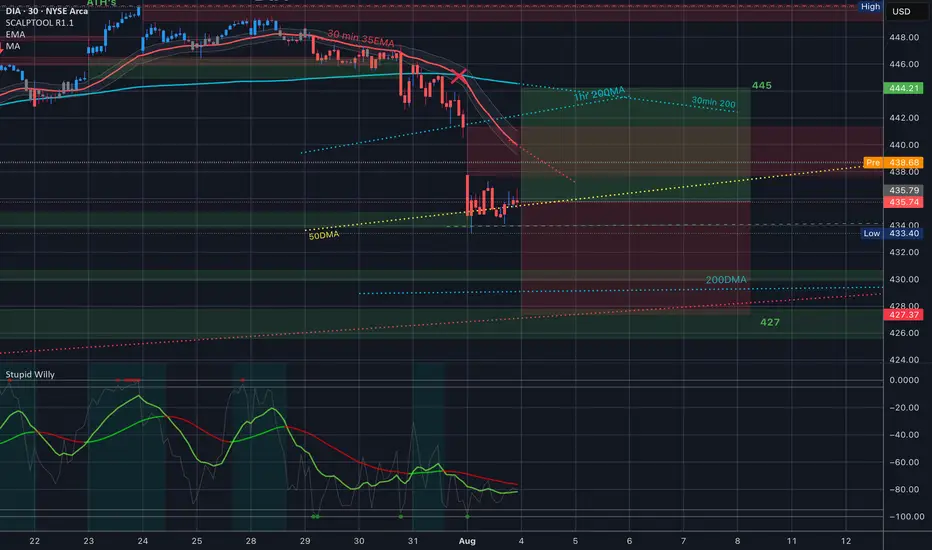
$DIA Analysis, Key Levels & Targets 8.4.25
Today’s Trading Range - sitting right on top of the 50 Day Moving Average - we have a great range expansion here from last Friday’s drop. Some interesting targets here. Let me know what you see.
Look at this Battle zone today!! Grab this chart - and let’s go
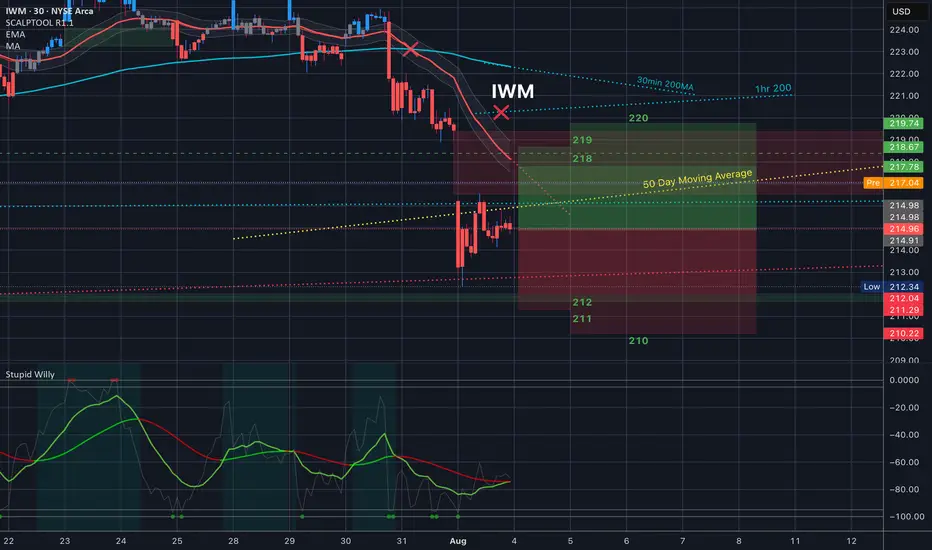
$IWM Analysis, Key Levels & Targets 8.4.25
Today’s Trading Range - we have a great range expansion here from last Friday’s drop. Some interesting targets here. Let me know what you see.
Look at this Battle zone today!! Grab this chart - and let’s go
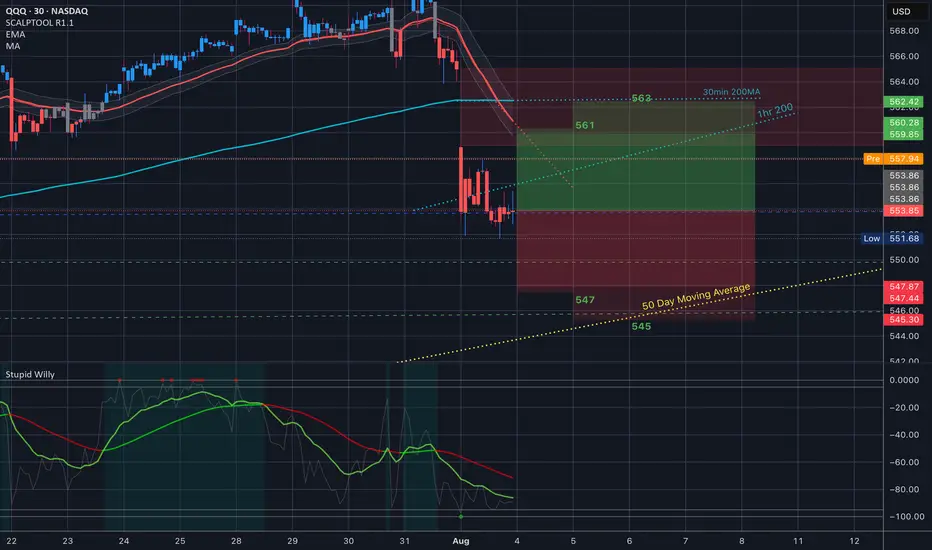
$QQQ Analysis, Key Levels & Targets 8.4.25
Today’s Trading Range - we have a great range expansion here from last Friday’s drop. Some interesting targets here. Let me know what you see.
Grab this chart - and let’s go
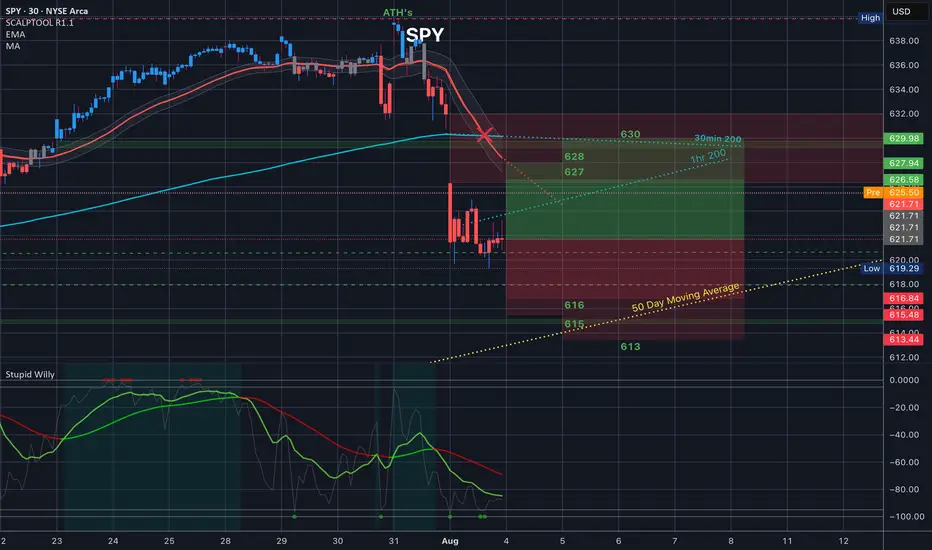
$SPY Analysis, Key Levels & Targets 8.4.25
Today’s Trading Range - we have a great range expansion here from last Friday’s drop. Some interesting targets here. Let me know what you see.
QQQ (+ QLD, TQQQ) , Stay heavy on positionsQQQ (+ QLD, TQQQ) , Stay heavy on positions
Despite downside volatility, the trend remains intact. I’m maintaining the same view as before—this is still a zone to stay heavy.

SPYThe red lines are major swing points & levels in price action going down for puts vs the green line which are the same vs their going up for calls

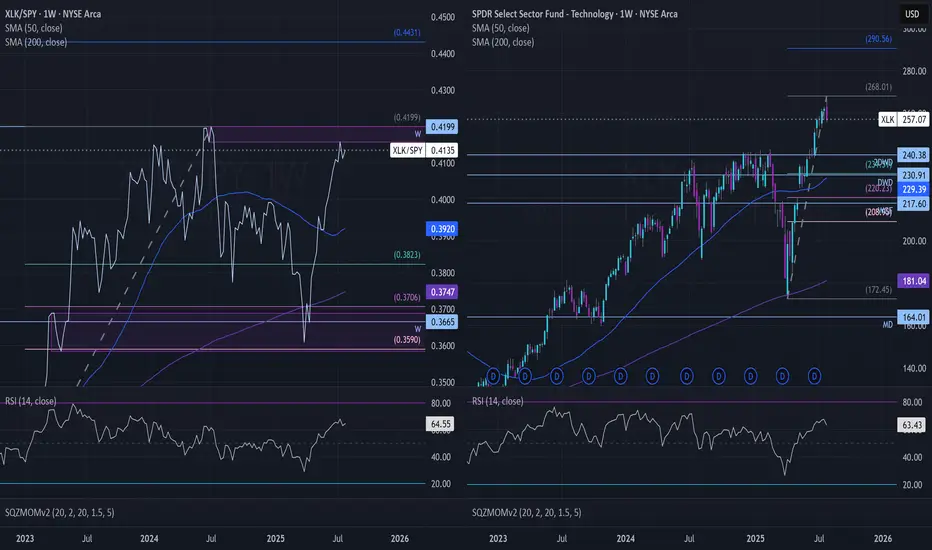
XLK Relative Strength – Leaders Extended, Rotation Risk BuildingXLK has been one of, if not the strongest sectors on a relative basis since bottoming at the end of March. Despite its relative strength, top SXLK holdings are into areas where profit-taking looks to be occurring, and a rotation out may be taking place (see Weekly Supply zone on RS chart 0.4157-0.4199).
This comes as NASDAQ:NVDA , NASDAQ:MSFT , NASDAQ:AVGO , and NASDAQ:INTU are into -0.236 fib. extensions. NYSE:ORCL and NASDAQ:PLTR show a similar picture, with NYSE:ORCL reaching the 1.618 extension, while NASDAQ:PLTR failed to reach its 1.618 extension at $162.05.
Weak:
$APPL, NYSE:CRM , NYSE:IBM , and NYSE:NOW are among the weakest performers. If $APPL doesn’t hold around $200.00, look for it to slump to the $170.00 area.
Trades:
Look for NASDAQ:AMAT to hold around $169.46 for a move to $205.06 (Weekly Supply) or $243.40 (Monthly supply). If NASDAQ:AMAT fails to hold the $169.46 print, expect a move to $156.75.
Look for NASDAQ:QCOM to hold $145.20 (Weekly) for a move to the $172.23 area (Weekly Supply).
Look for NASDAQ:ADBE to hold $329.30 for a move to $449.40 (could top out around $417.30 depending on buying volume).
Look for NYSE:ACN to hold $250.00 (Weekly), or I like it better a $218.32 (Monthly Demand).
Featured Chart:
Look for NYSE:APH to hold $100.71 (Daily close on 07/23) for a move up to $116.00-$116.50 area. If NYSE:APH fails to hold around the $100.00 mark, I’d expect a move below $95.00.
AMEX:XLK move down to $240.38?
Let me know your thoughts for or against any of these names in the comments.
XETR:AMEX :
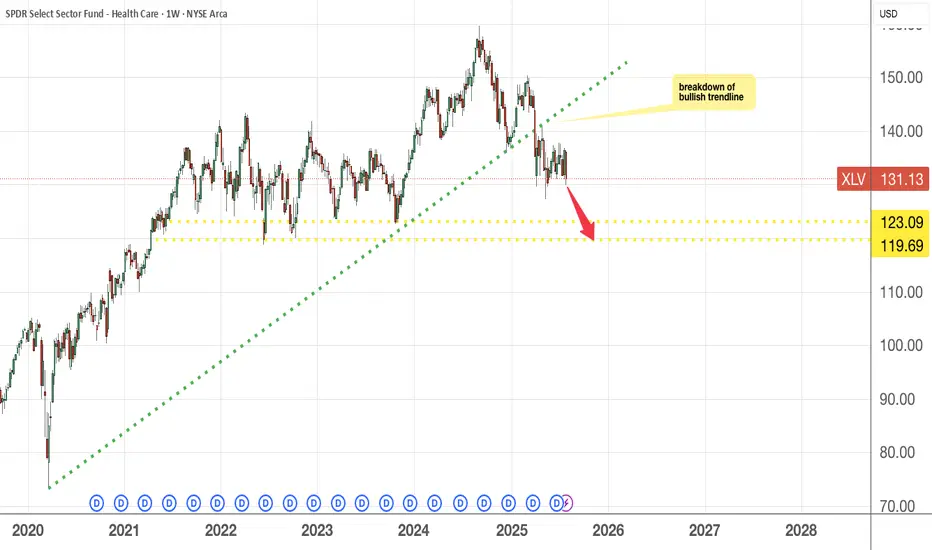
Getting your ammunition to buy XLV ETFI expect the price to continue to head south in the coming weeks and find support at 119-123 price level. Then, it would have fallen 25% from the peak and hopefully, at this support level, we can see a turnaround in the price movement.
It is also possible that prices may fall a bit further below this support level to create a bear trap before it rebounds.
No shorting just patiently awaiting for prices to come down before buying !
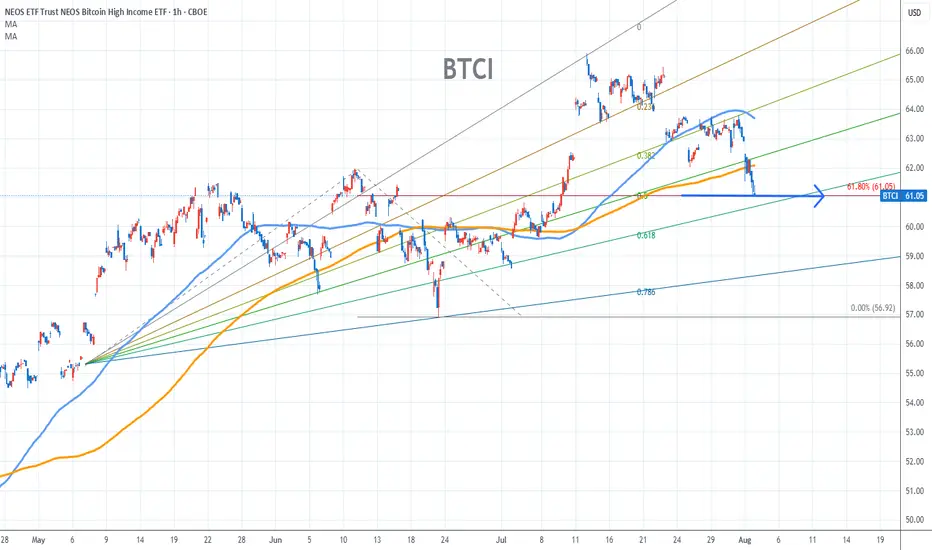
BTCI Chart Fibonacci Analysis 080325Trading Idea
1) Find a FIBO slingshot
2) Check FIBO 61.80% level
3) Entry Point 61/61.80%
Chart time frame:B
A) 15 min(1W-3M)
B) 1 hr(3M-6M)
C) 4 hr(6M-1year)
D) 1 day(1-3years)
Stock progress:C
A) Keep rising over 61.80% resistance
B) 61.80% resistance
C) 61.80% support
D) Hit the bottom
E) Hit the top
Stocks rise as they rise from support and fall from resistance. Our goal is to find a low support point and enter. It can be referred to as buying at the pullback point. The pullback point can be found with a Fibonacci extension of 61.80%. This is a step to find entry level. 1) Find a triangle (Fibonacci Speed Fan Line) that connects the high (resistance) and low (support) points of the stock in progress, where it is continuously expressed as a Slingshot, 2) and create a Fibonacci extension level for the first rising wave from the start point of slingshot pattern.
When the current price goes over 61.80% level , that can be a good entry point, especially if the SMA 100 and 200 curves are gathered together at 61.80%, it is a very good entry point.
As a great help, tradingview provides these Fibonacci speed fan lines and extension levels with ease. So if you use the Fibonacci fan line, the extension level, and the SMA 100/200 curve well, you can find an entry point for the stock market. At least you have to enter at this low point to avoid trading failure, and if you are skilled at entering this low point, with fibonacci6180 technique, your reading skill to chart will be greatly improved.
If you want to do day trading, please set the time frame to 5 minutes or 15 minutes, and you will see many of the low point of rising stocks.
If want to prefer long term range trading, you can set the time frame to 1 hr or 1 day.
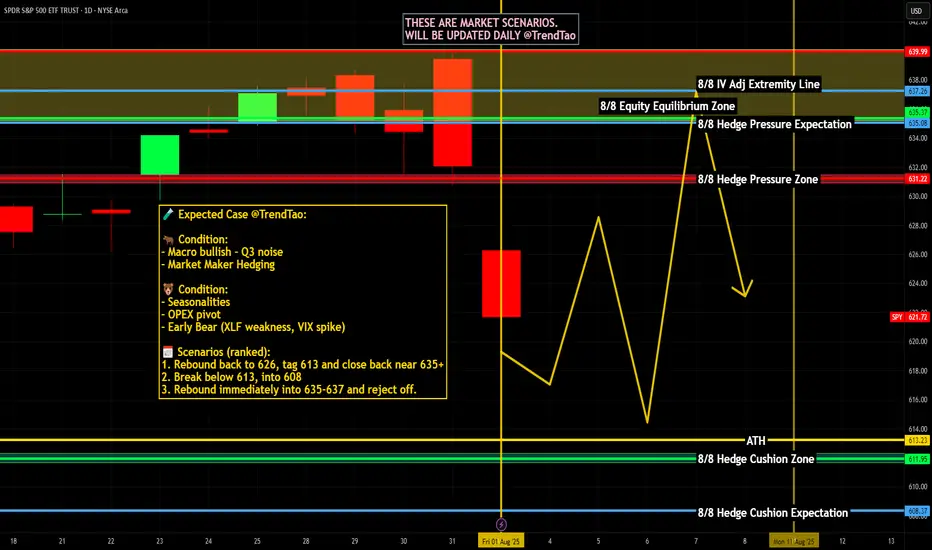
Weekly $SPY / $SPX Scenarios for August 4–8, 2025🔮 Weekly AMEX:SPY / SP:SPX Scenarios for August 4–8, 2025 🔮
🌍 Market-Moving News 🌍
📦 U.S. Tariffs Finalized as August 7 Deadline Nears
President Trump’s administration confirmed newly finalized tariff rates—ranging from 10% to over 40%—on dozens of countries, set to take effect starting August 7. The announcement has heightened global trade uncertainty and injected volatility into equity markets
📉 Weak Jobs Data Spurs Concern
July’s nonfarm payrolls came in at just 73,000 jobs added, far below expectations, while revisions to May and June data subtracted a combined 258,000 jobs. In response, the administration fired the Bureau of Labor Statistics head, escalating political risk around economic transparency
📈 U.S. Shows Resilience Amid Policy Chaos
Despite the tariff-era turbulence and labor softness, U.S. Q2 GDP rose by 3%—outperforming forecasts. Businesses racked up inventory as a hedge, absorbing initial price shocks. Still, concerns about sustained inflation pressures and waning consumer confidence linger
🎯 Earnings Week Spotlight on Tech & Industrial Names
Major companies reporting include Palantir (Monday), AMD, Uber, Disney, McDonald’s, Gilead, Pfizer, Constellation Energy, and Eli Lilly. Markets will watch for AI signals, consumer demand, and industrial trends
📊 Key Data Releases & Events 📊
📅 Monday, August 4
Factory Orders (June) — Critical for industrial demand and trade momentum.
📅 Tuesday, August 5
ISM U.S. Services PMI (July) — Thermometer for expansion in the biggest part of the economy.
S&P U.S. Services PMI (July, flash) — Preliminary signal on service-sector strength.
Trade Balance (June) — Watching for impact of tariffs and shifting cross-border flows.
📅 Thursday, August 7
Initial & Continuing Jobless Claims — Weekly labor-market readings post weak payroll report.
Productivity & Labor Costs (Q2) — Reflect business efficiency and wage trend shifts.
Wholesale Inventories (June) — Key for supply-chain and inventory cycle insights.
Consumer Credit (June) — Measures household borrowing resilience.
📅 Friday, August 8
Fed Speech: St. Louis Fed President Musalem — Market-watchers will look for cues on the near-term rate path.
⚠️ Disclaimer:
This weekly outlook is for educational and informational purposes only and should not be construed as financial advice. Always consult a licensed financial advisor before making investment decisions.
📌 #trading #stockmarket #economy #tariffs #jobs #earnings #inflation #Fed #technicalanalysis