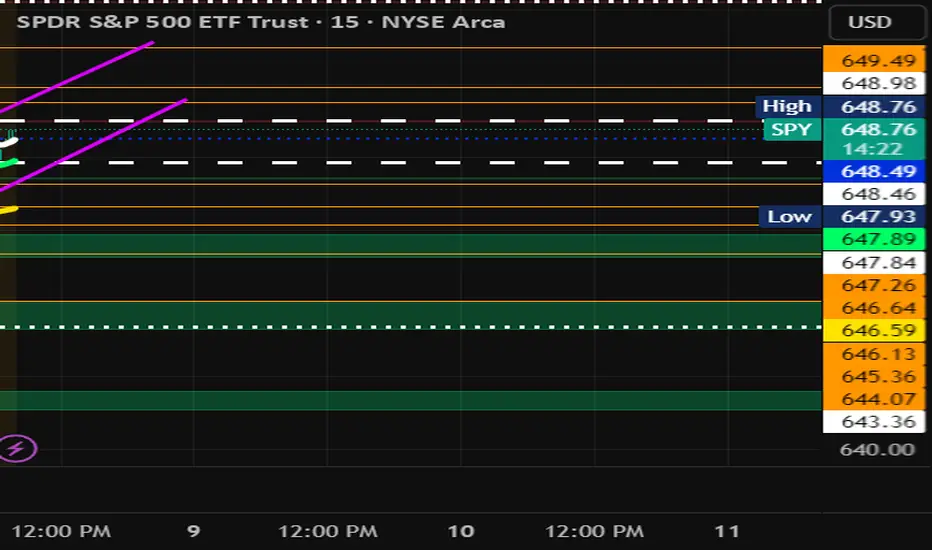
SPY Play 9/8/25Look for break of PMH and hold for CALLS and Break of PML for PUTS. It is also in a channel which provides more confirmation if it breaks either side. It appear to be forming a Bear Flag on the 15 min. So be cautious and wait first 15-30 mins. If PUTS look for SPY to come down to 646.17 if it breaks and hold that with volume SPY maybe headed to 643 territory. But in all things do your due diligence and be patient. Let the trade prove to you which direction. the range as of now is 647.84-648.98 - no trade between this range. If it decides to do calls look for 649.49-9 as first TP and if it go pass that look to recapture PDH. Let's Go. #YouGotOptions
“Discipline in trading is doing what your plan says even when your emotions scream otherwise. Consistency beats impulse every time.”
ETF market
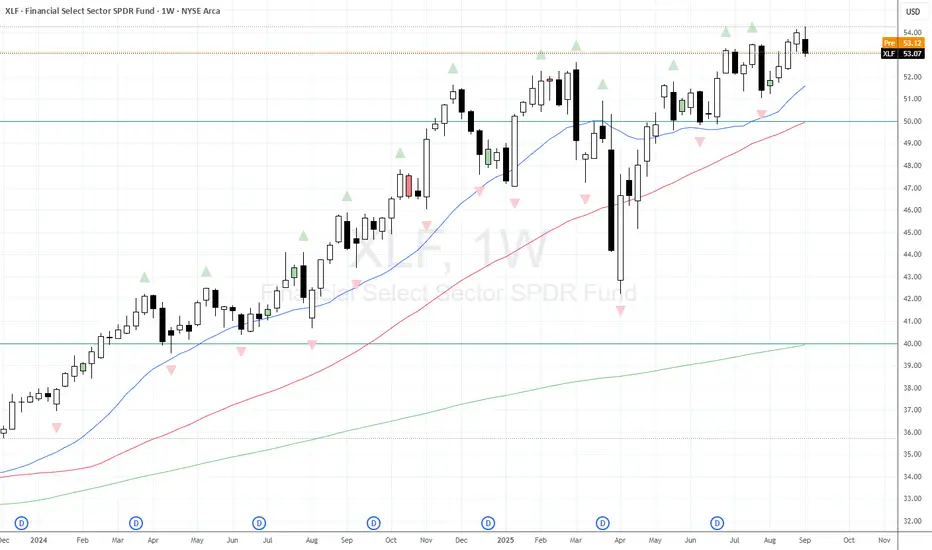
Weekly Bearish Key Reversal on XLFXLF has provided a great trend (and moral support) to the bullish trend we've seen recently. However a Weekly Bearish Key Reversal on XLF might be a moment for a pause before data later this week and FOMC the week after. Take a look at some of the US Banks weekly charts as well.
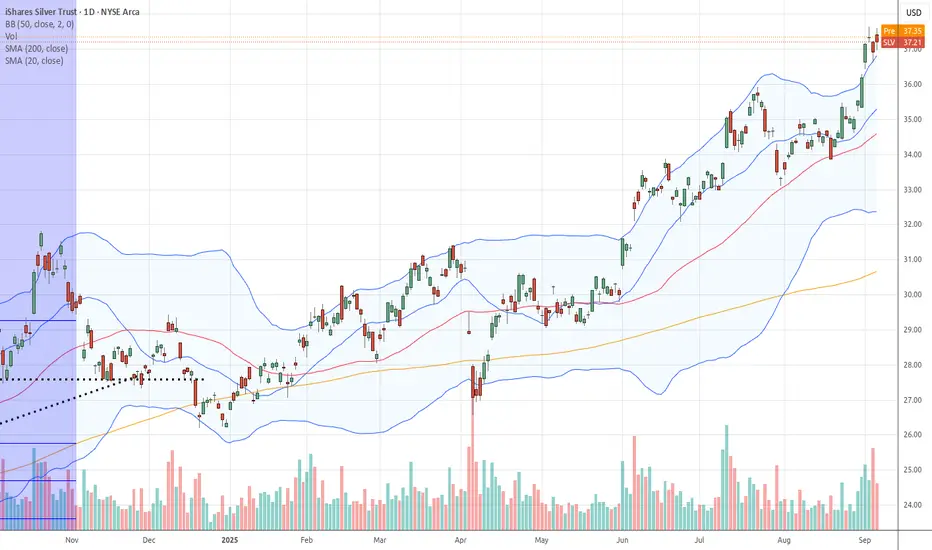
$SLV Tradespoon – Long Entry $36.93Tradespoon model generated long signal for AMEX:SLV . Predicted range: $36.57–$37.39. Trend: -0.08% (short-term), upside potential toward $39.60 near term. AMEX:SLV
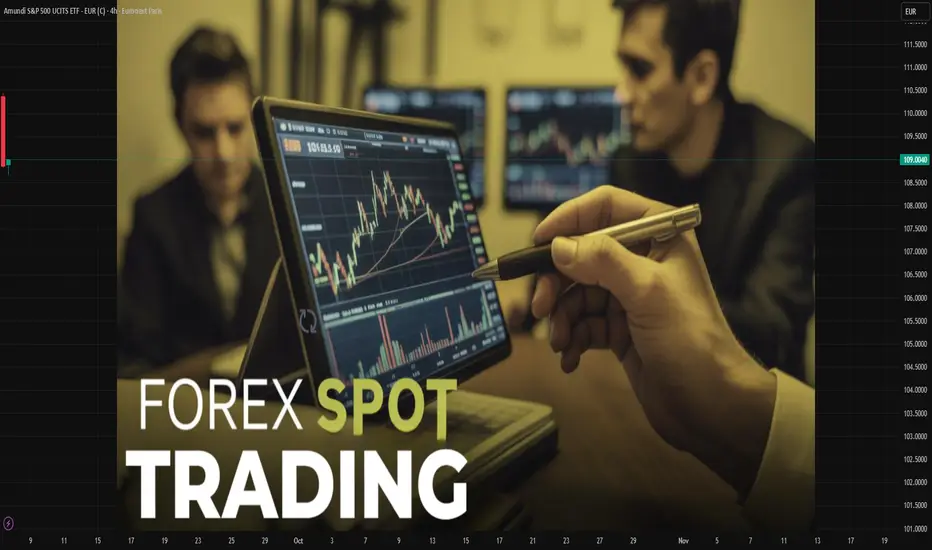
Spot Forex Trading1. Introduction to Spot Forex Trading
In the world of global finance, foreign exchange (Forex) stands as the largest and most liquid market. With a daily trading volume surpassing $7.5 trillion (as per the Bank for International Settlements), the Forex market dwarfs equities, bonds, and commodities combined. At the very core of this enormous ecosystem lies the spot Forex market, where currencies are exchanged instantly “on the spot.”
Spot Forex trading is not only the foundation of international trade and investments but also the most popular form of retail currency speculation. Unlike forward or futures contracts, the spot market involves a direct exchange of one currency for another at the prevailing market rate, typically settled within two business days. For traders, it is the purest way to participate in currency fluctuations and capitalize on global economic dynamics.
In this guide, we’ll explore the mechanics, strategies, risks, and opportunities of spot Forex trading in depth.
2. What is Forex & How the Spot Market Works?
Forex (FX) is short for foreign exchange – the global marketplace where national currencies are exchanged. Currencies are always traded in pairs (e.g., EUR/USD, USD/JPY, GBP/INR) because one is bought while the other is sold.
The spot Forex market is the part of FX where transactions occur “on the spot” at the current market price (known as the spot rate). While in practice settlement usually occurs within T+2 days (two business days), retail traders through brokers see it as instantaneous execution.
Example:
If EUR/USD = 1.1000, it means 1 Euro = 1.10 US Dollars.
A trader buying EUR/USD expects the Euro to appreciate against the Dollar.
If the pair moves to 1.1200, the trader profits; if it drops to 1.0800, the trader loses.
The beauty of spot Forex lies in its simplicity, liquidity, and accessibility.
3. Key Features of Spot Forex
Decentralized Market – Unlike stocks traded on exchanges, Forex is an OTC (over-the-counter) market. Trading happens electronically via banks, brokers, and liquidity providers.
High Liquidity – The sheer size ensures that major pairs (like EUR/USD) have tight spreads and minimal slippage.
24-Hour Trading – Forex operates 24/5, from the Sydney open (Monday morning) to New York close (Friday evening).
Leverage – Traders can control large positions with small capital, magnifying both profits and losses.
Accessibility – With brokers and trading platforms, retail traders worldwide can access spot Forex with as little as $50.
4. Major Currencies & Currency Pairs
Currencies are categorized into majors, minors, and exotics.
Major Pairs (most traded, high liquidity): EUR/USD, GBP/USD, USD/JPY, USD/CHF, USD/CAD, AUD/USD, NZD/USD.
Cross Pairs (without USD): EUR/GBP, EUR/JPY, GBP/JPY, AUD/JPY.
Exotic Pairs (emerging market currencies): USD/INR, USD/TRY, USD/ZAR.
Most spot Forex volume is concentrated in majors, especially EUR/USD, which alone makes up ~25% of daily turnover.
5. Spot Forex vs. Forwards & Futures
Feature Spot Forex Forward Contracts Futures Contracts
Settlement T+2 days (practically instant for traders) Custom date agreed Standard dates
Trading Venue OTC (banks, brokers) OTC Exchange-traded
Flexibility High High Limited (standardized)
Use Case Speculation, trade settlement Hedging by corporates Hedging & speculation
Spot Forex is more liquid and flexible than forwards and futures, making it the preferred market for short-term traders.
6. Market Participants
The spot Forex market is vast, with multiple players:
Central Banks & Governments – Influence currency supply, demand, and stability.
Commercial Banks – The backbone of FX, providing liquidity and interbank trading.
Corporations – Engage in Forex to settle international trade and hedge risks.
Hedge Funds & Institutional Investors – Speculate with huge volumes, influencing trends.
Retail Traders – Millions of individuals trading through brokers.
Retail trading, though small compared to institutions, has grown rapidly due to online platforms.
7. How Spot Forex Trading is Conducted
Trading Platforms – MetaTrader (MT4/MT5), cTrader, and proprietary broker platforms.
Execution Models:
Market Maker – Broker sets bid/ask spread.
STP/ECN – Orders sent directly to liquidity providers, offering raw spreads.
Pricing – Derived from interbank market quotes.
Spreads & Commissions – Brokers earn via spreads or commissions per trade.
Execution speed, spreads, and broker reputation matter greatly in Forex trading.
8. Leverage & Margin in Spot Forex
One of the most attractive yet dangerous features of spot Forex is leverage.
Example: With 1:100 leverage, a trader can control a $100,000 position with just $1,000 margin.
Margin call occurs if losses reduce equity below required margin.
High leverage allows for big profits but equally big losses—making risk management essential.
9. Factors Influencing Currency Prices
Currencies reflect global macroeconomics. Key drivers:
Interest Rates – Higher rates attract investors (stronger currency).
Inflation – High inflation erodes purchasing power (weaker currency).
Economic Data – GDP, jobs reports, CPI, trade balance.
Political Stability – Elections, wars, policy changes impact FX.
Global Risk Sentiment – “Risk-on” favors emerging markets; “Risk-off” drives money to USD, JPY, CHF.
Central Bank Actions – QE, rate hikes, interventions move currencies massively.
10. Trading Strategies in Spot Forex
Scalping – Very short-term, multiple trades for a few pips profit.
Day Trading – Open/close trades within a day, avoiding overnight risk.
Swing Trading – Holding positions for days/weeks to capture larger moves.
Trend Following – Riding long-term momentum.
Counter-Trend Trading – Betting on reversals at key levels.
Carry Trade – Borrowing in low-interest currency (JPY) to invest in high-yield (AUD, NZD).
Each strategy has its own risk-reward profile and suits different personalities.
Conclusion
Spot Forex trading is a fascinating arena where global economics, politics, and psychology meet. It is the purest and most direct form of currency exchange, providing unmatched liquidity, accessibility, and opportunity. However, with great potential comes great risk—especially due to leverage.
For those who approach it with education, discipline, and risk management, spot Forex can offer immense opportunities. For the unprepared, it can be unforgiving.
In the end, success in Forex isn’t about predicting every move—it’s about managing risk, staying consistent, and playing the probabilities wisely.
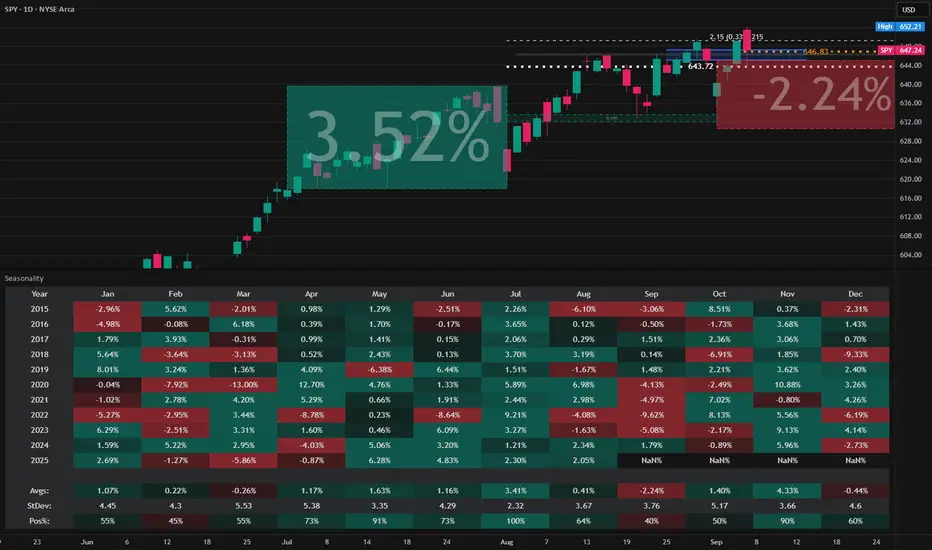
SPY Outlook – Key Levels & ProbabilitiesSPY Outlook – Key Levels & Probabilities
SPY is sitting on a rising trendline and testing the 647 zone near the .618 retracement. Market structure shows a tug-of-war between bulls holding trend support and sellers guarding supply overhead.
🔑 Levels to Watch
Support: 645–643 (trendline + Fib cluster), deeper at 639.3
Resistance: 651–653 supply zone, breakout target 658 (Fib extension)
Liquidity Pools: 630–628 if support fails
📊 Probabilities
Bullish Case (60%) → Hold above 643 → upside push into 652–658
Bearish Case (40%) → Break below 643 → drop toward 639, possibly 630–628
🎯 Trade Map
Long setup: Enter near 645–643, stop below 641, targets 652 → 658
Short setup: Fade rejection at 652–653, stop above 654, target 639
⚡Bias remains bullish while above 643. A clean break below flips the script bearish.
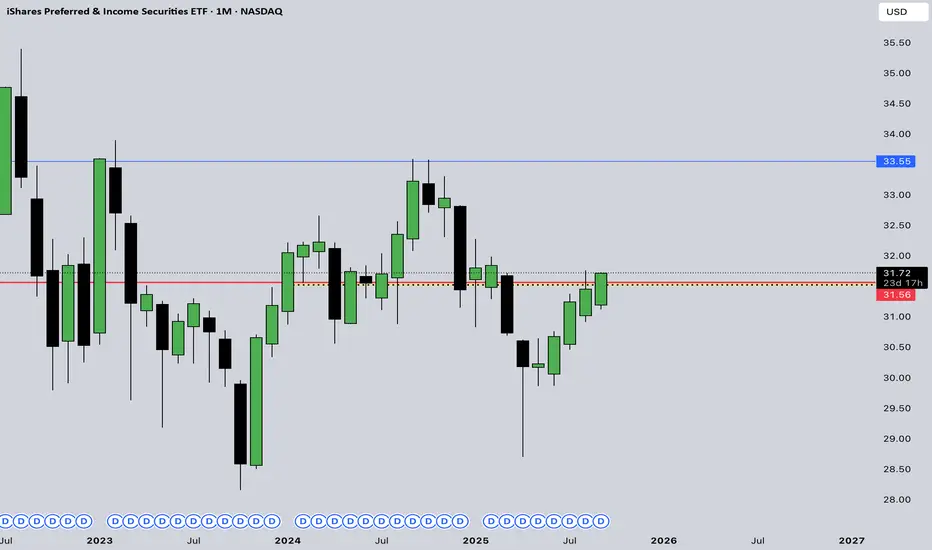
PFF buy interestI'll keep this simple, I see 31.56 as a buy point , set an alert to enter at this price and see what happens.... this is just my opinion...what ever you do is completely on you.
TLT weekly bullish engulfing amid increasing unemployment reportBullish argument:
Double monthly volume spike at approx 85$ support level
Weekly double bottom
Friday daily pump amid increasing unemployment rate report
Closed weekly bullish engulfing or bullish three line strike signaling beginning of a potential uptrend
Bearish arguments:
Bonds are known to move super slow percentage wise.
Conclusion: The weekly bullish engulfing amid unemployment rate uptick most likely signal the beginning of a bull market for bonds as central banks will react to this news by starting to lower interest rates to stimulate house purchases and manufactured goods that comes allow with owning houses which will increase job demand.
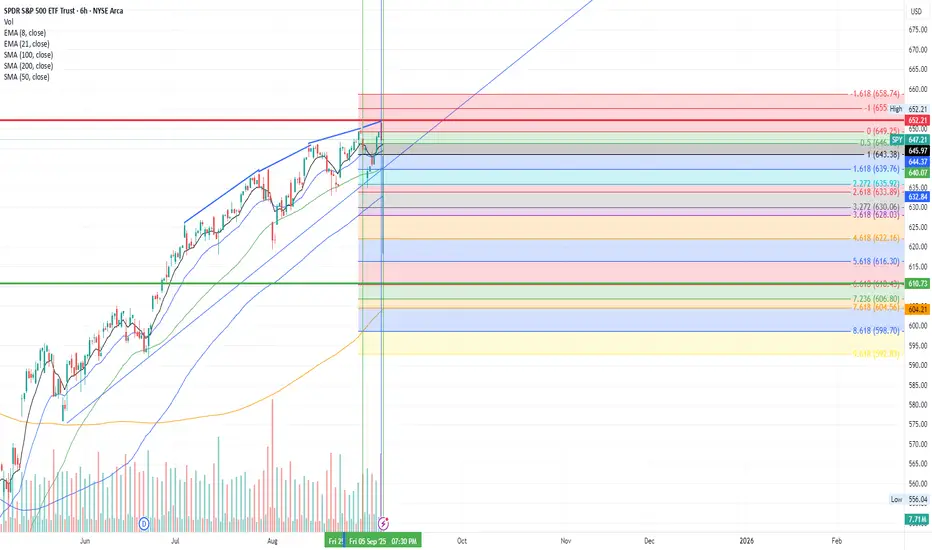
$AMEX:SPY Several Back to Back DivergenciesMany sequential divergencies on several of the higher timeframes across all 5 of the indicators i use. Theres never a "For Sure" thing in the market. But one would think these can't go unanswered for much longer. I took a PUT position on Friday after i received my buy signal.
Target 610 with a tight stop of a close above 652.21
Stay Disciplined
Plan your trade and then trade your plan
(My opinion only and Not Financial advice)
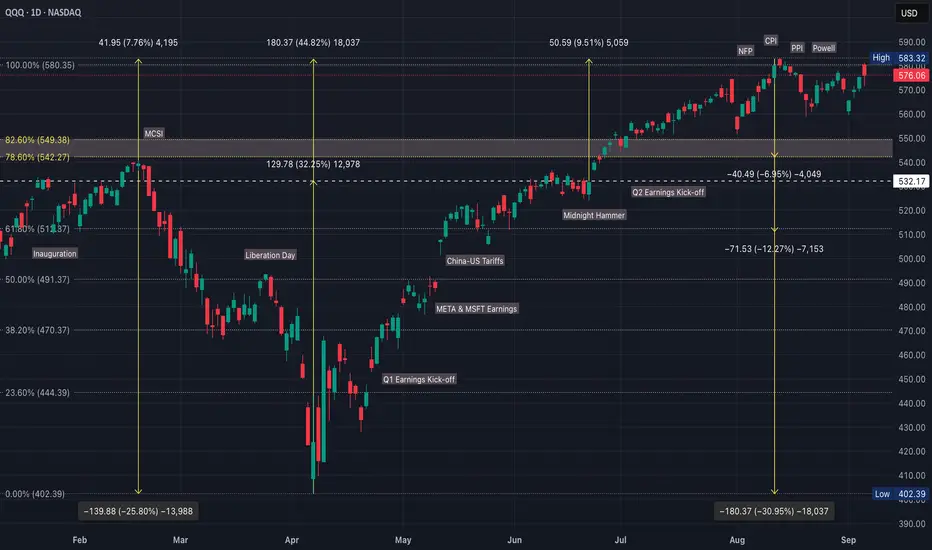
Will Bears Follow Through after Terrible Job Numbers?QQQ CME_MINI:NQ1! CME_MINI:ES1! stock market Forecast
Nvidia Stock NASDAQ:NVDA Forecast
Apple Stock AAPL Forecast
Microsoft Stock MSFT Forecast
Google Stock GOOGL Forecast
Amazon Stock AMZN Forecast
Meta Forecast Technical Analysis
Tesla Stock NASDAQ:TSLA Forecast
Magnificent 7 stocks forecast

SPY: Week of Sept 8 and Month of SeptHey everyone,
Been a minute!
I am back with an analysis for the week and month!
Hope you enjoy and safe trades as always!!

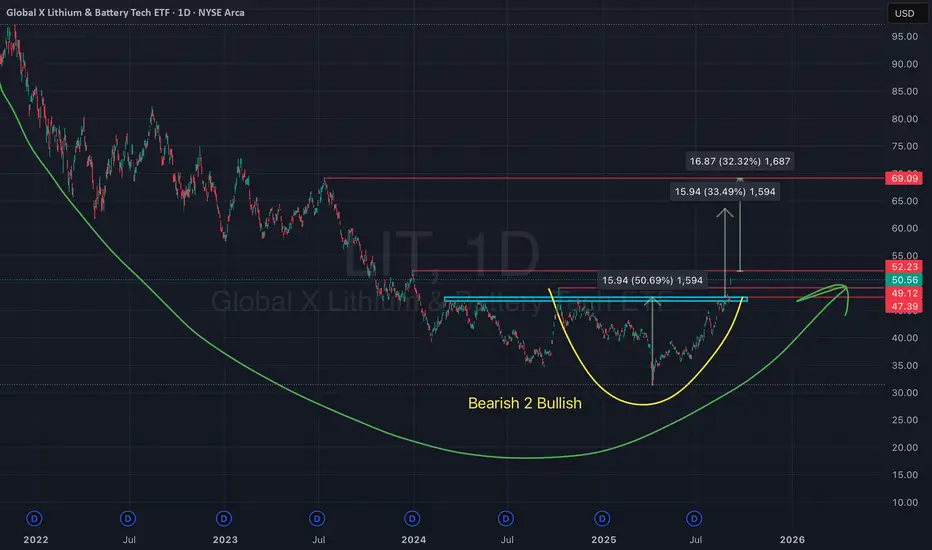
Rounded Bottom Breakout on $LIT – Global X LithiumAMEX:LIT (Global X Lithium & Battery Tech ETF) has been forming a rounded bottom, signaling a transition from bearish to bullish momentum. Price is now pressing against the critical resistance zone at $52.
A confirmed breakout above this level would validate the bullish reversal and open the path for significant upside.
• Entry point: On breakout above $52.20
• Target 1: $60.50 (+33%)
• Target 2: $69.00 (+32%)
• Stop loss: Just below $52 breakout zone (to protect against a false breakout)
This setup suggests a major shift in trend for lithium & battery tech, with momentum building for a possible new bullish cycle.
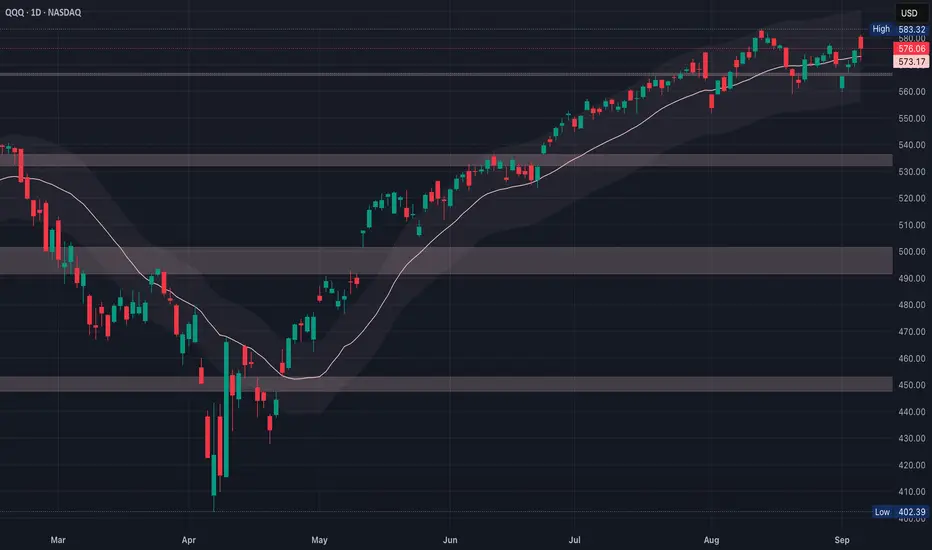
QQQ Macro + Technical for QQQMacro supports the bullish continuation case ($600–$630), unless $568 breaks & macro data worsens
Fed pivoting dovish, disinflation holding, AI-driven earnings resilience & strong liquidity
High valuations, crowded positioning & possible macro shocks (yields spiking, geopolitics)
The $568 neckline & $583 breakout line up with the macro inflection
Fed easing cycle starting is bullish fuel if neckline holds
Any surprise inflation/yield spike results in a neckline break, correction to $550
Next 2–3 Weeks
1.Bullish Breakout $583 to $600–$616 (50%)
Supported by Fed pivot + earnings resilience
2. Bearish Breakdown $568 to $550–$537 (35%)
Triggered by yields/inflation surprise or positioning unwind
3. Chop/Range ($568–$583) (15%)
Market waiting on Fed September decision
Macro + techs both say trend up until proven otherwise
$568 = line in the sand, if it breaks, macro headwinds (yields, inflation) must be the culprit
$583 breakout would be macro + technical alignment = high conviction run to $600+
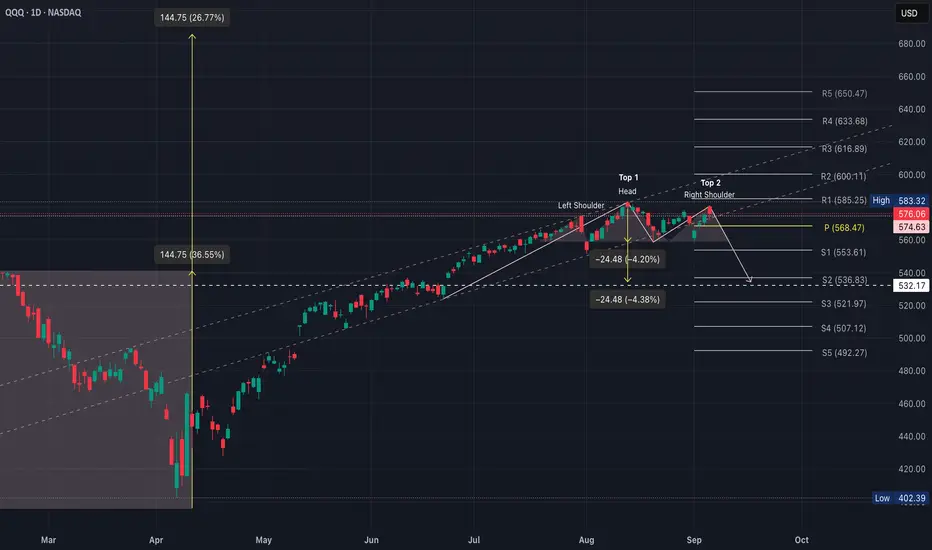
QQQ Bearish Reversal vs Bullish ContinuationQQQ broke out of a huge consolidation box (2024 into early 2025)
That breakout projected a measured move of ~144 points (26%–36%), targeting $600–$630
Price indeed advanced strongly toward that zone before stalling
1. Bearish Case (head & shoulders or double top plays out)
Breakdown below $568 with a target of $550, then maybe ~$537 (S2 pivot) if selling accelerates
That’s about a 4%–5% correction, which is normal within an uptrend
Double top is the cleaner, simpler read on this chart
Head & shoulders is more complex and requires symmetry, which isn’t perfect here
Both patterns target almost the same zone (~$550–$553), but the double top is easier to defend technically
2. Bullish Case (breakout resumes)
Hold $568, reclaim $583–$585 & push into $600 (R2)
Full measured move already points to $616–$633 longer term (R3–R4)
Probabilities (with macro context)
Continuation (push to $600–$616) @ 50%
Correction ($568 break to $550–$537) @ 40%
Extended chop ($568–$583 range) @ 10%
The breakout from that massive 2024–2025 range still dominates the chart & trend is up until $568 fails
The local Head & shoulders/double top is a warning sign, but not a confirmed reversal yet
The market is essentially asking, do we consolidate near highs before another leg up, or do we shake out to $550 first?
$SPY Trend Marked to Neutral with Possible PullbackWEEKLY RECAP:
JOLTS data came in softer than expected, signaling cooling labor demand and providing hopes for a potential Federal rate cut.
The jobs report showed signs of labor market weakness causing Treasury yields to fall. The dollar weakened in response.
Speculation about Fed easing for potential rate cuts and whether to expect a soft landing or deeper economic slowdown.
The U.S. stock market delivered mixed results.
S&P 500 slightly edged up approximately 0.3% from last week.
Nasdaq edge up approximately 1.1% with strength in tech.
The Dow slipped approximately 0.5%
On Friday AMEX:SPY , NASDAQ:NDAQ , AMEX:DIA had opened up followed by some heavy selling.
The market tried to really towards the end of Friday.
My view is that there is investor uncertainty
S&P 500 TECHNICAL ANALYSIS:
Despite AMEX:SPY edging up for the week, investor uncertainty remains with Friday closing on a wide range red candle and above average volume.
The Friday candle formed a Dark Cloud Cover (DCC) on the Daily chart. Note that some technicians require the candle to push more than 50% into the body. While Friday's candle had a wide red body on above average volume, it only thrusted into the body of Thursday's candle by around 40%. Discretion is required. Everything is open for interpretation. There are no hard rules, except for good risk management, and knowing when to trade, and when not to trade.
The Dark Cloud Cover candle strategy is said to have approximately a 60% win rate as per wrtrading data, depending on confirmation and market context.
The Bears won on Friday but the Bulls put up a fight rallying into the close and forming a lower shadow. This is a strictly a personal view, but a lower shadow has much more significance near the bottom of a trend, rather than near the top. Had the rally been stronger a Hanging Man candle would have been formed, which is another candle considered to be bearish.
Make no mistake, whether bullish or bearish, the bears are present.
For the type of trader I am, I have the trend is marked as Neutral until support is broken. There still is considerable support.
Some technicians may see the lower shadow and say Bulls are present, while others will look at it and say it's simply short sellers covering their positions to take profit.
September has historically been the 2nd worst month of the year, for a 10-year lookback. For these reasons my bias is leaning towards a deeper pullback, which would be a nice Bull setup for a Santa rally for the stronger months of October, November, and December.
For these reasons I would expect some volatility next week, but have the trend marked as Neutral until further confirmation, but with a Bearish bias for a pullback.
This doesn't mean I think we're heading for a Bear market. It merely means the market moves up & down in waves and I'm leaning towards a pullback.
A question you should ask yourself: If I'm an investor and looking at AMEX:SPY , do I want to buy up here?
FORECAST
I would expect continued volatility as markets weigh the likelihood of a Fed rate cut amid cooling inflation and labor softness. Historically one of the weakest months for equities, September may still offer opportunities—especially in small-cap and value stocks, which remain undervalued and have recently shown signs of strength. Sectors like healthcare, communications, and real estate are also expected to outperform as investors rotate away from overextended tech names.
DISCLOSURE
All information shared is entirely hypothetical and open to interpretation. One analyst may view the market through a particular lens, while another may see it differently—based on unique strategies, trade durations, entry/exit points, and sources. In other words, context matters. Past performance does not guarantee future results. Trading always involves risk, so please do your own research and form your own opinions. What works for Trader A might not work for Trader B.
Happy Trading!
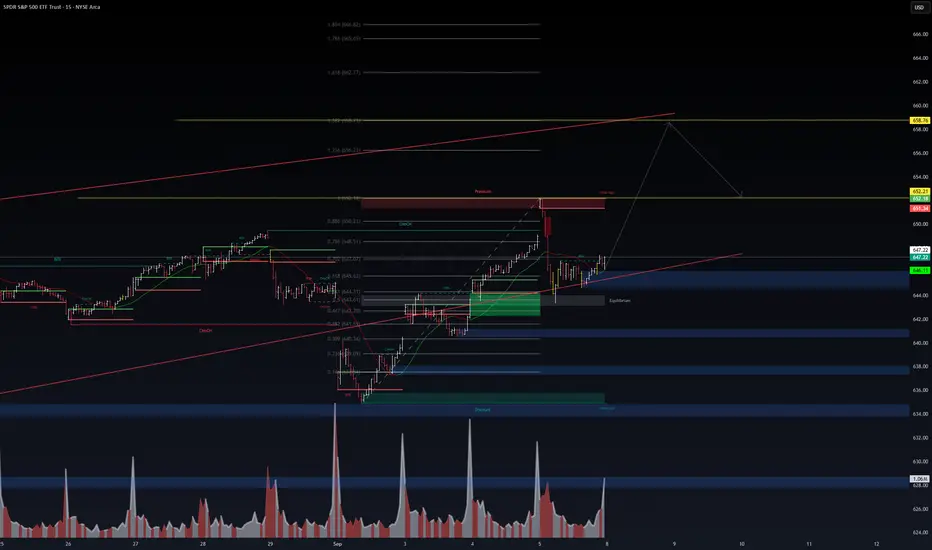
WaverVanir Market Intelligence – SPY Outlook🛰️ WaverVanir Market Intelligence – SPY Outlook
Catalyst:
September rotation into risk assets ahead of CPI/Fed cycle.
Strong liquidity injections in last sessions visible in volume profile.
Market seeking liquidity above prior highs (651–653) before establishing next trend leg.
Analysis (15m–1h Structure):
Current price: 647.2 (holding above equilibrium ~646).
Liquidity Pool Above: 651–653 (void high, premium zone).
Liquidity Pool Below: 644 → 636 (discount demand zones).
Fibonacci Map:
Retracements: 648.5 (0.786) → 650.2 (0.886).
Extensions: 658 (1.272) → 662 (1.618).
Market Mechanics:
Break of structure (BOS) confirmed, retest at equilibrium.
Volume spikes indicate institutional positioning.
Thin liquidity at 646–648 → easy to sweep higher.
Probabilities (WaverVanir DSS Projection):
📈 Bullish Path (60%): Price targets 651–653 liquidity sweep, extension to 658–662 if absorption holds.
📉 Bearish Path (30%): Failure to hold 646 → drawdown into 644 equilibrium → deeper sweep at 636–632.
⚖️ Neutral Chop (10%): Sideways between 646–650 before CPI/Fed clarity.
Strategic Note:
While SPY remains above 646 equilibrium, probability favors a liquidity grab to 653 and possible extension to 658+. A breakdown below 646 flips bias into deeper demand hunts.
🔮 WaverVanir Protocol View:
Capital flow remains tilted bullish into liquidity, but with strong volatility clusters — risk-managed entries around equilibrium (646–647) give best R:R.
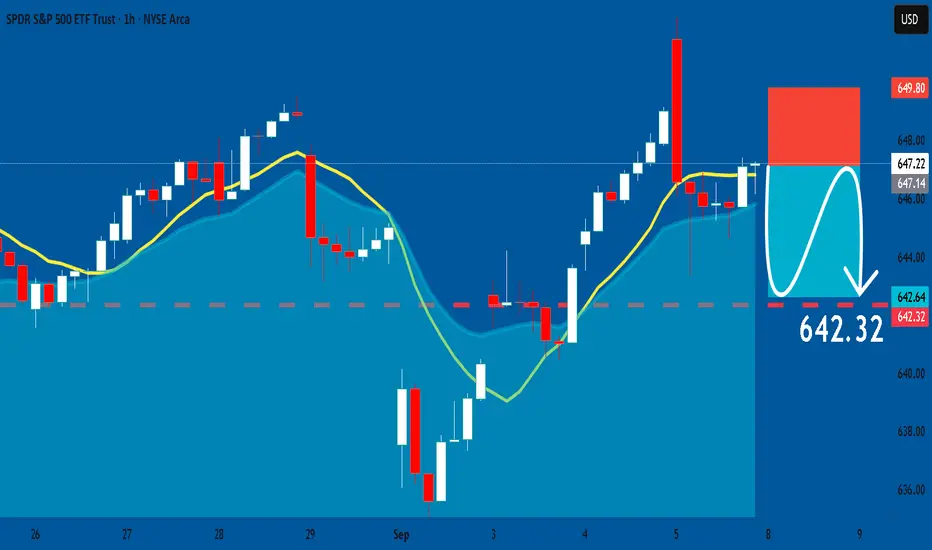
SPY: Short Trade with Entry/SL/TP
SPY
- Classic bearish pattern
- Our team expects retracement
SUGGESTED TRADE:
Swing Trade
Sell SPY
Entry - 647.14
Stop - 649.80
Take - 642.32
Our Risk - 1%
Start protection of your profits from lower levels
Disclosure: I am part of Trade Nation's Influencer program and receive a monthly fee for using their TradingView charts in my analysis.
❤️ Please, support our work with like & comment! ❤️
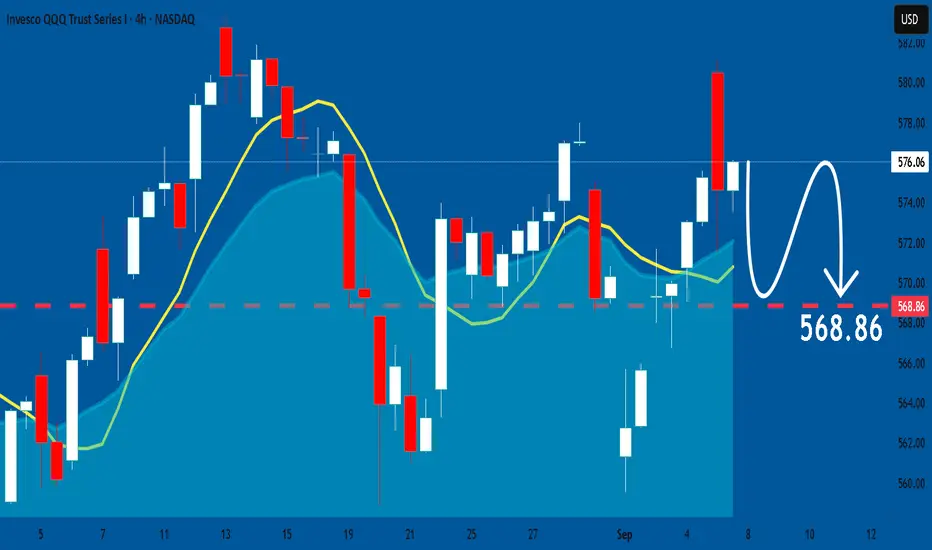
QQQ: Bearish Forecast & Outlook
Our strategy, polished by years of trial and error has helped us identify what seems to be a great trading opportunity and we are here to share it with you as the time is ripe for us to sell QQQ.
Disclosure: I am part of Trade Nation's Influencer program and receive a monthly fee for using their TradingView charts in my analysis.
❤️ Please, support our work with like & comment! ❤️
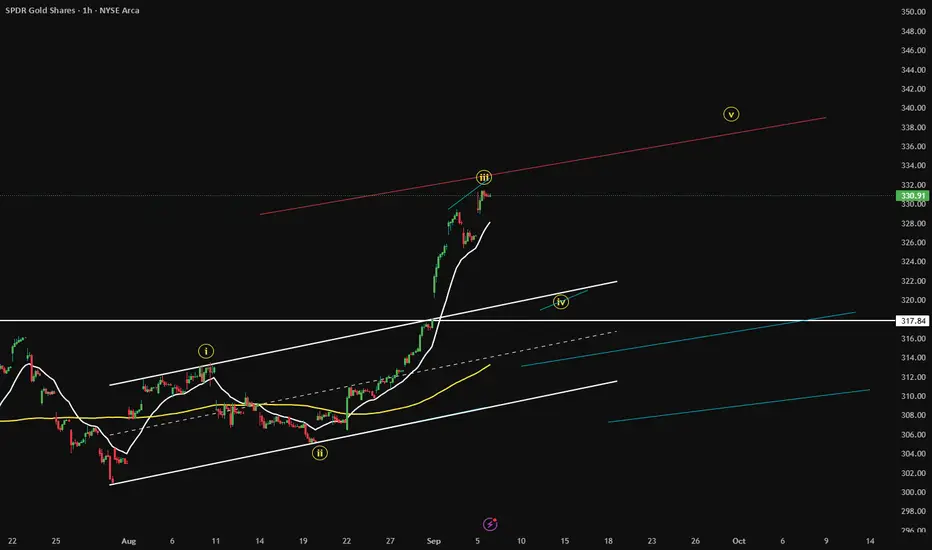
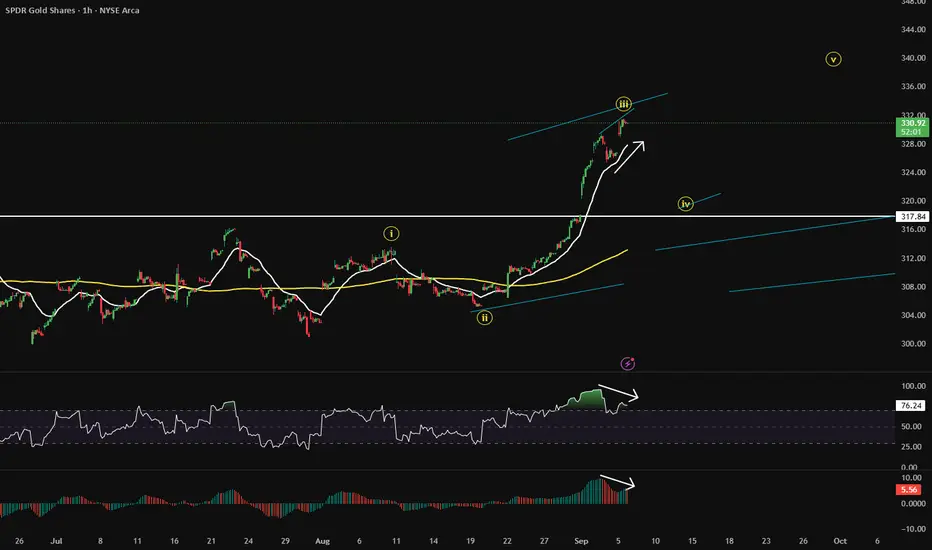
GLD wave 4 target 318-320 waves are why RN Elliott predicted a 71+ bulll run in 1941, GLD will in fact go higher but like a long distance runner price has to rest and that's what the wave 4 pull back is all about, than we march higher in wave 5
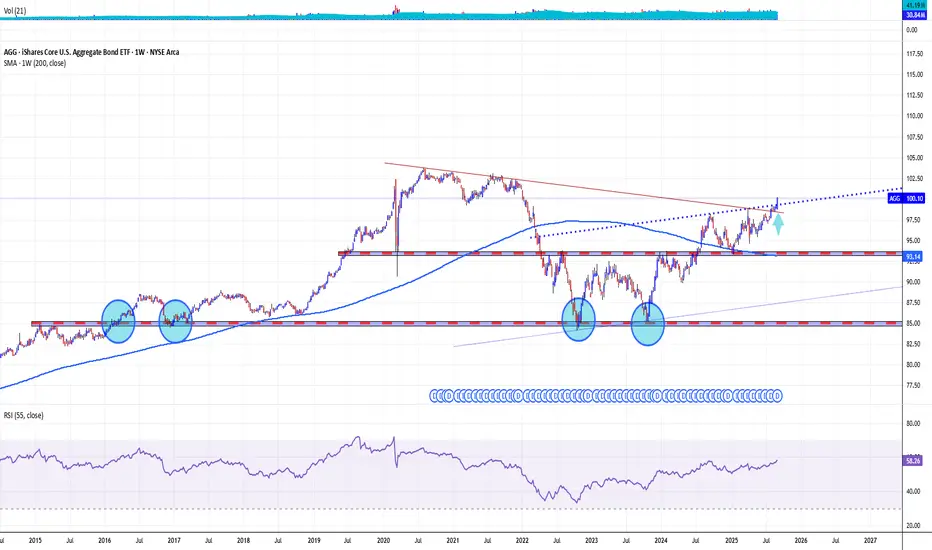
AGG BOND MARKET ETF GOES 'ONE HUNDRED DEGREE' FEVER THRESHOLDThe iShares Core U.S. Aggregate Bond ETF (AGG) is a broad-based U.S. bond market ETF that provides exposure to investment-grade government and corporate bonds. Examining AGG from technical and fundamental perspectives, especially with anticipated Federal Reserve rate cuts in late 2025, highlights several key insights for investors.
Technical Perspective
Recent technical analyses of AGG presented a mixed picture:
Until now, some indicators, like the short-term exponential and simple moving averages (EMAs/SMA), have signaled Buy positions. However, the long-term 200-week moving averages is generally under current prices, highliting medium-to-long-term support and generating 'Buy' signals.
Over the past several weeks, technical sentiment overall was characterized as neutral to cautious, with short bursts of bullish momentum but persistent underlying resistance.
Upcoming Interest Rate cut event is largely reflecting broader market uncertainty about the timing and magnitude of rate cuts, while AGG jumped above $100 per share in solid manner.
Fundamental Perspective
Fundamentally, AGG's outlook is heavily tied to macroeconomic factors:
With “sticky” inflation and persistent fiscal imbalances, as well as slowing U.S. economic momentum, fixed income portfolios have become more focused on income and carry rather than price appreciation.
The “belly” of the yield curve (3-7 year maturities), which makes up a significant portion of AGG, is preferred by asset managers. This segment provides attractive all-in yield while limiting duration risk, especially valuable if rate normalization is gradual.
Investment-grade credit within AGG is seen as reasonably robust, particularly in BBB-rated bonds, although tight credit spreads limit further upside from spread compression. Income generation remains the primary draw in this environment.
Recent year-to-date returns for the U.S. Aggregate Bond Total Return Index have been moderately positive (nearly 6% in 2025), supported by economic resilience and declining inflation.
Impact of Expected Rate Cuts
Anticipated rate cuts by the Federal Reserve—potentially beginning as soon as September 2025—carry substantial implications:
Lower policy rates typically push up bond prices and benefit bond ETFs like AGG directly. Yet, in 2025, bond ETF prices have sometimes initially dropped even after rate cut announcements, reflecting complex market dynamics and residual uncertainty.
As cash yields fall, the relative attractiveness of holding diversified bond funds improves, especially for those seeking steady income with less volatility than equities. The risk/return profile for AGG should strengthen as the Fed moves into an easing cycle, with the possibility for modest price appreciation and improved total returns.
However, forward-looking market positioning, tight spreads, and gradual adjustments may dampen immediate “windfall” gains—even as the overall environment turns incrementally more favorable for intermediate-term bond allocations.
In summary, AGG offers a balanced, income-oriented fixed income allocation that stands to benefit cautiously from the forthcoming rate-cutting cycle, with technical and fundamental perspectives both supporting a measured, rather than aggressive, overweight in the coming months.
The main technical graph for AMEX:AGG ('Total Return' mode) indicates on growth' accelerating, since 'one hundred' fever threshold has been successfully passed.
QQQ (5 September)The slope of the lines matters for pattern bias
Sloping slightly down from $583 to $580
Holding flat around $563–$565
That shape is actually closer to a descending triangle
Bearish continuation if support breaks
But here’s the nuance,
Descending triangles typically form after a downtrend, as continuation
QQQ is in a strong uptrend, so even if the geometry looks bearish, context says bulls still have an edge
In uptrends, these patterns can fail bearishly & instead resolve higher, especially if support keeps holding
So the pattern could be read 2 ways,
Descending triangle with support at $563 breaks = $545–$550
A coiling consolidation under resistance, which still may resolve upward given the broader trend
The key difference will be whether $563 breaks down or holds
Bearish breakdown (descending triangle plays out) at 35% because the macro trend is up since April & bulls usually defend support zones first, but if $563 breaks with volume, bears gain momentum quickly
Bullish breakout (uptrend prevails) at 50% because of the broader uptrend + strong dip buying since April
Each rejection at $580 has been shallow, showing underlying demand
Price keeps oscillating between $563–$580 for another week at 15% in the short run, but if it drags on too long, the eventual breakout becomes stronger
GLD wave 4 target 318-320 typical momentum divergence between waves 4 and 5 (lower degree right now), wave 4 (higher degree) target 318-320
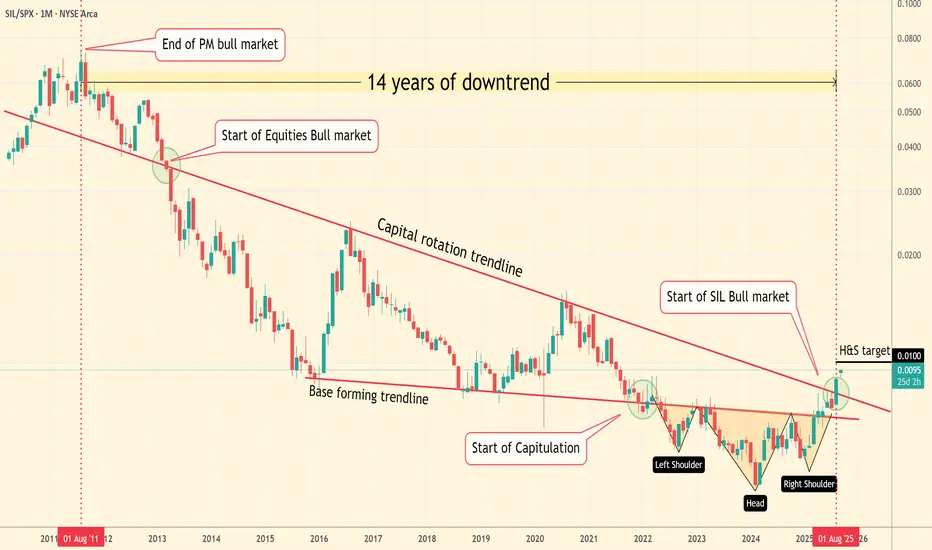
Why Silver Miners Are Poised for a Historic Breakout...After 14 long years of being left in the dust by the S&P 500, the silver mining sector is finally signaling that its time has come. The chart of the SIL/SPX ratio tells a powerful story, suggesting we're on the brink of a massive capital rotation.
The Technical Evidence Is Clear
The long-term downtrend, which has defined this ratio for well over a decade, is officially over. Following the completion of a classic Inverse Head and Shoulders pattern, the ratio has now logged a decisive monthly close above its crucial "Capital Rotation Trendline." This isn't just a minor blip; it's a major technical breakout that signals a fundamental shift in market sentiment.
The Fundamental Logic Is Unstoppable
For years, capital has overwhelmingly funneled into technology and the broader S&P 500. Now, as those sectors look increasingly overvalued, the money has to go somewhere. The asymmetry here is staggering: the sheer difference in market capitalization means that even a small percentage of funds rotating out of tech and into silver miners could trigger an explosive price move in the silver mining sector.
Physical Silver Is Providing the Catalyst
This breakout isn't happening in isolation. It's being confirmed by the price of physical silver itself, which is pushing past key resistance levels at $40 and has its sights set on $50. This move provides the perfect fuel for the miners, as higher silver prices dramatically increase their profit margins and overall value.
The situation is clear: the smart money is likely already moving. The question is, are you ready to join them?