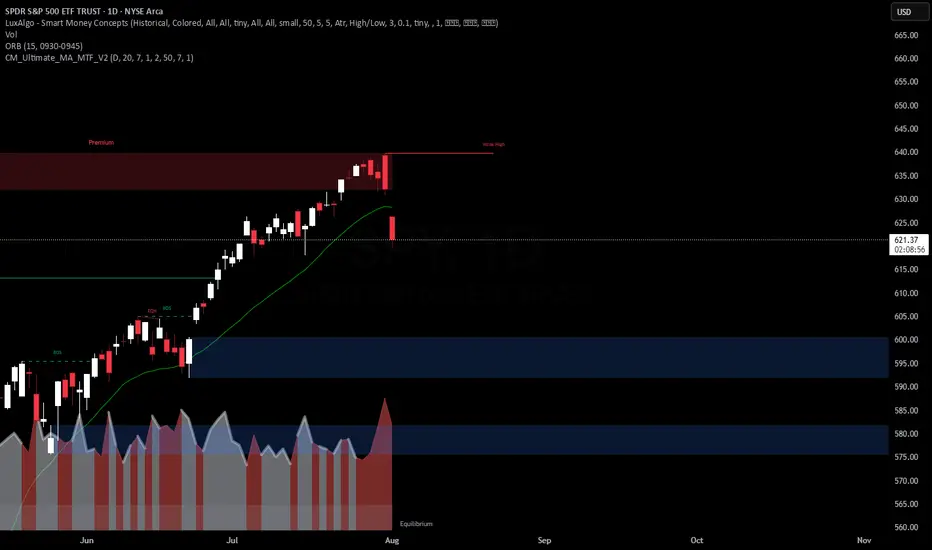
SPY: I think dollar milkshake is brewing, buying for long term📉 SPY Daily Breakdown – Aug 1, 2025 | VolanX Observations
🧠 Bot failed today, but the market taught more than any trade could have. Sitting out gave me the clarity to reassess structure and edge.
🔍 Market Structure Update:
Gap Down from Premium Zone: Today’s price action rejected the weak high and created a clean daily gap — signaling potential distribution at the top.
ORB (15-min) marked and ready: Likely to be retested on Monday. If price rallies into this zone and rejects, that’s where I’ll look for short entries.
Friday Bearish Close Rule: Statistically, when Friday closes red with strong momentum, Monday tends to follow — especially after a gap-down open.
🧭 Big Picture Outlook:
Liquidity Zones Below:
600 → First institutional reaction zone.
580 → Deeper demand and equilibrium area from previous consolidation.
Dollar Milkshake Brewing: Strong USD thesis could pressure equities short-term. This aligns with potential flow into defensives and out of high beta.
Long-Term Bias: Watching for deep discounts. If price moves into high-value demand zones, I’ll accumulate for the long haul — buying fear when it's priced in.
📌 What I’m Watching Next Week:
Monday open – will we see Gap & Go or a Gap Fill + Fade?
Reaction to ORB zone.
Volatility behavior and volume footprint in the first 90 minutes.
🔻 No trades today due to a bot error, but ironically, that gave me better vision. Sometimes, the best trades are the ones you don’t take.
VolanX Protocol engaged. Standing by.
ETF market
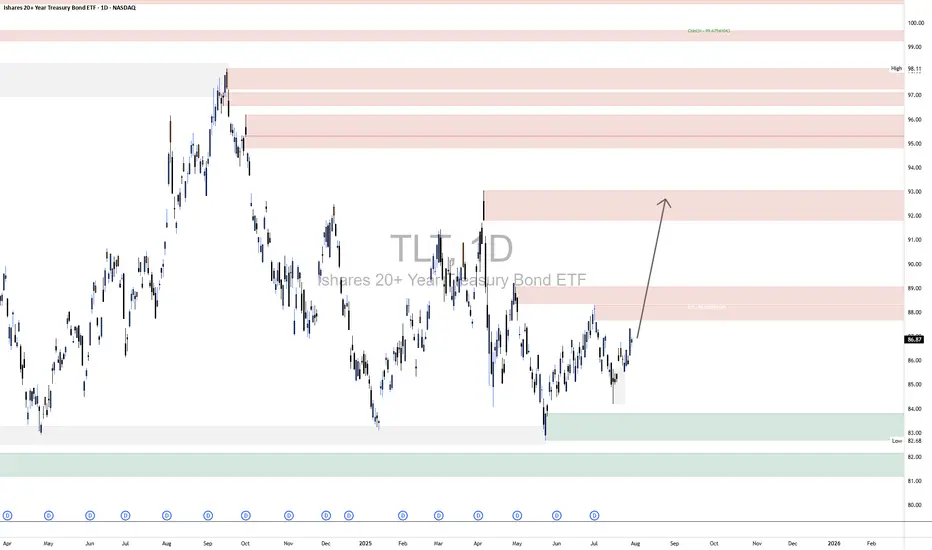
Rates Coming Down?TLT could be a great trade here. I'm seeing signs that the low could be in. The RSI is coiling up and piercing the downtrend. We are also climbing above the 21 Week Moving average, which is has been firm resistance since the rate hiking cycle.
Bond yields are tanking, employment is weakening, pressure is building on rate cuts from the highest level. TLT could be a beneficiary.
Not financial advice, do what's best for you.

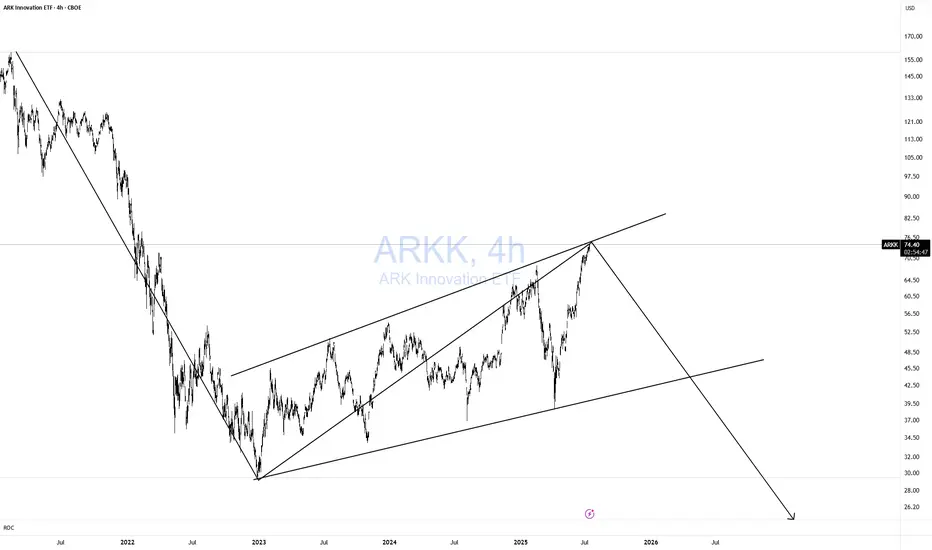
ARKK DOOMED!Classic 123 wave move down! As I like to say Short when no one else is looking! Not when everyone is looking. TOO LATE!
Simple but very effective pattern with excellent risk-reward. Remember, I am a macro trader, so don't expect to see a return on this investment tomorrow.
I won't get into the macro stuff.
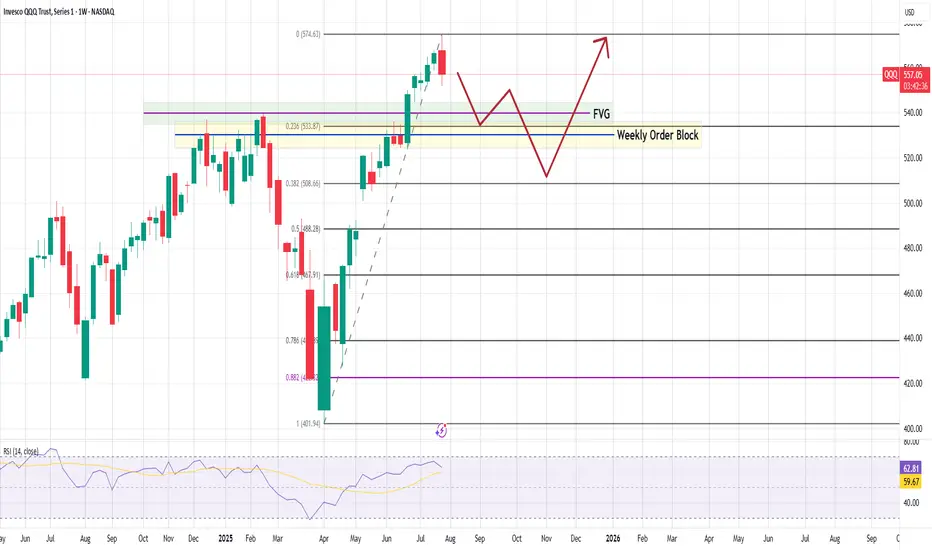
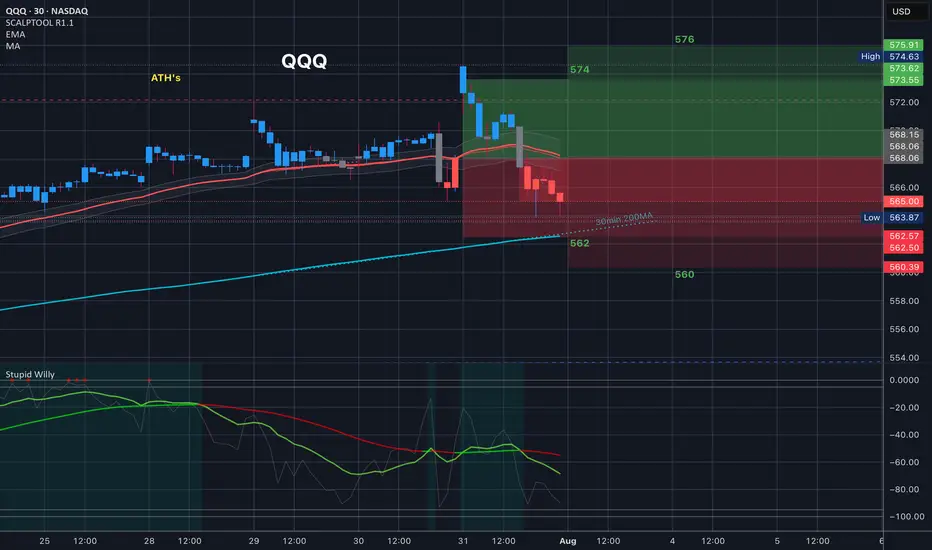
#QQQ Weekly Chart – Technical Breakdown As of August 1, 2025QQQ Weekly Chart – Technical Breakdown
🧠 Key Observations
Bearish Weekly Rejection
A red candle at the recent high ($574.63) suggests buyers are taking profits.
Short-term reversal likely in play.
First Reaction Zone:
0.236 Fib at $533.87 is the first potential bounce zone.
Aligned with:
Fair Value Gap (FVG)
Upper range of the Weekly Order Block (OB)
Deeper Demand Zone:
If $533 fails, the Weekly Order Block becomes critical.
That zone stretches down toward $520–$508 (Fib 0.382).
Strong historical reaction area — may attract long setups if macro aligns.
RSI Divergence Risk:
RSI shows some signs of flattening.
Still above 59, so momentum is intact — but weakening.
📉 Pullback Path (Base Scenario):
Potential move to $533 → $520, consolidating inside the order block
From there, bullish continuation back toward $575+
Invalidated below $500, where structure breaks
📈 Mid-Term Bullish Bias Intact
Strong uptrend, higher lows still in place
Any dip into the OB + FVG zone = buy-the-dip opportunity.
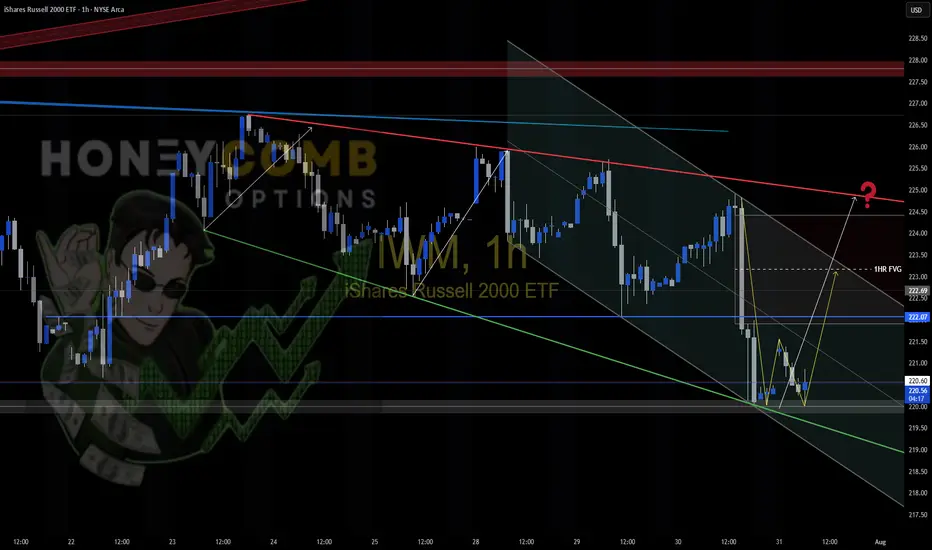
Quantum's Missed IWM Short 8/1/25Well had a moment where I backed out of a A+++ setup. IWM had a ton of -gex pull down to 206. Would have been a massive short to end the week. I canceled my order instantly for no reason at all and missed it. Overall had a great day but this is what separates the elite from the average trader. Will work on this next week.

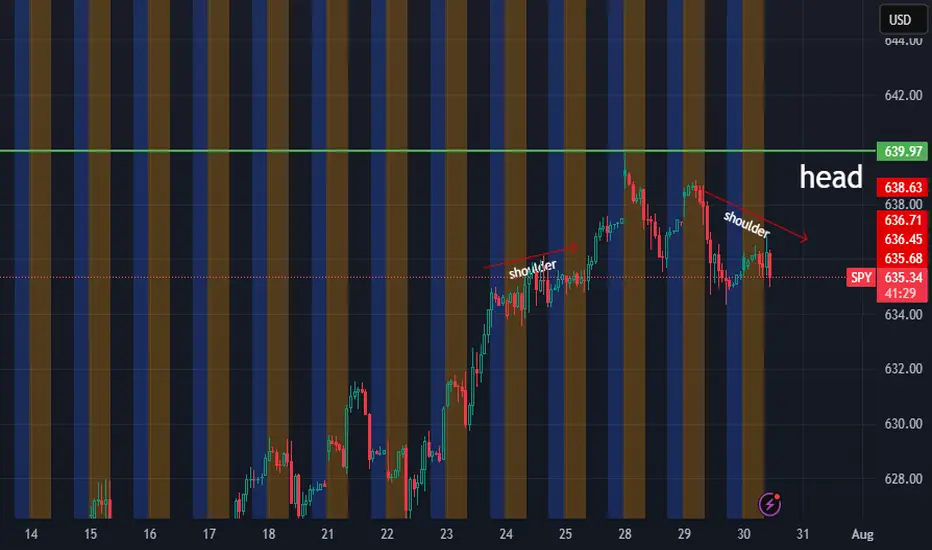
short IdeaLooking at the hourly chart, and I am noticing a head and shoulders build up.
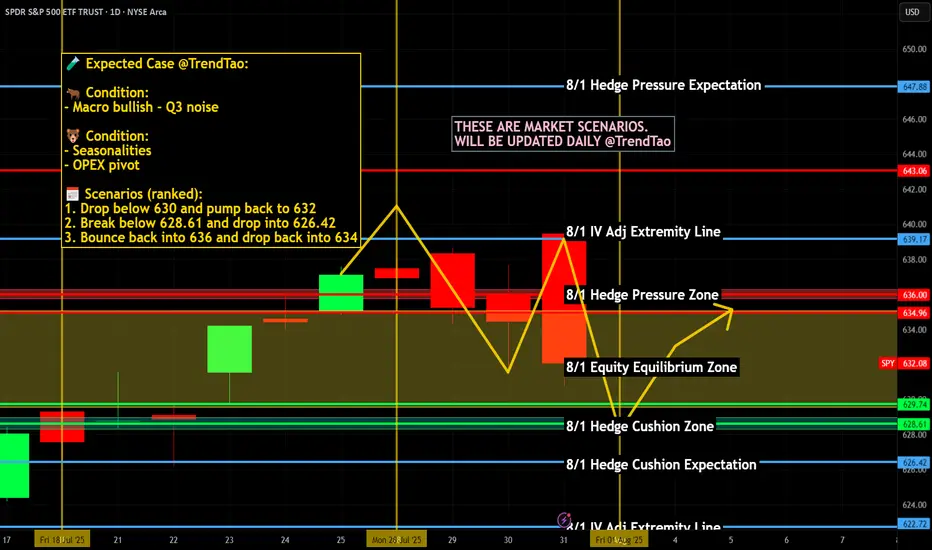
day trade idea: 635 entry 637 stop 630 profit target
swing trade idea: short above 630 long below
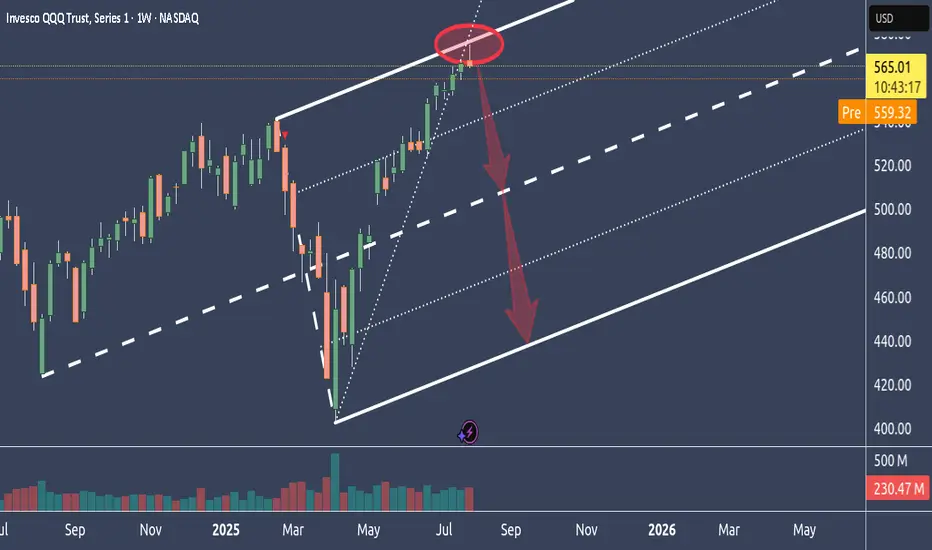
Why NQ is probably tanking big timeIn this weekly chart, we see QQQ, which represents the Nasdaq.
As we can see, it had a hell of a run up.
Too far too fast IMO, and it reached the stretch level at the Upper Medianline Parallel.
The natural move is now to let go, take a breath and trade down to center again, which is the Centerline.
After all the most major and most important earnings results are over, and Funds have pumped up their gains through manipulative Options plays, it's time to reap what they have planted and book the gains.
It's all in line with, all moves are at the point, and everything is showing in a simple chart.
Unless price is opening and closing outside of the U-MLH, it's time to load the Boat and sail to the South.
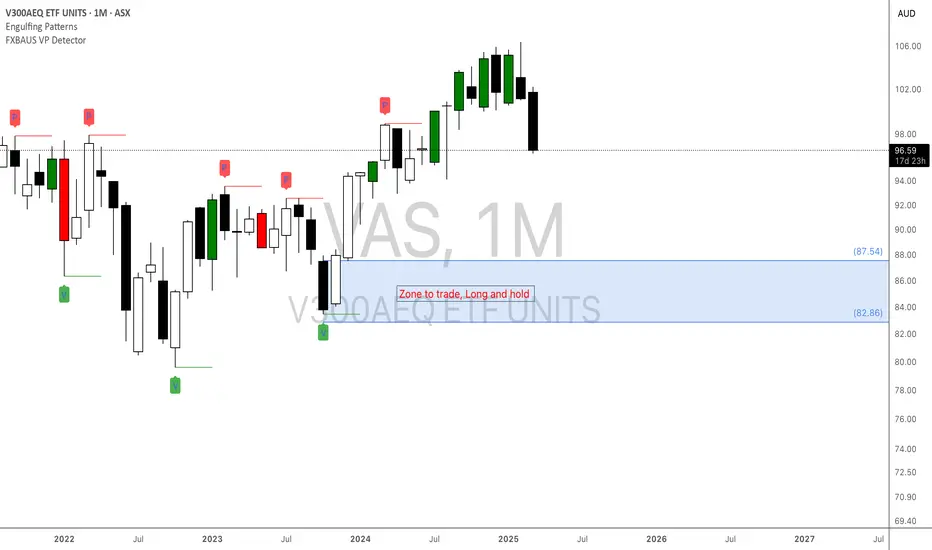
Vanguard Australian Shares Index ETF (VAS) Vanguard Australian Shares Index ETF (VAS)
EFT Info :
Vanguard Australian Shares Index ETF (VAS) is an investment fund traded on the Australian stock exchange that allows investors to buy shares in approximately 300 of Australia's largest companies with a single purchase.
Chart Analysis
The Monthly zone is promising, entry is at 87.54 however thats the lowest timeframe i could use here.
Conc:
1.As this is monthly timeframe movement is in months and hence the long wait.
2. The zone is risky and would require a confirmation kind of trade to get into
Prop:
The Vanguard is well established and an entry would not require a target as its a wait and hold
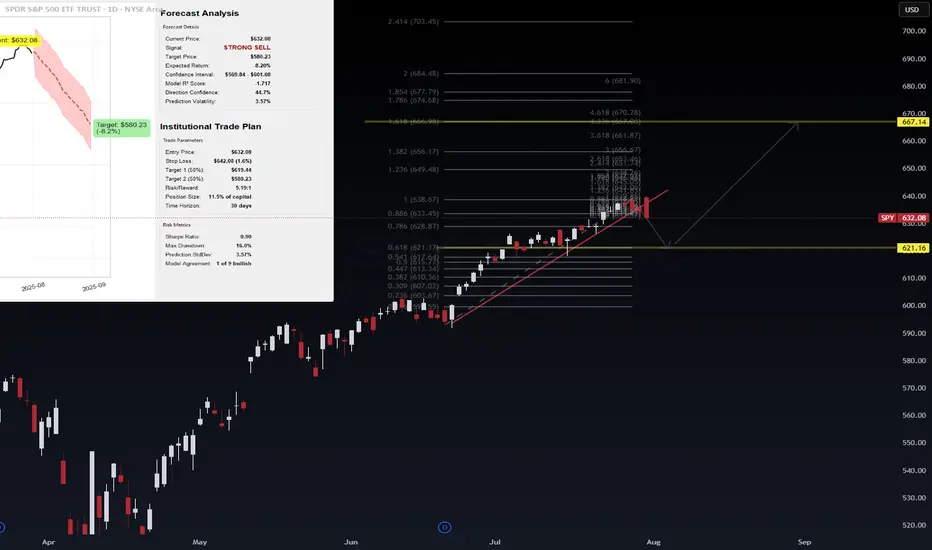
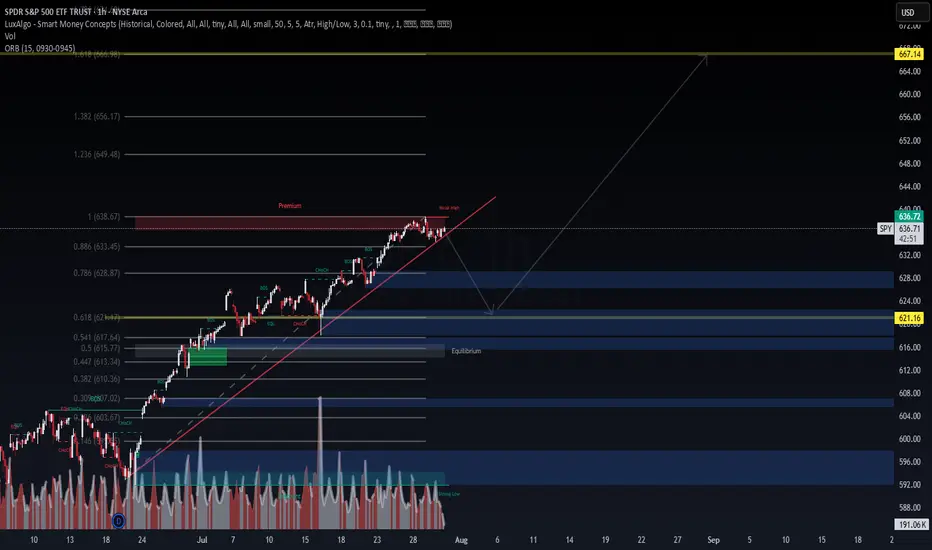
S&P 500 Futures – Trendline Breach + AI Forecast Signals Major C📉 S&P 500 Futures – Trendline Breach + AI Forecast Signals Major Correction
VolanX Risk Engine Flags High Probability Downside
🧠 Narrative:
Markets have enjoyed a powerful uptrend off the March lows, but the structure is showing signs of exhaustion.
The ascending trendline—untouched for over two months—has now been breached.
Fibonacci levels cluster below current price, with critical demand at:
6319.25 (immediate test zone)
6179.25 (0.618 retrace)
5964.75 (macro support / VolanX institutional target)
Meanwhile, VolanX Protocol's predictive engine has shifted to a "Strong Sell" with a projected correction path clearly outlined. The 30-day price forecast (shown in red) leans toward a mean reversion toward 5842.12 by late August.
📊 Institutional Trade Plan (VolanX DSS):
Entry Zone: 6360-6380 (Confirmed breakdown retest)
Target 1: 6179.25
Target 2: 5964.75
Final Target: 5842.12
Invalidation: Close above 6480 (new highs with strength)
🔎 Risk/Reward: 3.4+
📈 Trend Deviation: 7.4%
📉 Bearish Conviction: 84.1%
📌 Key Insights:
Breakdown below trendline confirms shift in control to bears
Institutional models anticipate volatility-led selloff
Major liquidity rests below 6200 and 5960 zones
This is not the time to chase highs—risk is asymmetric
🔮 VolanX Opinion:
“Volatility expansion is near. Institutional capital is likely rotating out of risk. The squeeze has passed; now the trapdoor may open.”
This is where preparation outperforms prediction. Execute with risk logic, not emotion.
📚 #SNP500 #ESFutures #SPX #MacroTrading #SmartMoney #InstitutionalFlow #TrendReversal #Volatility #LiquiditySweep #FibonacciLevels #VolanX #AITrading #EminiFutures #WaverVanir #QuantStrategy #TechnicalAnalysis #Forecast #TradingView
$QQQ Analysis, Key Levels & Targets574/576 Bear call spreads at open? Yes please. You know that those filled for 1.00 risk/1.00 reward - it was glorious.
Closed up 100%
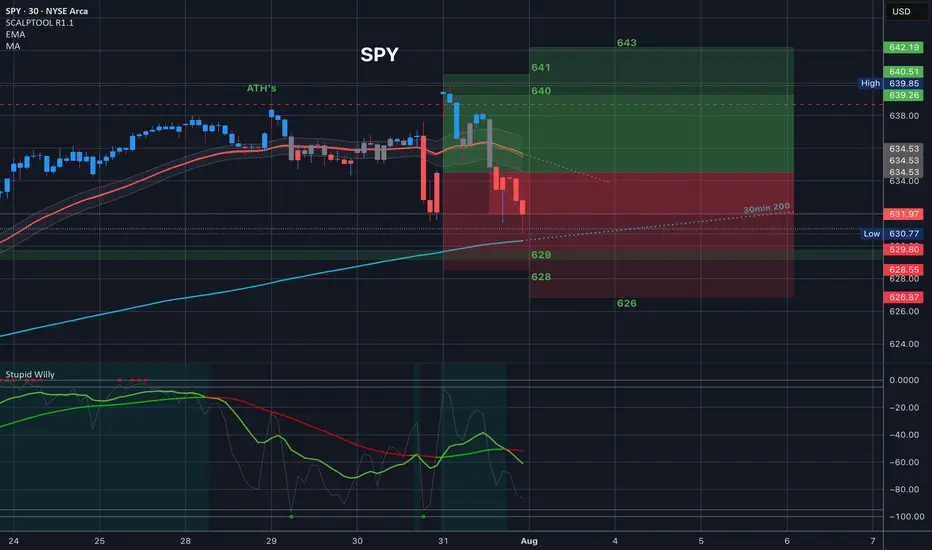
$SPY Analysis, Key Levels & Targets
This is how last night’s members chart played out and it was amazing. We opened at the top of the trading range and all of the spreads at the top paid as we dropped back to the 30in 200MA
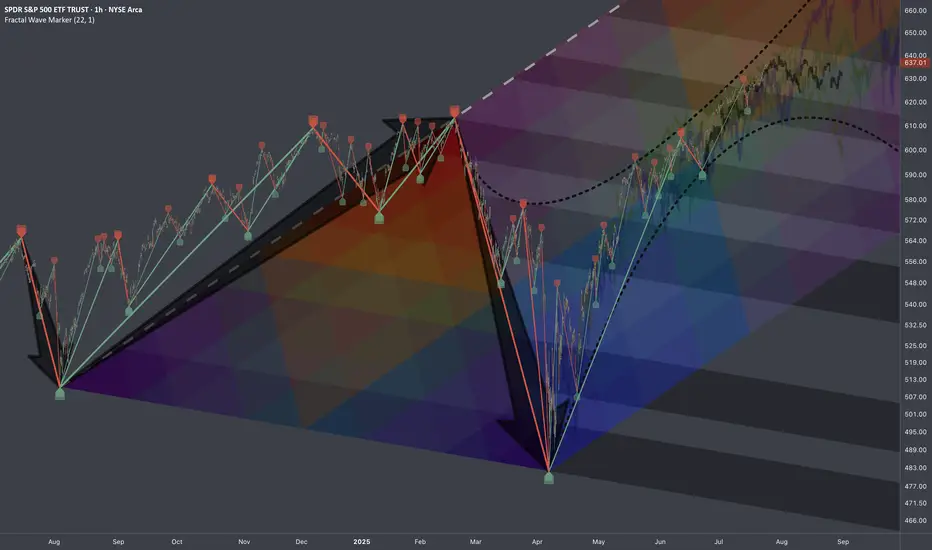
$SPY: Mapping Scenarios🏛️ Research Notes
Fractal Corridors
Shows recursive formations which indicates a full fractal cycle.
The angles of decline are parallel which is important for potential buildup.
To map a cycle we'd need to apply fib channel to the opposite direction In a way this should be sufficient to cover the scenarios of nearest future if we were to use bar patterns to validate a structure.
These are examples of historic progressions with similar growth patterns (composite sub-cycles):
This explains most elements present in interactive chart.
$UVXY Signaling Trouble — $SPY Could Drop 10%+ In this video, I discuss why August/September could bring serious downside for the market, despite my long-term bullish stance.
Right now, SPY is trading around $632, but I have a downside target of $573 in the short term. If we get volume beneath $573 — especially a break below the daily EMA — SPY could drop quickly, with a potential fall all the way to $480 in the coming weeks/months.
At the same time, UVXY is signaling a correction for the overall market after rallying from the low's of April. I have a target of $30 and when UVXY starts to move, it often reflects sharp market corrections — and the setup is beginning to mirror that now.
Despite this short-term bearish outlook, I want to make it clear: I am very bullish long term. Any 10–20% correction will be a major buying opportunity for me. I'm watching key levels closely and preparing to take advantage when the market overreacts.

Nightly $SPY / $SPX Scenarios for August 1, 2025🔮 Nightly AMEX:SPY / SP:SPX Scenarios for August 1, 2025 🔮
🌍 Market-Moving News 🌍
📦 U.S. Imposes New Tariffs as Deadline Passes
Fresh tariffs rolled out on August 1 hitting major exporters: 25% on Indian goods, 20% on Taiwan, 19% on Thailand, and 15% on South Korea. Canadas tariff elevated to 35%, though Mexico got extra negotiation time. Global equity markets slipped modestly, led by declines in Asia-Pacific regions. AMEX:SPY futures also eased on mounting geopolitical and trade pressures.
🏦 Fed Uncertainty Mounts Despite Calm GDP
Despite robust Q2 GDP growth and a hold on interest rates this week, Fed Chair Jerome Powell faced growing unrest. Comments acknowledged downside labor risk amid trade uncertainty—investors are now assigning just a 39% chance of a rate cut in September.
📊 Key Data Releases & Events 📊
📅 Friday, August 1:
8:30 AM ET – Nonfarm Payrolls (July):
Payrolls rose by 106,000, less than June’s 147,000 but still positive. Wage growth slowed, easing inflation concerns slightly.
8:30 AM ET – Unemployment Rate:
Unemployment ticked up to 4.2%, from 4.1% in June—reflecting modest labor softness.
8:30 AM ET – Average Hourly Earnings (MoM):
Wages rose +0.2%, down from +0.4% in June, signaling wage pressure easing.
⚠️ Disclaimer:
This information is provided for educational and informational purposes only and should not be construed as financial advice. Always consult a licensed financial advisor before making investment decisions.
📌 #trading #stockmarket #economy #jobs #Fed #tariffs #inflation #technicalanalysis
THE STOCK MARKET IS BULLISH BUT NEEDS A SMALL CORRECTIONIn this video, we look at the weekly chart of the S&P 500 to determine if a correction is near and spoiler alert. Yes, it is. Here's what happens.

$PSIL Head and shoulders or bull flag? Potential Daily Head and Shoulders, But Also Weekly Bullflag. Here are the levels that matter to me.
Support: 16.36, 16.18
Resistance: 17.01, 17.15, 17.41

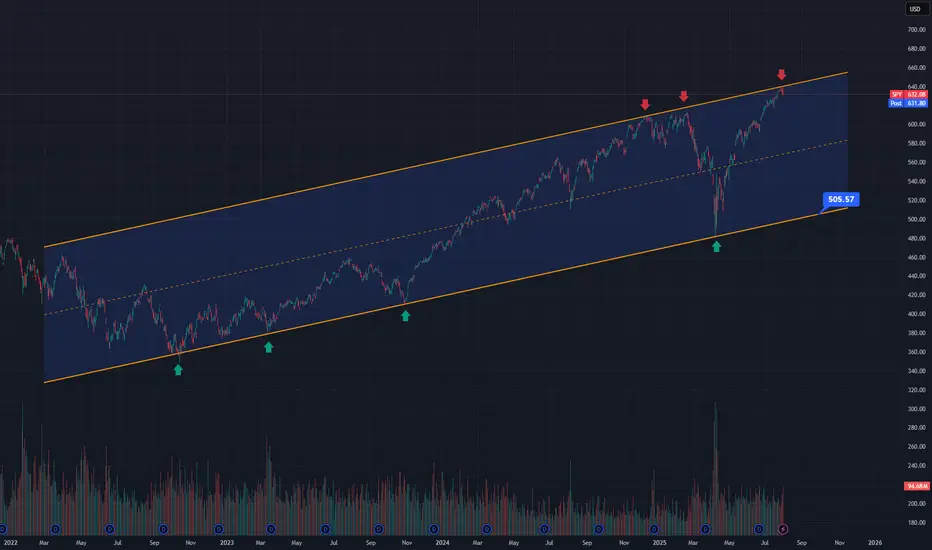
Next Leg down startingThe S&P 500 has been trading inside this rising channel for the last 3 and a half years. As you can see it has bounced off the bottom of the rising channel 4 different times and it is now back at the top of the channel. Price action gapped above the channel overnight but immediately sold off pre-market back inside the channel and completely reversed the move despite strong earnings from MSFT and META. This is very bearish and signals a move back down to the bottom of the channel once again and given that its already bounced off the bottom of the channel 4 different times, a 5th hit would have a high probability of breaking below the channel, which I would give a greater than 70% probability of playing out. If this happens, we will see much lower prices in this coming bear market.
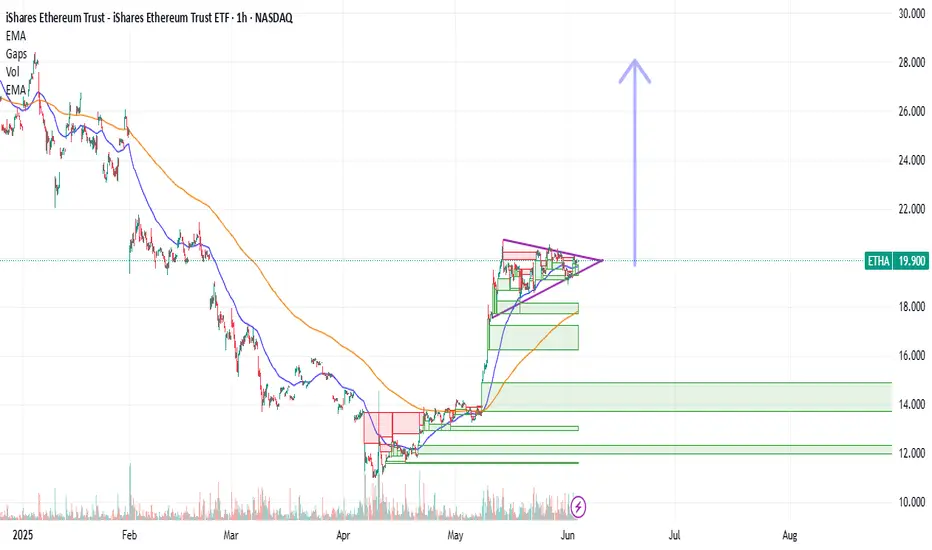
Ethereum Rally (?) : Strong Infusion with Volume RequiredEthereum can make a very strong rally of at least 35-40 percent.
And so the same goes for the Ishares Ethereum Trust ETF. (ETHA ETF)
But it needs to break the pennant.
And we need to observe strong volume.
Also, if we stay above the 50 and 200 period moving averages while this is happening, good things can happen.
Still, I am neutral until we break the pennant.
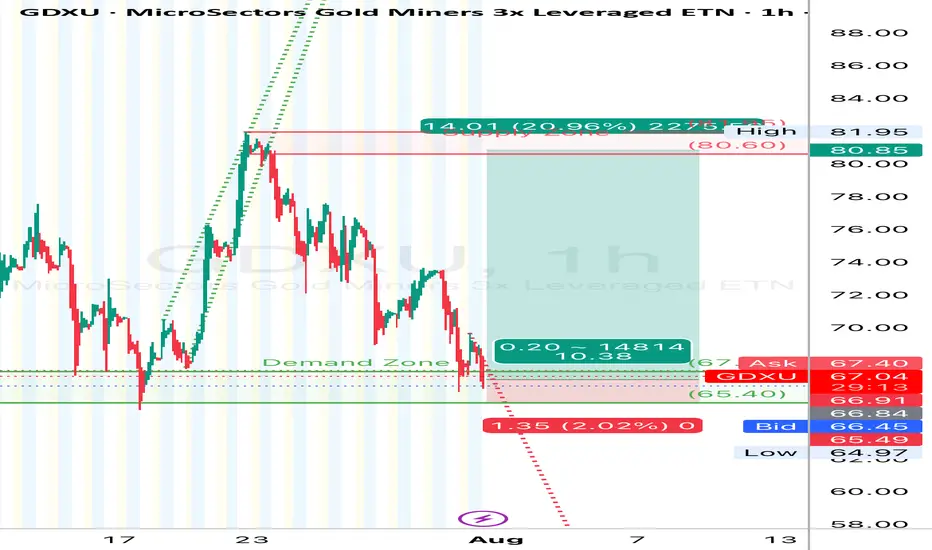
GDXU (Gold Miners 3x Bull ETF) Long SetupGDXU (Gold Miners 3x Bull ETF) | 1H Chart**
**The Fed held rates flat**, signaling a potential **pause or pivot**, which gave a bullish jolt to gold and miners.
* Lower rate expectations = weaker dollar = stronger gold = **GDXU gets rocket fuel**.
* This macro tailwind is **highly favorable** for leveraged gold miners in the short term.
* Strong rally from the \$65 zone may mark the beginning of a **Wave 3** move after a clean corrective structure.
* Impulse leg looks textbook — higher highs and rising momentum suggest bulls are in control.
* **Demand Zone:** \$65.00–\$67.33 — **key structure support that's held multiple times**, proving itself as a strong accumulation zone throughout July.
* **Supply Zone:** \$80.60–\$81.95 — recent rejection area; heavy volume and selling pressure reside here.
That \$65–67 demand zone? Straight-up Fort Knox. It’s been the bulls' home base all month. Now toss in the Fed holding rates and gold catching a bid — GDXU’s primed like TNT under \$82.”
🎯 **Long Trade Setup:**
* **Entry:** \$67.33
* **Stop Loss:** \$65.49
* **Take Profit 1:** \$80.60
* **Take Profit 2:** \$81.95
* **Risk/Reward:** \~**5.0 R**
*“Markets are driven by perception and momentum, not certainty.” – Stanley Druckenmiller*
#### ⚠️ **Disclaimer:**
This is not financial advice. Chart setups are for educational purposes only. Always do your own research, use stop-losses, and apply sound risk management.
$SPY – FOMC Risk Window: AI Predicts Downside Drift📅 Forecast Window: July 30 – August 30, 2025
📡 Powered by VolanX Protocol v3.0 | WaverVanir DSS
🏛️ MACRO SETUP – JULY 31 FOMC:
🏦 Fed Funds Rate: 5.50% (expected hold)
🧊 Inflation: Cooling but sticky (CPI ~3.2%, PCE ~2.6%)
💼 Labor Market: Slowing but not collapsing
📈 CME FedWatch: 91% odds of no hike, but tone may be hawkish
🧠 Key Risk: Liquidity compression or prolonged pause = risk-off conditions
🧠 VOLANX PROTOCOL FORECAST (30-Day):
🔸 Current Price: $636.29
🔹 AI Target: $627.46 (−1.4%)
🟠 Signal: HOLD
🧮 Direction Accuracy: 85.5%
⚠️ Model Confidence: −2.049 (bearish drift)
📊 Volatility Forecast: Low (~1.36%) = slow bleed conditions
📉 WAVERVANIR DSS SIGNAL:
🔸 Sentiment Score: 78
🔻 15D Forecast: $630.49 (−0.8%)
🔻 30D Forecast: $616.68 (−2.9%)
📉 Bias: Mild Bearish
🛑 Signal: Hedge exposure, reduce risk, do not chase longs
🔥 OPTIONS FLOW SNAPSHOT:
🚨 $1.53M Call Sweep (645C, Aug 8) = Speculative breakout bet
📉 Multiple Put Sweeps (633–634P, Aug 4) = Institutional hedging
🟢 Mid-dated 638C/645C flows (Aug 15–22) show straddle-the-news positioning
📐 TECHNICAL ZONES TO WATCH:
📉 Support Levels:
$627 = Fib + VolanX AI Target
$616 = DSS Forecast + liquidity pivot
📈 Resistance Levels:
$639 → Gap close
$645 → Major breakout trigger (options magnet)
🕯️ Structure: Distribution bias → No clear momentum unless Fed surprises dovish
🎯 STRATEGIC OUTLOOK:
Scenario Probability SPY Reaction
🟡 Hawkish Hold 65% Pullback toward $627
⚪ Neutral Hold 25% Choppy → $639 max
🟢 Dovish Surprise 10% Spike to $645+
📌 VolanX Protocol Guidance:
"This is a defense window. AI models and options flow both suggest uncertainty, not conviction. Trim longs, hedge risk, and wait for post-FOMC confirmation."
#SPY #VolanX #WaverVanir #FOMC #MacroForecast #OptionsFlow #DSS #SMC #LiquidityTraps #SmartMoney #TradingSignals #AITrading #FederalReserve #TechEarnings #RiskWindow #HawkishFed #FedHold #MacroAI
IWM SETUP. Looks good for a long.Bouncing off the trendline where it was supposed to. Will it get to the top of the broadening wedge?
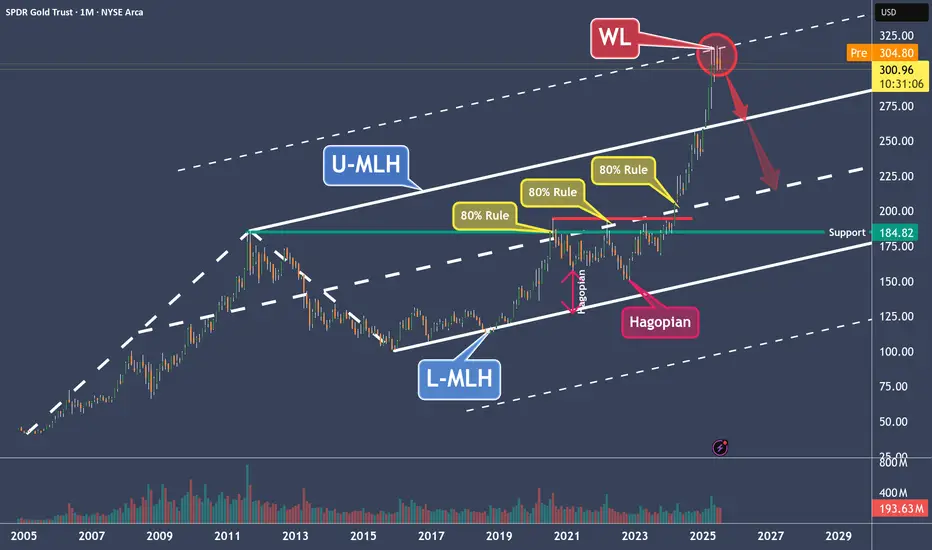
GLD – Why Gold Is a Clear Short to MePrice moved from the Lower Median Line (L-MLH) up to the Centerline, fulfilling the 80% rule.
Then we had two Hagopians, which sent price right back to the Centerline.
After the breakout above the Centerline, the next target was the Upper Median Line Parallel (U-MLH), which was reached rather quickly.
Finally, price broke above the U-MLH and was pulled up toward the Warning Line (WL).
Is this the end of the happy story?
I think so—because Gold has now reached its 2nd standard deviation, and there’s probably no more gas left in the tank.
The Trade:
- A logical target is the U-MLH.
- A secondary target is the Centerline.
At the very least, if you're long, this might be a good time to take some profits—because no tree grows to the moon.
For further details, I will follow-up with a Video explanation - See my Signature.
TLT LongThe broader market structure on the TLT 1D chart shows a clear downtrend, followed by a Change of Character (CHoCH) when price broke above the lower high near $86.50, signaling a potential trend reversal. This CHoCH is further validated by a strong push off the demand zone around $83–$84, where buyers stepped in with conviction, leading to a series of higher lows and an emerging bullish structure.
The demand zones below, especially the wide green area near $82.68–$84, are strong; price previously reversed sharply from this level, indicating institutional interest. In contrast, the supply zones between $88–$93 appear layered and moderately strong, especially around $88.20 and $92.70, where price previously sold off. However, the lack of deep wicks and clean rejections in the lower supply zones suggests that sellers may be weakening.
Currently, price is pushing upward toward the $88–$89 zone with bullish momentum. Within the marked region, price is climbing steadily after forming a minor higher low. If it can break above $88.20 convincingly, the next logical target would be the supply near $92.70–$93. A minor pullback to the $85.50–$86 zone could offer a buying opportunity if demand holds.
The trade bias is bullish with an expected continuation toward $92.70, assuming momentum holds. Invalidation of this outlook would occur if price breaks back below $84.00, which would indicate a failed breakout and potential return to the broader bearish trend. Momentum currently favors buyers, with higher closes and strong-bodied candles confirming upward intent.