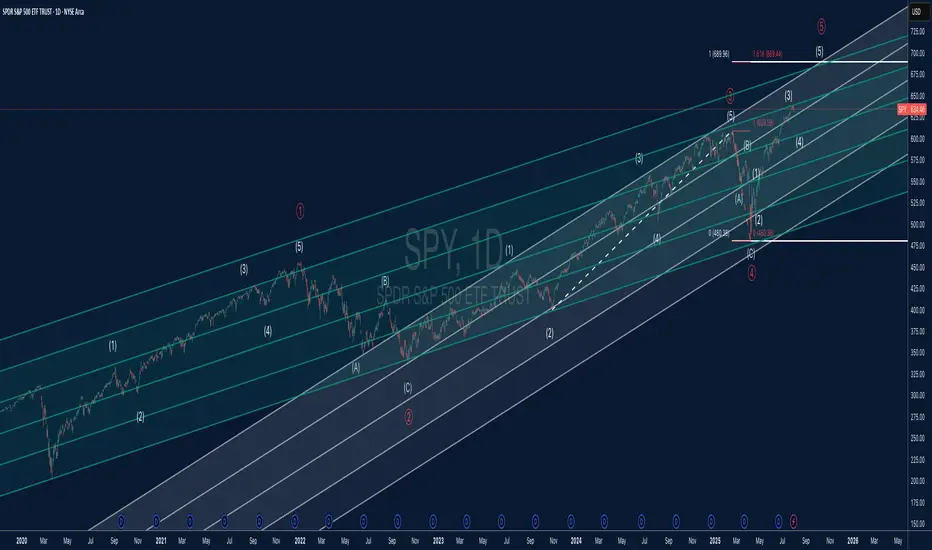
SPY Elliott Wave + Parallel Channel AnalysisThis chart offers a detailed Elliott Wave count for SPY (S&P 500 ETF) on the daily timeframe, combined with a structured parallel channel system to highlight key trend dynamics.
🔍 Elliott Wave Structure:
The price is currently advancing in what appears to be Wave (5) of Primary Wave ⑤, suggesting we may be in the late stages of a major impulsive cycle.
Each impulsive and corrective wave is clearly labeled, with the internal structure confirming classic Elliott Wave symmetry.
The 1.618 Fibonacci extension around $689 marks a critical upside target and potential completion zone for Wave (5).
Wave (4) held well at the lower channel boundary and completed near $480, establishing a solid base for the current advance.
📊 Channel Insights:
A system of parallel channels is applied to capture the overall trend and momentum structure.
Price is climbing toward the upper boundary of the long-term ascending channel, which has acted as dynamic resistance in previous waves.
The median lines have provided reliable support and resistance throughout the trend, making them important reference levels moving forward.
⚠️ Key Technical Levels:
Resistance: $689.44 (Wave ⑤ target at 1.618 Fib extension)
Support Zones: $609 (prior Wave (3) high), $575 (mid-channel support), and $480 (major cycle low)
A confirmed break above $690 could suggest a parabolic move, but risk of reversal grows as the upper channel is tested.
📈 Market Outlook:
SPY remains in a strong uptrend but is nearing a major confluence of wave and channel resistance.
A completed five-wave sequence would suggest the potential for a higher-degree correction, possibly leading into a Wave A/B/C scenario.
Short-term bullish bias remains valid while above $609, but watch for divergence or exhaustion signs near $689–$700.
ETF market
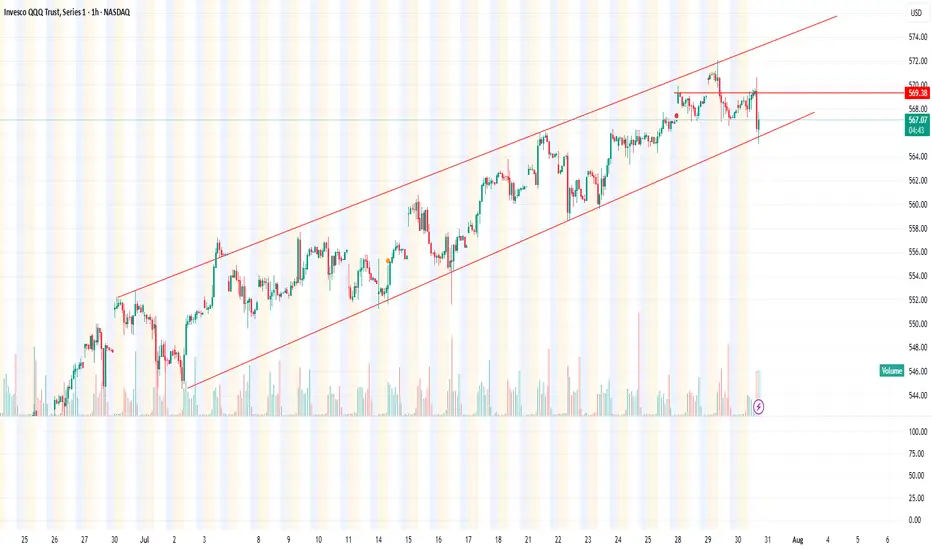
“QQQ Bounces Back — Trendline Still Holding”
📈 Trade Snapshot:
Despite a fakeout drop, QQQ holds the trendline. A break above $568.95 targets $570.64 short-term.
🎯 Setup Details:
→ Entry: $568.10
→ SL: ~$563.41
→ Target: $570.64
📌 Strong upward structure, with buyers defending key support.
📋 Hashtags:
#QQQ #BreakoutTrade #TrendlineSupport #ProfittoPath #ChartSetup #SwingTrade #PriceAction #SmartTrading

QQQ Forming Nice channelKey Observations:
Uptrend Channel:
QQQ has been trading within a rising channel.
The price respects both the support (lower red trendline) and resistance (upper red trendline) consistently.
Recent Price Action:
There was a sharp drop that briefly broke below the lower trendline support but quickly rebounded back inside the channel, indicating a false breakdown or buying strength at support.
A horizontal red line marks a previous resistance level, now potentially acting as a support.
Current Price:
The price is around $567.22, near the middle of the channel, but just below the recent local high/resistance.
Implication:
As long as the price stays within the channel, the uptrend remains intact.
A confirmed breakdown below the channel support would be bearish, while a breakout above the channel resistance would be bullish.
The Current State and Future Direction Of The S&P 5006/9/24
Created By Joeseph Emanuel Dennis
Idea:
Critical area and critical moment in not only the NASDAQ but for the entire bull market otherwise we'll start a prolonged retracement or an unlikely bear market turnaround. My SPY target remains 600 based on previous positive FOMC, CPI, Job Report Data, Rate Cuts, Elections, and Current Institutional development. On the technical side, the higher high movement began at the start of 2023 my initial target was 480 and I was correct! after the September weekly retracement on SPY, we have been pushing higher despite January's negative economic data and the conflict with IRAN. The daily is set to move currently above the 20MA with the weekly bullish and the monthly extremely bullish. IMPORTANT WEEK AHEAD! the future data will determine if the bullish trend will progress onward FOMC meeting will either scare people out of the market or drive the market into a rally along with central bank stocks. My bet is bullish even though inflation is record high thanks to the Biden administration we somehow keep pushing higher makes you wonder if the positive economic data is even accurate is employment being at a record high is that a good thing? Many Americans find them selfs more with two jobs or even three jobs is that a positive thing? Underemployment is also at record highs are these post-college graduates getting the salary they deserve or are they settling with two low-wage jobs? Nonetheless, the bull market will rain on with a summer rally. I will keep watching in case something turns around the enemy isn't Jerome Powell it's the liars at the white house and the propaganda creators over at MSNBC.
Note: This goes for Bitcoin as well! 80K here we go!
QQQ Technical Analysis: Bullish Trend Intact
From a technical perspective, the QQQ is in a powerful and well-defined uptrend. The price action since the April low has been contained within a sharp ascending channel, confirming strong and consistent buying pressure. The market is currently testing the upper boundary of this channel, which often acts as short-term resistance and can precede a minor pullback or consolidation phase.
A major bullish development was the recent breakout above the 535-540 price zone. This area had served as significant resistance from December through February, and its conversion into a new support floor is a textbook sign of strength. This level will now be a critical pivot point for the market.
Should a pullback occur, the chart lays out a clear hierarchy of support levels. The first line of defense is the intermediate support at 550. Below that lies the crucial 535-540 pivot zone, followed by another support area between 520 and 525. The most significant long-term support rests at the 500 level, which was a major resistance ceiling for much of the prior year.
The overall outlook remains bullish. As long as the price respects the ascending channel structure, particularly the lower trendline, the path of least resistance remains to the upside. Traders will likely view pullbacks toward these established support levels as potential opportunities to join the prevailing trend. A break below the channel and the 535 level would be the first signal of a potential momentum shift.
Disclaimer:
The information provided in this chart is for educational and informational purposes only and should not be considered as investment advice. Trading and investing involve substantial risk and are not suitable for every investor. You should carefully consider your financial situation and consult with a financial advisor before making any investment decisions. The creator of this chart does not guarantee any specific outcome or profit and is not responsible for any losses incurred as a result of using this information. Past performance is not indicative of future results. Use this information at your own risk. This chart has been created for my own improvement in Trading and Investment Analysis. Please do your own analysis before any investments.

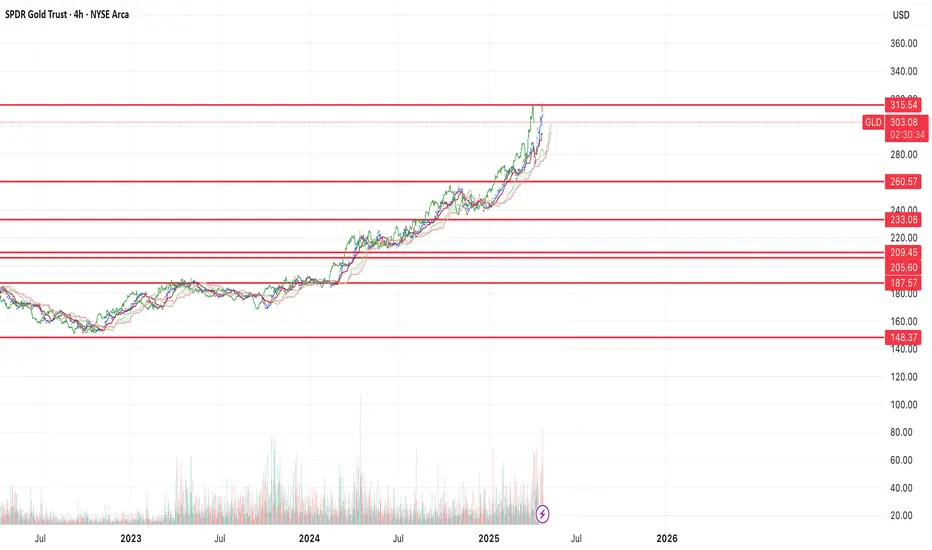
$GLD short term top in $260-148 target on the downsideAMEX:GLD looks a bit extended here. I could see the possibility of GLD falling back to the $260 support at a minimum and maximum all the way down to $148
The $209 support would be the 50% retracement of the recent run. I like that as a level for a bounce.
Let's see where we end up.
Nightly $SPY / $SPX Scenarios for July 30, 2025🔮 Nightly AMEX:SPY / SP:SPX Scenarios for July 30, 2025 🔮
🌍 Market‑Moving News 🌍
🧭 Fed Holds Steady Amid Uncertainty
As the FOMC enters its July 29–30 meeting, the Fed is expected to keep rates unchanged at 4.25%–4.50%, even as one or two governors may dissent in favor of rate cuts amid mixed economic data. Recent strength in consumer spending contrasts with weakness in housing and construction.
🌐 U.S.–China Trade Talks Resumed in Stockholm
Talks are under way aimed at extending the tariff truce before the August 12 deadline. Both sides described progress as constructive, though analysts remain cautious on the timeline and potential outcomes.
🛢️ Oil Up / Dollar Firmer, But Risks Remain
Brent crude hit ~$72.50/barrel (+3.5%) while WTI rose to ~$69.20 on a mix of geopolitical tension (possible new Russia tariffs) and trade optimism. The U.S. dollar edged higher following the U.S.–EU trade agreement.
📈 IMF Revises Up Global Growth—but Flags Tariff Risks
The IMF raised its 2025 growth forecast to 3.0% and maintained 3.1% for 2026, citing pre-emptive consumer demand—but warned that ongoing U.S. tariffs and policy inconsistency could dampen momentum.
📊 Key Data Releases & Events 📊
📅 Wednesday, July 30:
FOMC Rate Decision & Powell Press Conference
The Fed is expected to hold interest rates steady. Powell’s remarks will be closely watched for signals on the timing of future cuts and views on inflation and labor markets.
Advance Q2 U.S. GDP Estimate
The first look at Q2 growth is expected around +1.9% YoY, potentially validating a rebound after Q1’s contraction.
June PCE & Core PCE (Personal Consumption Expenditures Index)
The Fed's preferred inflation gauge. Markets will monitor if core inflation remains elevated, which may reinforce policy caution.
⚠️ Disclaimer:
This summary is for educational and informational purposes only—it is not financial advice. Always consult a licensed financial advisor before making investment decisions.
📌 #trading #stockmarket #economy #Fed #GDP #inflation #trade #tariffs #markets

QQQ in a hot moment!Based on my analysis, the #QQQ got the reversal pattern candle, and we will have some consolidation starting this week until the end of September 2025.
My analysis becomes invalid in the daily candle close above the $572.11 (the high of today)
Do your diligence and study more; technical analysis is just the probabilities overview.

XLU Long1. Market Structure Overview
A notable Change of Character (CHoCH) occurred at 84.09, breaking below a prior higher low and signaling a shift from bullish to bearish momentum. This was followed by a clear Break of Structure (BOS) at 83.40, confirming the bearish sentiment and initiating a new lower low sequence.
2. Supply and Demand Zones
Supply Zones (Resistance):
85.00–85.55: Strongest supply zone where multiple bearish rejections originated.
84.75–85.00: Closest overhead supply zone—price is expected to react if it reaches this area.
Demand Zones (Support):
84.00–84.20: Local demand that initiated the recent bullish push; possible short-term support.
83.10–83.40: Major demand zone that sparked the latest upward move; strong buyer interest observed.
3. Current Price Action & Expectation
Price is currently trading at 84.46, moving upward from the 84.00–84.20 demand zone. The near-term outlook suggests a continued push toward the 84.75–85.00 supply zone. If price can decisively break above 84.99, bullish momentum could extend toward 85.30–85.55.
However, if price rejects from 84.75–85.00, a pullback into 84.00–84.20 is expected before another attempt higher. A breakdown below 84.00 would open downside risk toward the stronger demand at 83.10–83.40.
4. Momentum & Risk Outlook
Momentum is gradually shifting bullish after forming a swing low near 83.40. Maintaining structure above that level is crucial for a bullish continuation. Watch for a clean break and retest of the CHoCH level at 84.99 to confirm strength.

$SPY rolling over, potentially to new lows?While I was early to the idea (like usual), still don't think the thesis will be wrong. I still believe we're going to see a large move down from here.
Yesterday's price action made me pretty confident a top was in (TBD). We had positive news and the market couldn't rally on that positive news and we ended up closing at the lows -- indicating to me there's no more buyers.
Today we have treasuries, the dollar and volatility all rallying while equities selloff, a classic risk off signal. You also have crypto selling off too.
I think we see a large risk off move from here on out, the target is the $440 area (extreme down to $400), but if we find support at one of the other levels above that, there's potential for us to rally from there.
Will have to see how price action plays out over the coming weeks.
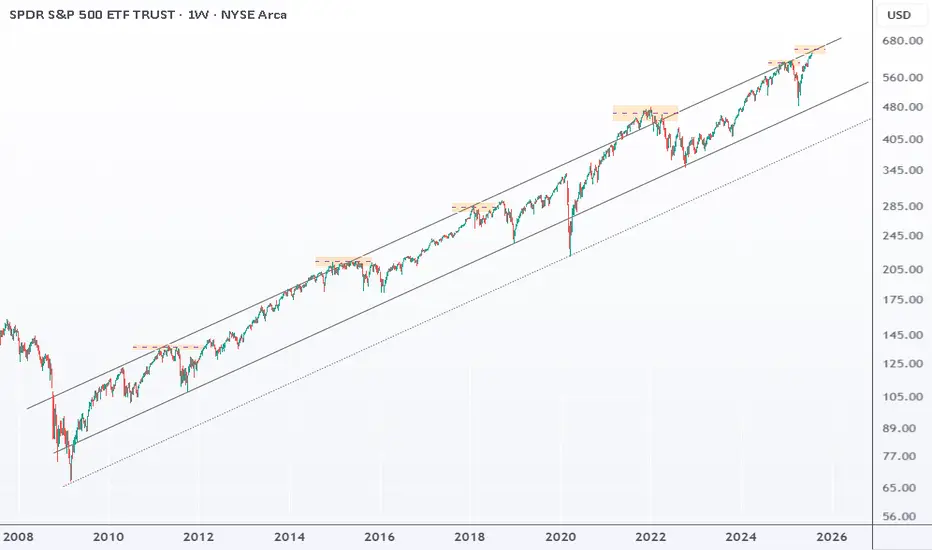
SPY : back near the top of its upward channelSPY is back near the top of its upward channel, a strong resistance.
Every time this happened since 2011, markets dropped 10–27%.
Still trending up, but this setup doesn’t look great.
Since the April low, SPY is up 30%, short-term trend is stretched and vulnerable.
A closer up view of SILJA slighty closer up view of my previously posted SILJ analysis. The yellow could could be off by one degree...in other words the yellow (3) might actually be the teal (3), but either way I see a major move up very very soon...by end of August >$20 imo.

Call me crazy....but SILJ looks explosive here...In my opinion we are seeing a series of 1,2's on SILJ which are about to result in a MAJOR move to the upside. IF I am correct then we will see $20+ in very short time...by the end of August!

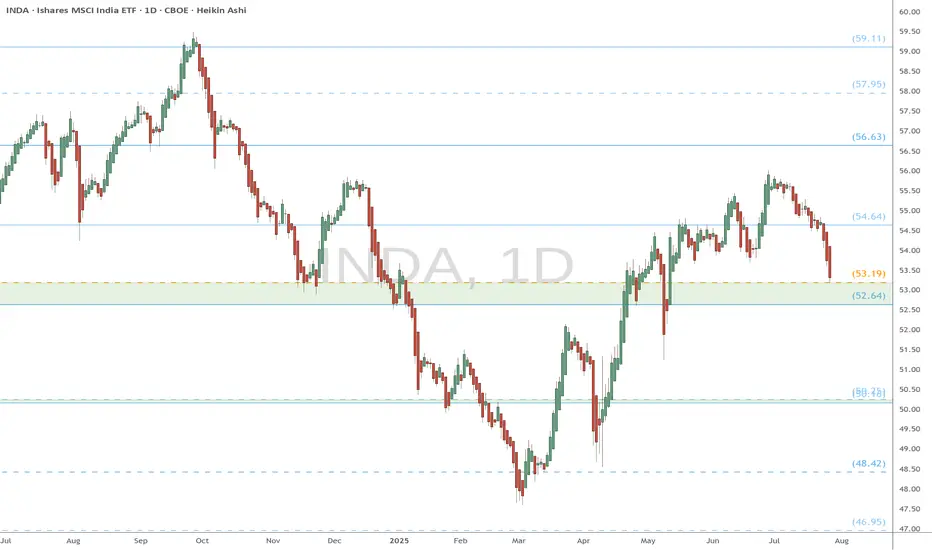
INDA eyes on $52.64-53.19: Major support could mark the BottomINDA painting a bottom with an inverted Head-n-Shoulders.
The neckline happens to be a fib confluence $52.64-53.19
Good spot to consider longs with stop loss just below zone.
Market Outlook: Bulls are still in control, but be defensive.At theses levels don't let your guard down. I could see us pulling back next week, meanwhile we may continue to stay above the 10-EMA for now.

Nightly $SPY / $SPX Scenarios for July 29, 2025🔮 Nightly AMEX:SPY / SP:SPX Scenarios for July 29, 2025 🔮
🌍 Market‑Moving News 🌍
U.S.–EU Trade Deal Sparks Optimism
The U.S. and EU signed a trade framework allowing a 15% tariff rate on most EU imports, averting harsher penalties. The S&P 500 and Nasdaq both closed at fresh record highs, supported by upbeat tech earnings sentiment—Tesla advanced on a new $16.5B AI chip deal with Samsung—while U.S.–China trade talks resume in Stockholm.
Fed Likely to Hold Rates; Political Pressure Mounts
The Fed is expected to leave its benchmark rate at 4.25%–4.50% at the July 29–30 FOMC meeting. Chair Powell faces growing political pressure from President Trump to cut rates and concerns about central bank independence remain elevated.
Trade Talks Extension to Avoid Tariff Hike Deadline
The August 1 tariff deadline looms. Markets are watching to see if trade deals with China, Canada, and the EU extend the pause or risk new tariffs. Volume in AI/chip stocks and industrials reflects sensitivity to trade developments.
📊 Key Data Releases & Events 📊
📅 Tuesday, July 29
FOMC Meeting Begins — All eyes on Fed rate decision and updated projections.
GDP (Advance Q2 Estimate) — Expected around +1.9% on signs of economic rebound.
⚠️ Disclaimer:
This summary is for educational and informational purposes only—it is not financial advice. Always consult a licensed financial advisor before making investment decisions.
📌 #trading #stockmarket #economy #Fed #trade #tariffs #PCE #jobs #technicalanalysis

MSTY / MSTRMSTY is mathematically pressured into an exponentially decay relative to MSTR. This chart demonstrates this historical pattern in an obvious way.

PSIL healthy sideways consolidation in very tight rangeHealthy consolidation sideways for three days after breaking through monthly resistance at $17 which we are how holding as support. Volume still meagre, still waiting for this to ramp up significantly to let us know the herd is entering the trade along with us.
Support: 17.03, 16.94, 16.80
Resistance: 17.15, 17.41, 17.60


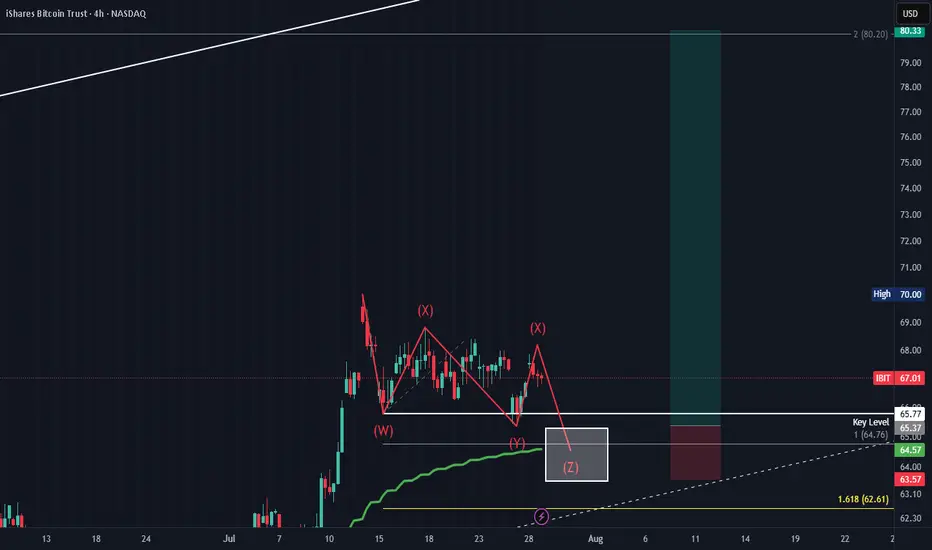
IBIT swing long. WYXYZ corrective pattern.Potential swing long setup. WXYXZ corrective pattern. Taking the lows 1 more time onto the 1 to 1 fib trend. Overall target 80 which should align with BTC hitting 135-150k.
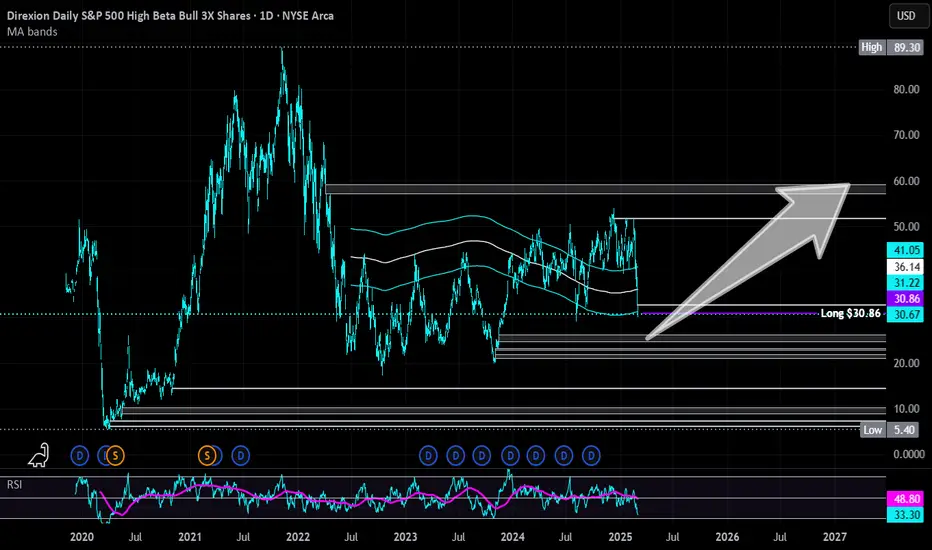
Direxion High Beta Bull S&P 500 3X | HIBL | Long at $30.86Contrarian view, despite tariffs. I don't think this rodeo is over - but I could always be wrong. Even if individual consumption drops (which I think it has for some time now), rising prices will continue to mask it. Many, but not all, companies will profit and until there is a "bigger" catalyst... bullish.
AMEX:HIBL is a personal buy at $30.86 (also noting the possibility of it going into the FWB:20S in the near-term)
Targets:
$40.00
$45.00
$50.00
XHB HTF Elliot Wave Count and Wykoff Distribution HTF Elliot Wave Count aligning with HTF Wykoff Distribution Pattern. In confluence with Fibonnacci trend/extension and fibonnaci time. Also further confluence with SPX HTF Wave Count and Distribution

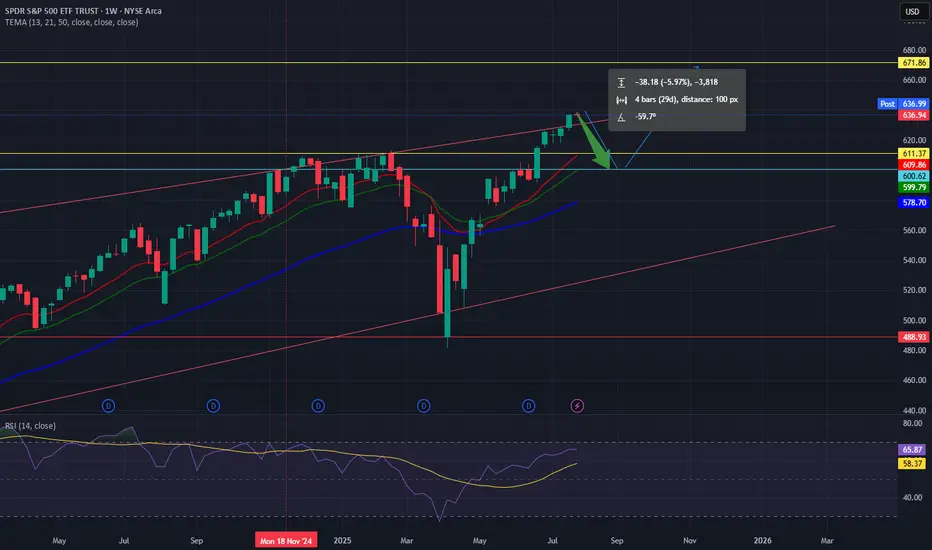
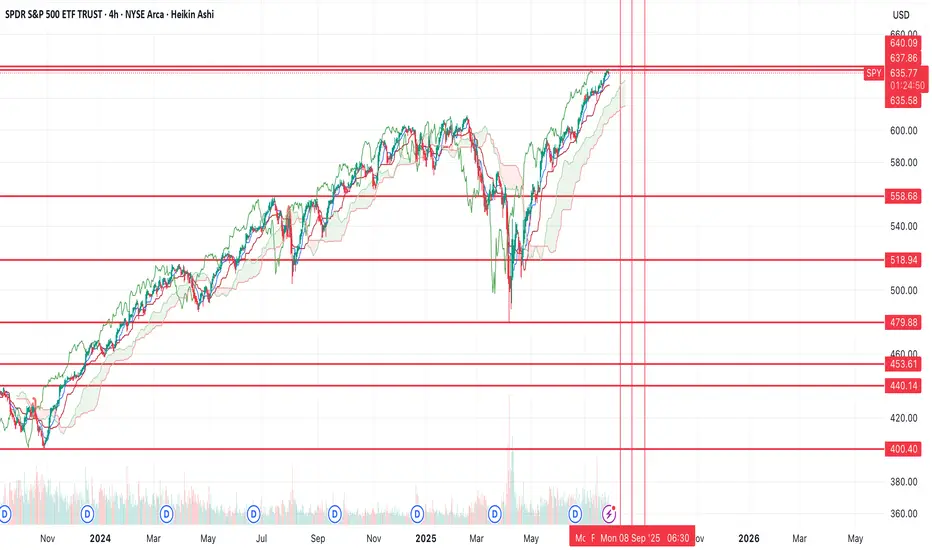
SPY Weekly Chart: Rising Wedge Signals Imminent PullbackSPY Weekly Chart Overview (Current Price: ~637)
🧭 Context:
Indicators: TEMA (13/21/50) & RSI (14)
Price is extended, RSI near overbought (65.87), and forming a rising wedge — a bearish pattern.
🔻 Bearish Setup: Rising wedge signals possible reversal.
Momentum weakening despite higher highs.
Price extended above TEMA — a 600–610 pullback looks likely.
📊 Key Levels:Resistance: 672
Support: 611–600 → 578 → 488
Break below 600 could trigger broad downside.
🟢 Bullish Case:
Breakout above 672 with volume = momentum continuation (AI/FOMO driven).
🎯 Conclusion:
SPY is technically stretched. Risk/reward favors caution.
Watch for pullback to 600–610