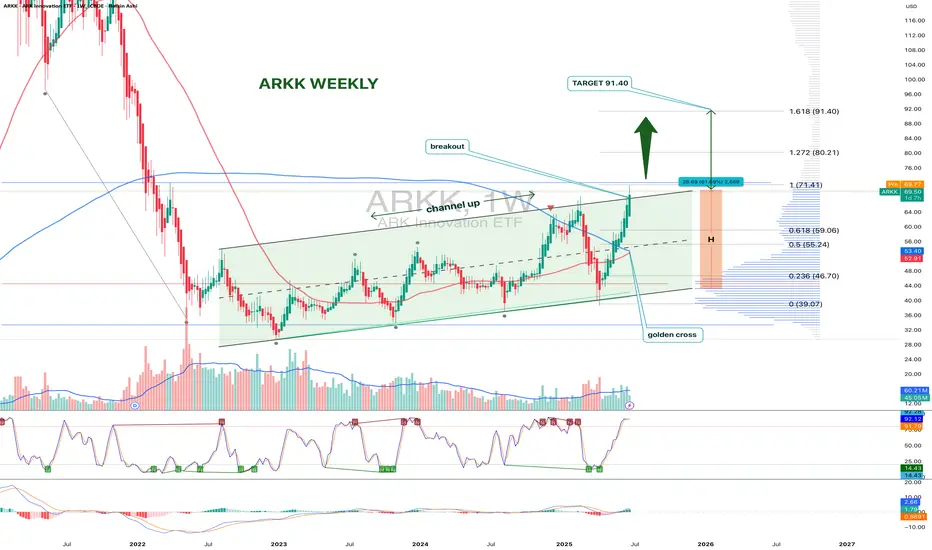
ARKK: when a breakout isn’t just a breakout-it’s a runway to $91On the weekly chart, ARKK has broken out of a long-standing ascending channel, ending a year-long consolidation phase. The breakout above $71.40, with a confident close and rising volume, signals a transition from accumulation to expansion. The move came right after a golden cross (MA50 crossing MA200), further confirming institutional interest. Price has already cleared the 0.5 and 0.618 Fibonacci retracements — and the 1.618 extension points to $91.40 as the next technical target.
Momentum indicators like MACD and stochastic remain bullish with room to run. Volume profile shows low supply above $75, which could fuel an acceleration toward the target zone.
Fundamentally, ARKK remains a high-beta, high-risk vehicle — but one with focus. The ETF is positioned around next-gen tech: AI, robotics, biotech, and automation. Assets under management now exceed $9.3B with +$1.1B net inflow in 2025. YTD return stands at 37%, and its top holdings (TSLA, NVDA, COIN) are back in favor. This isn’t just a bet on innovation — it’s diversified exposure to a full-blown tech rally.
Tactical setup:
— Entry: market $69.50 or on retest
— Target: $80.21 (1.272), $91.40 (1.618 Fibo)
Sometimes a breakout is just technical. But when there’s volume, a golden cross, and billions backing it — it’s a signal to buckle up.
ETF market
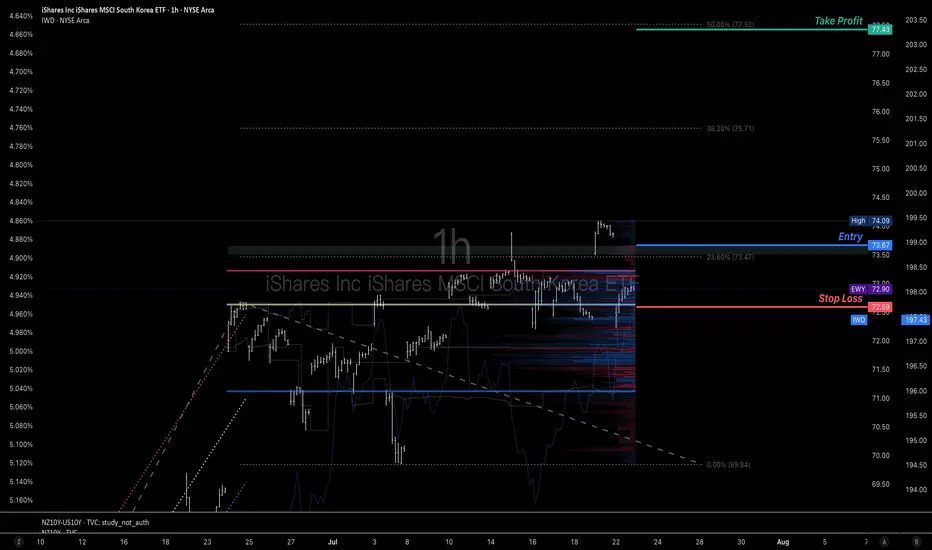
A potential chance to get long position of Korean equity marketsKorean economy and stock market emotion are well boosted by their regulation reform and new president elect. Many global traders miss the previous uptrend and the price is about to test the current resistance again.
Imma use a buy stop order @73.67 to try to get in the train to diverse my long position on equity market.
If you only do swing trades, there's a long swing trade plan on my chart. I may use the latest to take half of profit once the price hit the first or second resistance @77.43 above the current trading area to control the position size that can fit for long term trade.
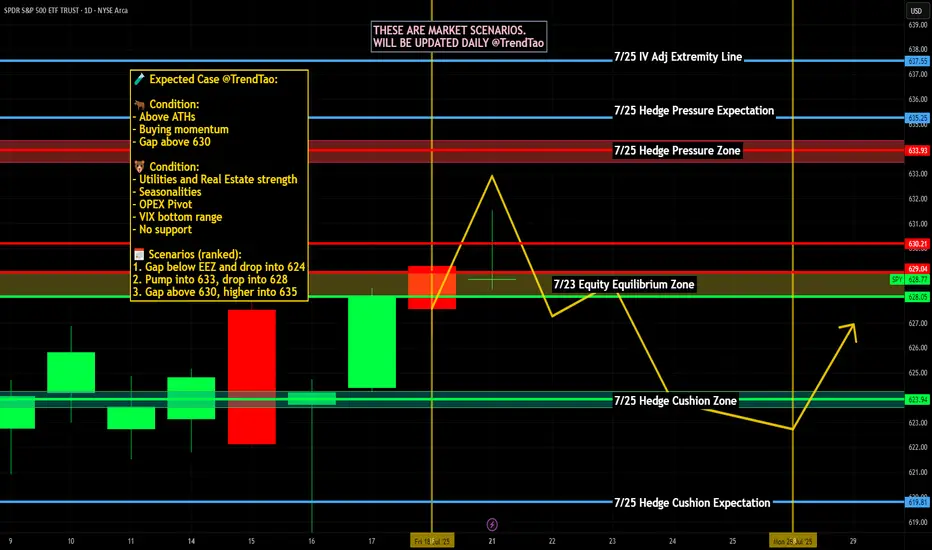
Nightly $SPY / $SPX Scenarios for July 23, 2025🔮 Nightly AMEX:SPY / SP:SPX Scenarios for July 23, 2025 🔮
🌍 Market-Moving News 🌍
📈 Morgan Stanley Stays Bullish
Morgan Stanley reaffirmed its optimistic view, forecasting the S&P 500 will reach 7,200 by mid‑2026. They cited strong earnings and anticipated rate cuts as key drivers, though warned of risks from rising Treasury yields and tariff-related cost pressure
📉 Inflation Debate Reignites
A renewed debate is underway regarding whether tariffs are "transitory" or persistent inflation drivers. Treasury counselor Joseph Lavorgna argued tariff impacts will be one-off, while others caution long-term price pressures may persist, complicating Fed policy directions
🏛️ Calls for Fed Reform Intensify
Treasury Secretary Scott Bessent suggested structural reforms to the Federal Reserve could have greater long-term impact than removing Chair Powell, highlighting ongoing concerns over central-bank governance amid political criticism
💳 Investors Shift to Corporate Bonds
As equity valuations have surged, investors are reallocating toward investment-grade corporate bonds, reducing credit spreads to the tightest levels since 1998—a sign of elevated risk appetite balanced with caution
📊 Key Data Releases & Events 📊
📅 Wednesday, July 23:
(No major U.S. economic releases)
Market focus remains on tech earnings (Tesla, Alphabet) and Fed signals following Tuesday’s Powell address.
⚠️ Disclaimer:
This information is for educational/informational purposes only and does not constitute financial advice. Please consult a licensed financial advisor before making investing decisions.
📌 #trading #stockmarket #economy #tariffs #Fed #earnings #corporatebonds
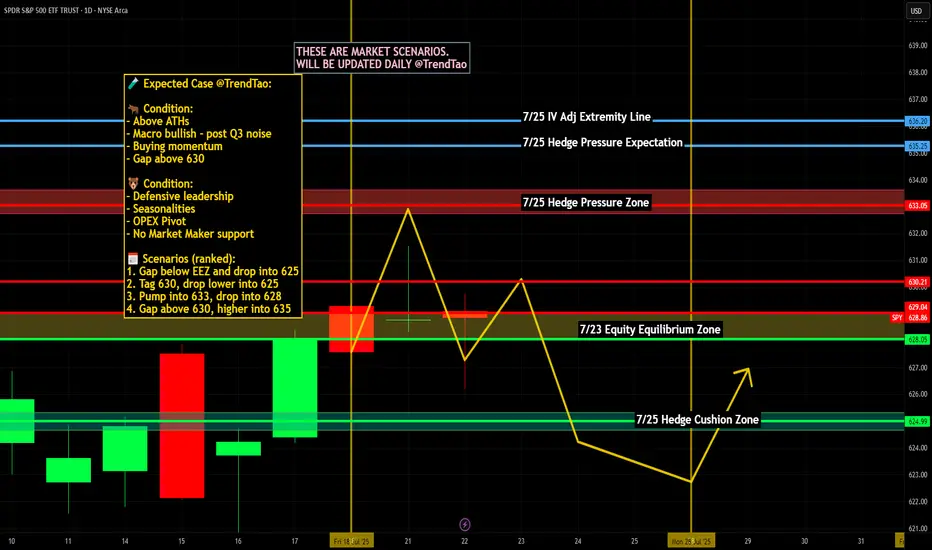
SPY "SP500 ETF" 1️⃣ Market Structure Overview
Change of Character (CHoCH) – Level: 626.19
The market printed a clear CHoCH at 626.19, breaking below a recent higher low. This shift signals the end of bullish dominance and marks the first warning of potential trend reversal. It’s a critical structure break indicating weakness in prior buy-side momentum.
Break of Structure (BOS) – Level: 631.54
A firm Break of Structure followed at 631.54, confirming the downtrend. This BOS came after price failed to establish a new high and instead reversed from the premium area, solidifying bearish continuation. It now acts as a key upper boundary for sellers.
2️⃣ Demand Zone Analysis (Support Levels)
The demand zones (green areas) are historical locations where price previously reacted strongly to the upside—suggesting institutional buying or significant liquidity absorption. These zones act as potential long-entry areas and support during pullbacks:
625.50: Immediate demand zone; price has hovered above this level recently, signaling short-term support.
624.80: Strong base formed after earlier accumulation; minor rally originated here.
623.80: Clear area of bullish imbalance; look for wick rejections here.
622.75 & 621.90: Deeper demand zones—likely to hold if the market retraces further and volatility spikes. These levels represent high-probability reversal points if liquidity sweep occurs below 624.
Each zone increases in risk/reward the deeper price pulls back, but also carries a higher chance of forming strong bullish reaction.
3️⃣ Supply Zone Analysis (Resistance Levels)
The supply zone (red area) at 628.85–631.54 was the origin of the last sharp bearish move following the BOS. It now acts as a potential reversal or distribution zone:
628.85 – 631.54:
This area previously held heavy sell-side interest and rejected bullish advances. It overlaps with a structural BOS and sits near the high of the prior rally. Watch for bearish price action or lower-timeframe exhaustion here. A break and close above 631.54 would invalidate this zone and indicate a major structural reclaim.
4️⃣ Current Price Action (Inside the Marked Border)
Price is currently reacting around 627, just above the CHoCH level (626.19). This zone lies between the upper boundary of the nearby demand and the lower edge of the supply. Within this boxed region:
Price is showing temporary consolidation, suggesting indecision.
A short-term dip into the 625.50–624.80 demand cluster is expected before any bullish leg.
If price holds above 626.19 and shows reversal signals (like bullish engulfing, hammer, or low-volume rejection), we may see continuation to test the 628.85–631.54 supply zone.
If structure fails and price breaks below 626.19 with conviction, the next downside targets are deeper into the 622–624 range.
This bordered zone represents a transitional area where the next directional move will likely be decided.
5️⃣ Momentum & Structure Bias
Structure remains bearish after the BOS, but current price is attempting to build a base.
If price maintains above CHoCH (626.19) and demand levels begin to hold, we may enter a bullish corrective phase.
Watch for rising volume on bullish candles or absorption wicks in demand zones as confirmation.
6️⃣ Macro/Fundamental Context (as of July 22, 2025)
While the chart is technical, the SPY ETF (S&P 500) is influenced by broader economic data. Around this date, watch for:
Earnings Season: Mid to late July often brings earnings from major S&P 500 companies. Positive tech earnings can fuel bullish momentum.
FOMC Speculation: If investors expect no rate hike or a dovish Federal Reserve stance, demand zones are more likely to hold.
Economic Reports: Look out for PMI or consumer confidence reports this week. A weak reading may drive SPY lower into demand, while a strong reading could help push it toward the supply zone.
If any bullish macro surprise occurs this week, it would support the bounce from the demand zone.

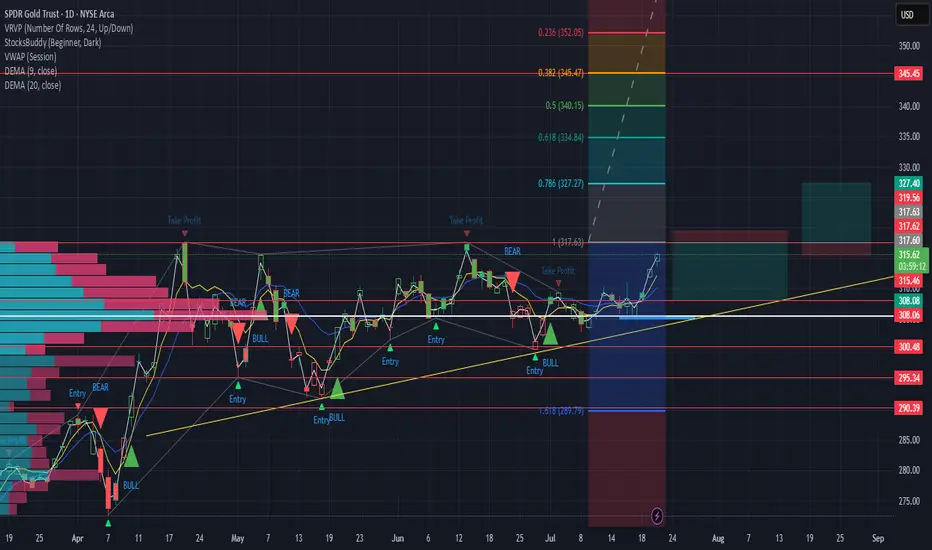
GLD up or down plan OK, tell me if this makes sense. if it rejects off of the 317.60ish area i would trade back to the down side to $308.10 ish - 4.80 R/R. If it breaks out and retests I would be trading to 327 area. 4.5 R/R - Let me know what you see and your thoughts. i'll try to share what i did.
DIA "Dow Jones Ind Ave. ETF"DIA 15-Minute Technical Outlook
The DIA chart reflects a short-term corrective structure within a broader bullish sequence. Recent price action has established new break-of-structure (BOS) highs, followed by a pullback toward a key internal liquidity zone. Your zones (supply and demand borders) are strategically placed and suggest an imminent inflection point.
🔍 Market Structure Overview:
A Bullish Break of Structure (BOS) occurred at 446.91, confirming bullish control in the short term.
Price has since retraced from this high, forming a local lower high near the 0.5 fib level of the last impulse, indicating a healthy pullback phase.
The recent Change of Character (ChoCH) at 442.12 aligns with a potential short-term retracement target and serves as a key validation level.
🟩 Demand Zone Analysis
Level: ~440.60–442.00
This green zone is supported by multiple confluences:
A prior liquidity sweep and bullish impulse, signaling strong buyer interest.
Proximity to the ChoCH, adding structural significance.
A demand imbalance that remains unmitigated, making it a likely reaction zone.
📌 Expectations: A retracement into this zone may provide a low-risk long opportunity targeting a retest of the 446.00–447.50 supply cluster.
🟥 Supply Zone Analysis
Level 1: ~446.00–446.91 (short-term supply near BOS)
Level 2: ~447.60–449.00 (higher-timeframe unmitigated supply)
These zones represent areas of historical selling pressure and potential liquidity traps where price may encounter resistance. The stacking of zones increases the potential for a reaction or short-term rejection.
📌 Expectations: Should price approach these levels post-demand bounce, tight management or scaling out is advised.
📈 Technical Confluence Points:
Fib Retracement (0.5): Price is hovering near the 0.5 level of the recent bullish leg (~444.05), acting as interim support.

SPY Options Analysis Summary (2025-07-22)
🔻 AMEX:SPY Weak Bearish Put Setup (0DTE) – 07/22/25
All models agree: price is weak, momentum is limp, and VWAP is above.
But conviction? Not unanimous. High-risk, high-reward 0DTE scalpers only.
⸻
📉 Trade Setup
• 🟥 Direction: PUT
• 🎯 Strike: $626.00
• 💵 Entry: $0.57
• 💰 Target: $1.70 (+200%)
• 🛑 Stop: $0.28 (–50%)
• 📅 Expiry: Today (0DTE)
• ⚖️ Confidence: 65%
• ⏰ Entry Timing: Market Open
⸻
🧠 Multi-AI Consensus
Model Bias Action
Grok/xAI Weak Bearish ⚠️ No Trade
Claude Weak Bearish ⚠️ No Trade
Gemini Bearish ✅ $627 Put
Llama Moderately Bearish ⚠️ Conservative Put
DeepSeek Bearish ✅ $626 Put
🔹 VWAP < Price = Bearish bias
🔹 RSI = Neutral → watch for fakeouts
🔹 VIX favorable (<22)
🔹 Volume = weak = risk of whipsaw
⸻
⚠️ Risk Notes
• Bounce risk off session lows is real
• Lack of momentum may cause theta burn
• Best for scalpers who react fast — not a swing trade
• No conviction = smaller size, tighter leash
⸻
📢 Tagline (for virality):
“ AMEX:SPY is limping, not bleeding. But if it breaks, 200% comes fast. 0DTE scalpers: this is your window.” 💣

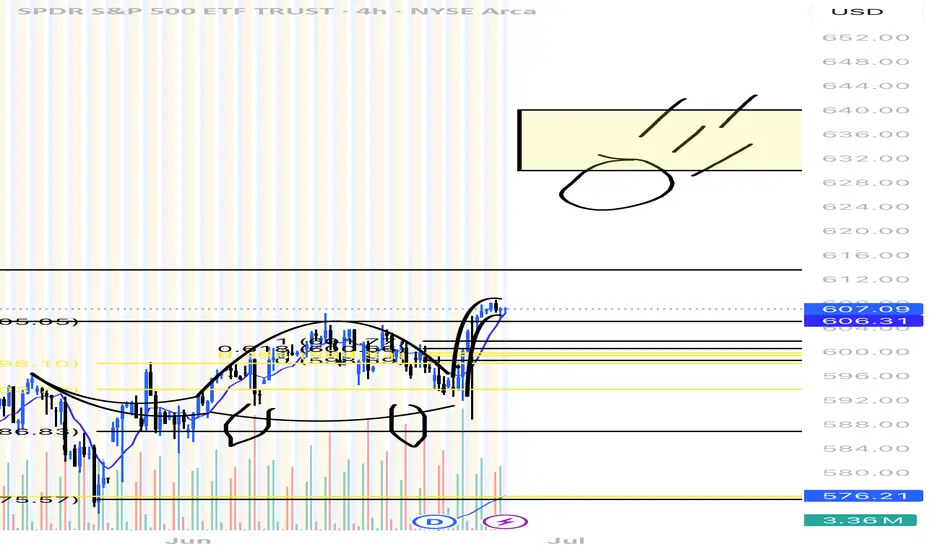
Dinosaur gets hit by a meteor We can see a clear breakout from previous lows only target left is that meteor at 630-640.
We will see this by the end of july!
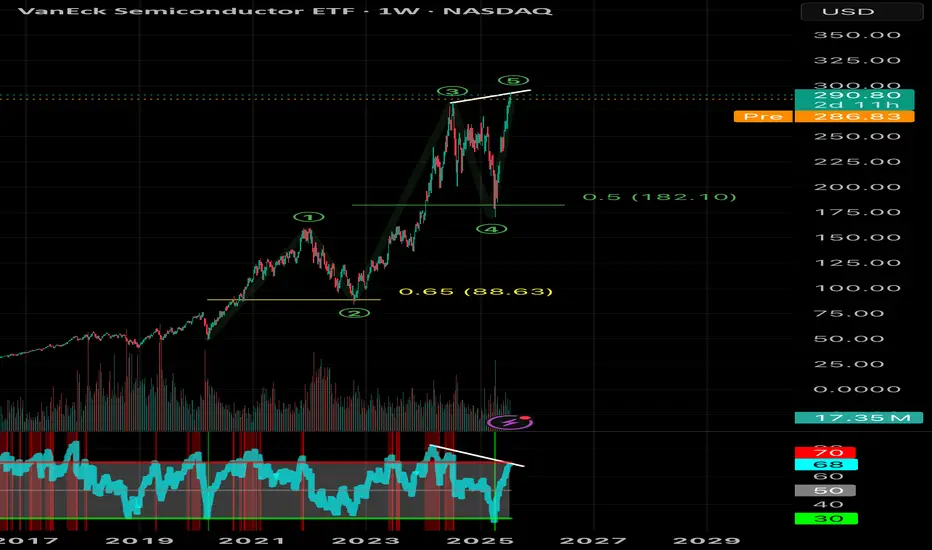
Bearish DivergencesWe could be running out of steam here. This to me looks like the final leg of the grand supercycle in semis. Bearish divergences on the RSI and a final 5th wave move up. If we reach $300 I’d expect a rejection and possible roll over. Keep an eye on this, retail are loading up but the charts don’t support the hysteria at these levels.
Not financial advice
Nightly $SPY / $SPX Scenarios for July 22, 2025🔮 Nightly AMEX:SPY / SP:SPX Scenarios for July 22, 2025 🔮
🌍 Market-Moving News 🌍
🚀 Tech & EV Stocks in Focus Ahead of Earnings
Futures were quiet ahead of Tuesday’s open, but key movers included Astera Labs (+19%), Alphabet (+2.7%), Netflix +2%, and Robinhood –4.9% after being passed over for the S&P 500. Investors are positioning ahead of major tech and EV earnings this week — including Tesla, Alphabet, Lockheed Martin, Coca‑Cola, and Honeywell
📣 Powell Speech Eyed for Rate Clues
Fed Chair Jerome Powell is set to speak at 8:30 AM ET today at the Integrated Review of the Capital Framework for Large Banks Conference in D.C. Markets will be watching for any indications on future interest rate direction
🌏 Japan’s Political Shift Has Little Market Impact
Japan’s ruling coalition lost its upper-house majority over the weekend, but markets remained stable as it was largely expected. The yen held steady, and Asian equities stayed calm amid the holiday—focus remains on upcoming corporate earnings
📊 Key Data Releases & Events 📊
📅 Tuesday, July 22:
8:30 AM ET – Powell Speech: Key address at the bank regulation conference. Tone and forward guidance may sway bond and equity markets.
After Market Close – Alphabet & Tesla Earnings: Heavyweights due today—market attention will track revenue guidance, especially on advertising, EV demand, and AI.
⚠️ Disclaimer:
For educational and informational purposes only. Not financial advice—consult a licensed advisor before making investment decisions.
📌 #trading #stockmarket #tech #Fed #earnings #AI #infrastructure #volatility
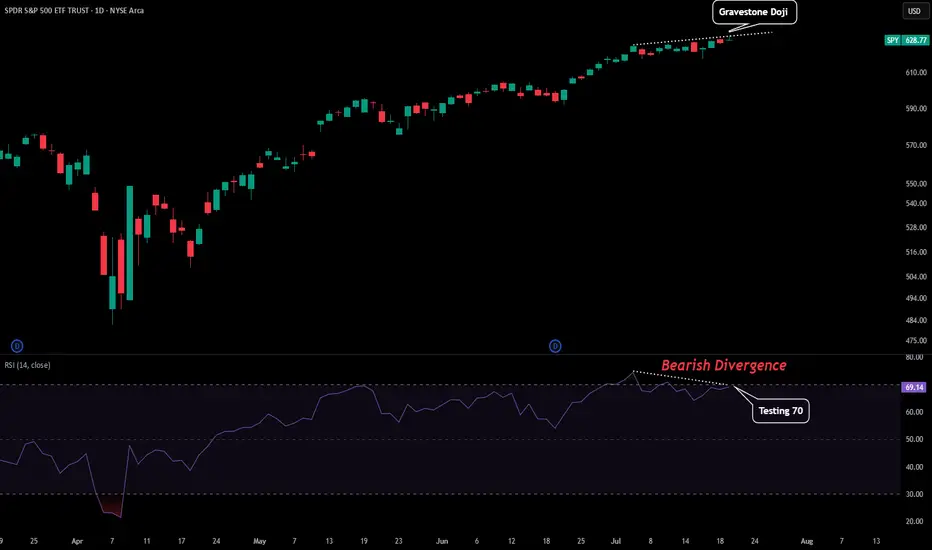
SPY - First Signs of TroubleFrom this entire uptrend we might be seeing the first signs of trouble.
Here are some reasons for this from a technical perspective:
-Daily Printed a Gravestone Doji
-RSI Testing Overbought as Resistance
-Slight Bearish Divergence on Daily RSI
-Momentum Stalling
There could also be some catalyst tomorrow that contribute to this. Powell speaks tomorrow so depending on what he says could either add fuel to a market reversal or negate these bearish signals and send us on another leg. Prepare for volatility.
July 21 Special Update : Metals, SPY & More. What's Next.This special update is to highlight why I continue to believe traders should stay very cautious of this rally in the SPY/QQQ/BTCUSD.
Underlying economic data suggest that this is one big speculative rally following the April Tariff collapse.
And, the economic data I see from my custom indexes suggests the markets are moving into a very volatile and potentially dangerous topping pattern.
As I've stated many times in this video. I'm not saying the markets have topped and you should SELL EVERYTHING. I'm suggesting this market is extremely over-valued in terms of the underlying risk factors at play and the very clear data that suggests the markets are already in a recessionary price trend.
You may ask, "How can the markets continue to rally like this in a moderate recession?".
The answer is simple.
All bubbles end with a super-speculative phase. This phase is where everyone piles into a euphoric attempt to ride the rally higher.
It happened in the late 1990s. It has happened again through the 2000-2005+ housing bubble. Heck, it has occurred in the collectors market over the past few decades where people spent fortunes on the "hottest items" (think Beanie-Babies) only to find out they bought at the height of the bubble.
That is why I continue to urge traders to remain cautious and to withdraw profits from this speculative rally phase. Protect your investment capital immediately and consider the risks associated with the information I share in this video.
I'm not trying to scare anyone. I'm just trying to be realistic in terms of what I see in my data and why I believe now is the best time to MOVE TO SAFETY.
My data suggests that the markets are about to enter a fragile and potentially dangerous pullback phase. If you want to ride it out - go for it.
Otherwise, prepare for significant volatility over the next six months or more.
Get some.
#trading #research #investing #tradingalgos #tradingsignals #cycles #fibonacci #elliotwave #modelingsystems #stocks #bitcoin #btcusd #cryptos #spy #gold #nq #investing #trading #spytrading #spymarket #tradingmarket #stockmarket #silver

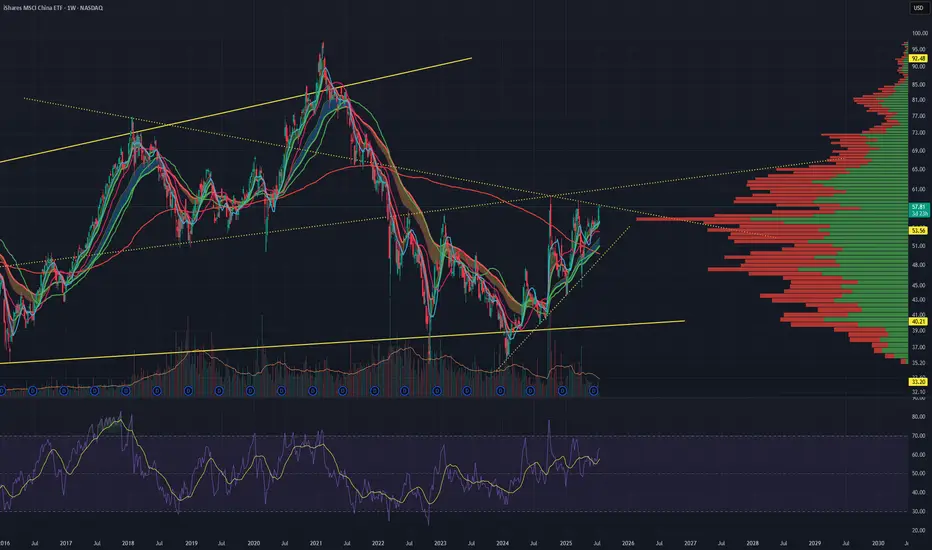
China trade deal coming? $MCHIWeekly chart shows a ton of momentum and getting over the bulk of the VRVP friction. Is there a trade deal brewing? Perhaps a black swan event of peace? Trade deal between USA/China would be a huge confluence of peace.
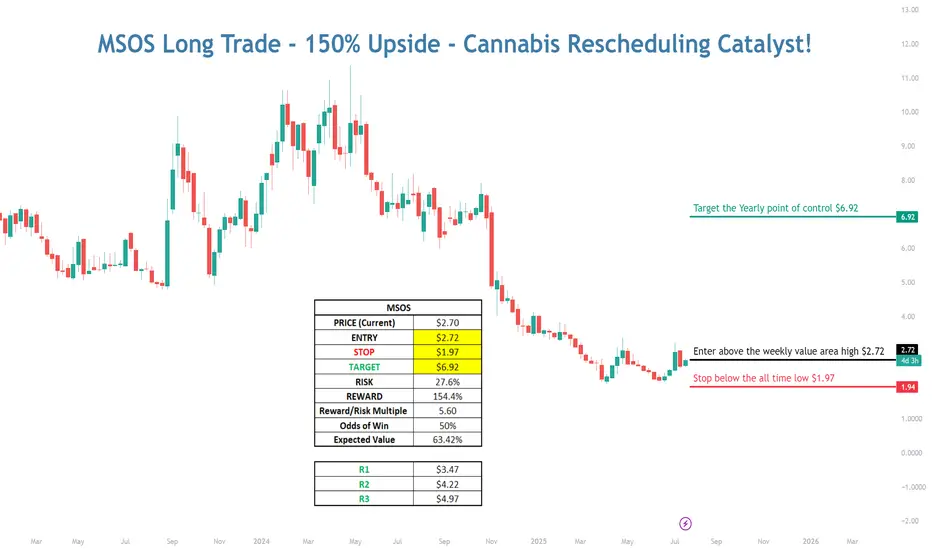
MSOS Long with 150% Upside - Cannabis Rescheduling Catalyst💠 Catalyst : Cannabis is currently classified as a schedule I drug alongside heroin, bath salts, and synthetic opioids that kill thousands every year — all while being safer than Tylenol and legal in over half the country. Cannabis is likely to be rescheduled to a schedule III drug soon after Terry Cole is confirmed as the head of the DEA. The vote to confirm him is expected to take place...TODAY
As a schedule I drug, cannabis companies can’t deduct regular business expenses for tax purposes, have limited access to banking, must transact with customers in all cash, and US multi-state operators are unable to list on the major US exchanges.
Terry Cole will be confirmed as the new head of the DEA, and when he is confirmed, the stalled process to reschedule cannabis from a schedule I to a schedule III drug should resume. If cannabis is rescheduled, that will pave the way for further research, destigmatize it, and open the door to banking and uplisting of US multi-state operators to the major exchanges in the near future.
This trade capitalizes on the fact that investors are not positioned for reform and further positive catalysts. The worst-case scenario is priced into the MSOS ETF, and when good news on rescheduling hits the tape, that should start a NEW Bull market in the MSOS cannabis stocks.
💠 Technical Setup:
Bear Market
• Multi-year bear market throughout the entire Biden administration on promises to reschedule that were never followed through on
• Capitulation when Trump won the election on the prospect of potentially another 4 years of no reform
Bearish to Bullish Technical Transition!
• LT Stage 1A Bottom Signal (Price > 50D SMA)
• ST Stage 2A Breakout (First day Price > 10D EMA and 20D SMA)
• Hourly Chart – Breaking out above Weekly Value Area
• Daily Chart – Trading above the Monthly Value Area
• Overlapping prior monthly value areas in sight!
• VPOC in sight!
• Weekly Chart – Targeting a retest of the Yearly POC
💠 Trade Plan
ENTRY: $2.72 (Break above weekly value area high)
STOP: $1.97 (Below the prior all-time-low)
TARGET: 6.92 (A retest of the yearly point of control from 2024)
RISK: 27.6%
REWARD: 154.4%
R/R Multiple: 5.6X
Probability of Win: 50%
Expected Value: 63.42%

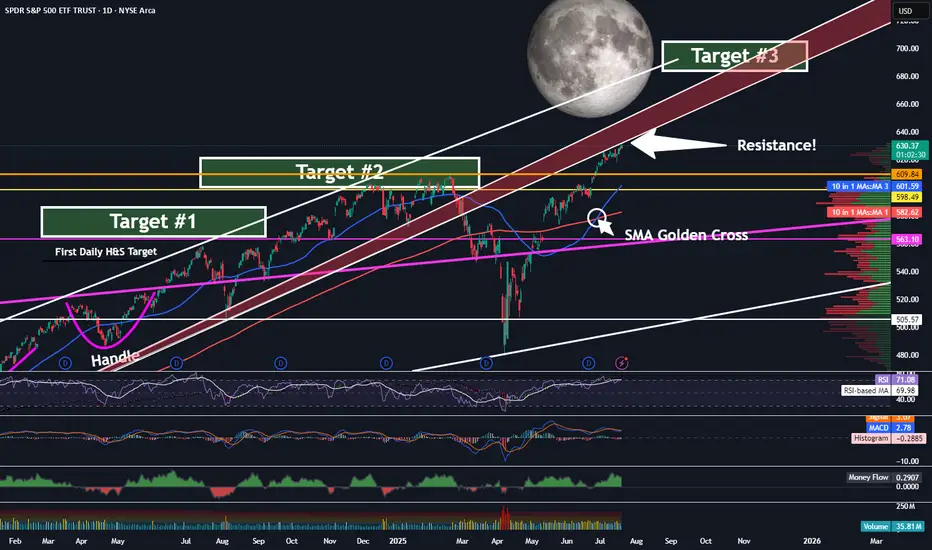
SPY - On Our Way To Target 3 ...But First?Trading Fam,
It's been a while since I updated you all on the SPY, which, as you know, we track closely to help us determine the overall market trend. Since we have now exceeded my Target #2, it's time for me to give you all another update. But first, a little context for my new readers which I have been getting a lot of recently, thanks to my new indicator hitting it out of the park.
So, we began marking targets on our chart here after spotting an inverse H&S on the daily chart a few years ago. Many of my followers back then were doubtful the pattern would fully form, or if it did, that it would actually play out. But the pattern completed about 14 months ago and subsequently broke the neckline in June of last year. I then knew we were going full send and have been predicting a 700 SPY final target since. This target has been made utilizing both that inverse H&S pattern as well as a longer-trend Elliot Wave, which I don't have denoted here at this point. The chart gets too messy with all of my markings. Regardless, we are currently in wave 5 and heading steadily towards that 670-700 target #3, my final target.
But be careful! Today, we have hit the underside of that RED area, which is HUGE resistance. I would expect that we will NOT break straight through this without some pullback prior. Indeed, the market is overextended at this moment, and we'll need the volume to be able to push through. Could this occur? Of course, anything is possible. But, it is not likely right now.
My guess is that we'll at least pull back to one of those levels below us or possibly even re-touch that 200 SMA in red before the final push.
Anyways, it is worth taking note of what may be ahead of us in the next few weeks or months so that you can plan your trades accordingly. Stay with me. We're almost there.
✌️Stew
MSOS Long with 150% Upside - Cannabis Rescheduling Catalyst💠 Catalyst: Cannabis is currently classified as a schedule I drug alongside heroin, bath salts, and synthetic opioids that kill thousands every year — all while being safer than Tylenol and legal in over half the country. Cannabis is likely to be rescheduled to a schedule III drug soon after Terry Cole is confirmed as the head of the DEA. The vote to confirm him is expected to take place...TODAY
As a schedule I drug, cannabis companies can’t deduct regular business expenses for tax purposes, have limited access to banking, must transact with customers in all cash, and US multi-state operators are unable to list on the major US exchanges.
Terry Cole will be confirmed as the new head of the DEA, and when he is confirmed, the stalled process to reschedule cannabis from a schedule I to a schedule III drug should resume. If cannabis is rescheduled, that will pave the way for further research, destigmatize it, and open the door to banking and uplisting of US multi-state operators to the major exchanges in the near future.
This trade capitalizes on the fact that investors are not positioned for reform and further positive catalysts. The worst-case scenario is priced into the MSOS ETF, and when good news on rescheduling hits the tape, that should start a NEW Bull market in the MSOS cannabis stocks.
💠 Technical Setup:
Bear Market
• Multi-year bear market throughout the entire Biden administration on promises to reschedule that were never followed through on
• Capitulation when Trump won the election on the prospect of potentially another 4 years of no reform
Bearish to Bullish Technical Transition!
• LT Stage 1A Bottom Signal (Price > 50D SMA)
• ST Stage 2A Breakout (First day Price > 10D EMA and 20D SMA)
• Hourly Chart – Breaking out above Weekly Value Area
• Daily Chart – Trading above the Monthly Value Area
• Overlapping prior monthly value areas in sight!
• VPOC in sight!
• Weekly Chart – Targeting a retest of the Yearly POC
💠 Trade Plan
ENTRY: $2.72 (Break above weekly value area high)
STOP: $1.97 (Below the prior all-time-low)
TARGET: 6.92 (A retest of the yearly point of control from 2024)
RISK: 27.6%
REWARD: 154.4%
R/R Multiple: 5.6X
Probability of Win: 50%
Expected Value: 63.42%
SPY: Climbing the Wall of Worry — But Is a Turn Coming?SPY: Climbing the Wall of Worry — But Is a Turn Coming?
The S&P 500 (SPY) is pushing into a critical zone as we approach July 28th, and I can’t ignore the confluence of signals piling up here.
Technical Setup
We’re testing the top of a rising wedge formation.
Key round number overhead at $640 — a psychological and options magnet.
Price is extended well above moving averages with declining volume, often a warning sign for bulls.
Multiple resistance lines converge in this zone, creating a high-pressure point.
📆 Timing Matters
July 28 = weekly options expiry — with massive open interest clustered around $630–$640.
Seasonally, late July often marks a peak before August chop.
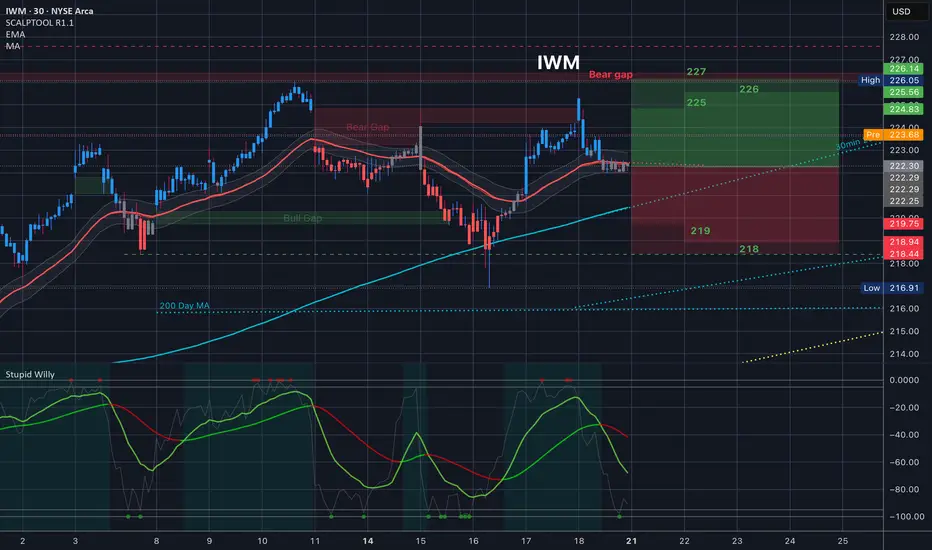
Add in some “tin foil hat” vibes: SPY’s riding momentum while major indices are diverging (looking at you, IWM), and the macro narrative feels shaky at best.
What Would Confirm a Reversal?
Breakdown below $625 with a high-volume red candle.
Bearish engulfing or shooting star candle near resistance.
VIX divergence or big money flowing into puts mid-week.
Key Levels
Resistance: $640 / $649.90
Support: $630 / $622 / $595
Reversal target (if confirmed): $594–$575 area
Final Thoughts
As we all know, markets can stay irrational longer than you can stay solvent. However, when trendlines, round numbers, timing, and seasonality align, I start watching for cracks. This may not be the top — but it might be the spark.
Following closely. Alerts set. Ready for the flush if it comes.

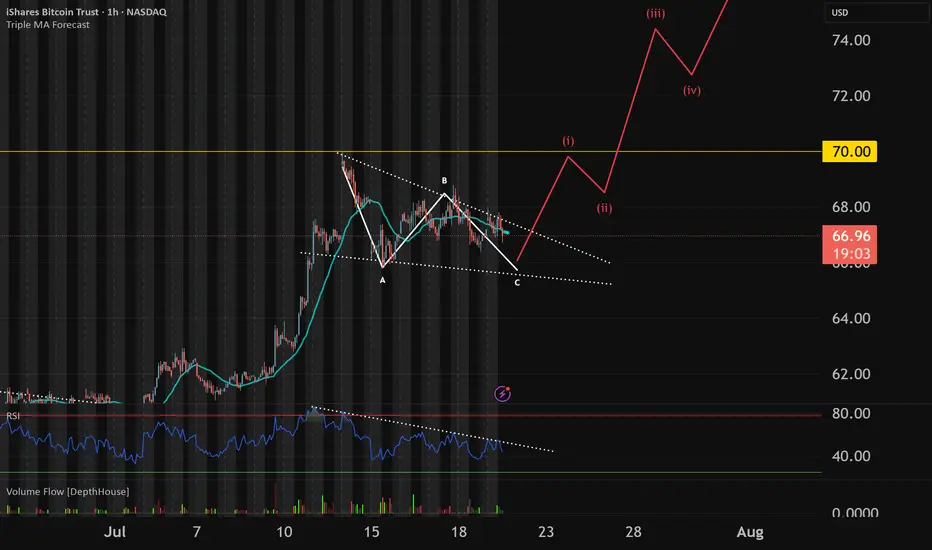
IBIT finishing C wave before next leg upIBIT is following an ABC correction after creating a new ATH. Crypto market has been hitting ATH in market value and ETH/alts have been expanding upwards as BTC has stalled which shows a rotation from large caps to rest of the market. This indicates a bull market cycle and we will be looking for a Euphoric BTC new ATH before a top is made. This is a dip to buy and will load up some more IBIT options on red days this week
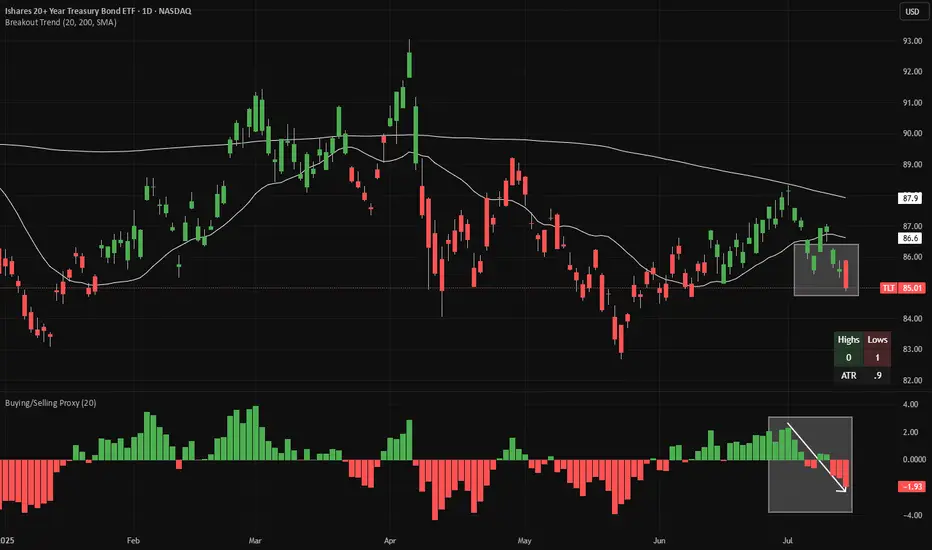
TLT short - warning signs from JapanTLT is making 20-day lows (red candles in the main chart), while continuing to make 20-week lows on a weekly chart (not shown). Meanwhile, looking at a proxy of net buying/selling (bottom panel), we have flipped from buying to selling.
Looking at Japanese bond yields, 10-year JGBs (JP10Y) just broke out of tight range. This is the third attempt to trade above ~1.59% recently, which we saw earlier today. As Japan's is one of the world's leading overseas investors, this is an obvious warning sign for bonds globally.
There is good risk/reward to short bonds here, with a stop-loss if the price closes at a 20-day high. If a 20-day high is made, the candles will change color from red to green.
Both indicators (Breakout Trend and Buying/Selling Proxy) are available for free on TradingView.
$DIA Trading Range for 7.21.25 and everything in itThis is the trading range for the week and everything in it. How are you playing it?

$IWM Trading Range for 7.21.25 and everything in itToday’s Trading range and everything in it. How are you playing it?
$QQQ Trading Range for 7.21.25 and everything in itToday’s Trading range and everything in it. How are you playing it?

$SPY Trading Range for 7.21.25 and everything in itToday’s Trading range and everything in it. How are you playing it?
