SPY July 21-25AMEX:SPY
Looking at the 4 hr. timeframe on SPY. Bearish divergence is signaling a need for some cool off. I assume this will happen almost immediately, Monday maybe into Tuesday. I expect to keep above strong support levels at 618 and 609.95. Drops below 609 will change my stance to a more bearish tone. assuming we hold these levels, I expect that SPY will continue upward after some small consolidation up here in the range. Looking at a trend-based fib, some price points to the upside above ath's(all time highs) would be 633.52 and 637.85. Even 654.
Economic and policy fundamentals could shift any bullishness into another sharp pullback or even up into higher price targets.
Not much to be bearish abut this week, earnings season is kicking off and this could play a role as well; Tesla and google & blue chips happening Tuesday- Thursday.
These earnings could be the mystery seasoning to shake up this week's movement.
ETF market

$QQQ this might the spot. Hello and good night, evening, afternoon, or morning wherever you may be. I have been looking at names all day and I wanted to check the indexes: NASDAQ:QQQ and $SPY.
Here we have the indexes up almost 30% from the April lows and sitting about 10% YTD. The candle highlighted is the spinning stop candle and has volume to match. These candles usually take place (green or red) in downtrends or uptrends and provide pivotal indication. The market has major earnings this week (07/21/2025 to 07/25/2025) with names like Google, Tesla, General Dynamics, Verizon, Domino’s And so forth.
This week could be a catalyst to see some great volatility. I believe staying 3% from moving averages so I have noted 3.5% from the 50EMA and revisiting the 20EMA and 21EMA in the low $550 area. My target is $553 which is only a 1.4% move which can happen in one session in this environment while staying 3.5% above the 50EMA.
My trade idea will be $553p for 07/25/2025. Good luck!
WSL

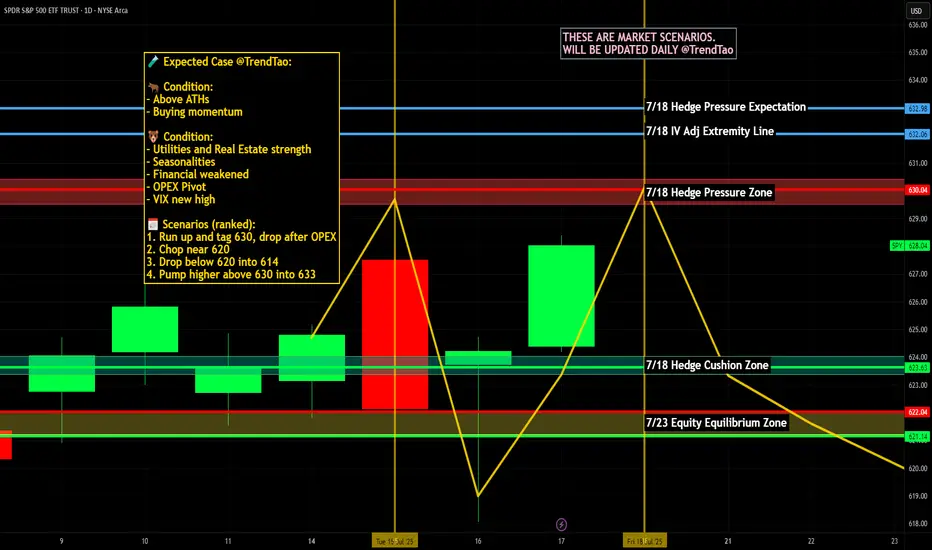
Weekly $SPY / $SPX Scenarios for July 21–25, 2025🔮 Weekly AMEX:SPY / SP:SPX Scenarios for July 21–25, 2025 🔮
🌍 Market-Moving News 🌍
🏦 Fed Chair Powell Speaks — Markets Key Into Tone
Federal Reserve Chair Jay Powell’s Jackson Hole speech is the week’s centerpiece. Markets will be closely listening for clues on inflation strategy, rate-cut timing, and sensitivity to geopolitical inflation drivers like tariffs.
📦 Tariff Deadlines Gain Spotlight
Multiple tariff deadlines are set this week for targeted trade partners including the EU, Mexico, Canada, Japan, South Korea, and Thailand. Any new announcements or extensions could trigger volatility in trade-exposed sectors.
🛢️ Oil Market Mixed Signals
Brent crude prices have stabilized near mid-$70s, but OPEC+ discussions regarding supply extensions and global growth concerns continue to inject uncertainty into energy-linked equities.
📈 Big Tech Earnings Kick Off
The “Magnificent Seven” tech giants begin reporting: Nvidia leads on Tuesday, followed by Microsoft, Amazon, Alphabet, and Meta later in the week. Expect significant sentiment swings based on forward commentary.
📊 Key Data Releases & Events 📊
📅 Monday, July 21
Quiet session ahead of a packed week of speeches and data.
📅 Tuesday, July 22
8:30 AM ET – Existing Home Sales (June):
Measures signed contracts on previously owned homes—a key housing indicator.
After Market Close – Nvidia Q2 Earnings:
Market will watch guidance and China commentary.
📅 Wednesday, July 23
8:30 AM ET – Leading Economic Indicators (June):
An early gauge of U.S. economic momentum.
📅 Thursday, July 24
8:30 AM ET – Initial & Continuing Jobless Claims:
Labor-market health indicator.
📅 Friday, July 25
8:30 AM ET – Durable Goods Orders (June):
Signals demand for long-lasting goods, often driven by business spending.
8:30 AM ET – New Home Sales (June):
Follows existing home data for housing sector insight.
4:00 PM ET – Fed Chair Powell Speech at Jackson Hole:
Expect commentary on inflation, growth, and rate-path clarity.
⚠️ Disclaimer:
This content is for educational and informational purposes only and should not be construed as financial advice. Consult a licensed financial advisor before making investment decisions.
📌 #trading #stockmarket #economy #Fed #earnings #housing #durablegoods #JacksonHole #technicalanalysis


Double Bull Flags on an Ascending Triangle breakout on the dailyDaily, double Bull Flag, on top of an Ascending Triangle Breakout. Golden Pocket on the Fib Ext is $588 🥂

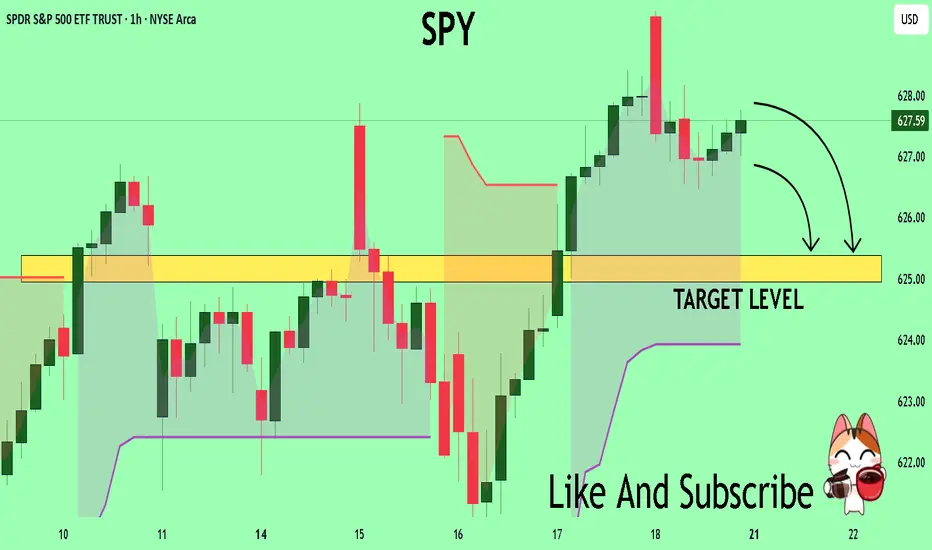
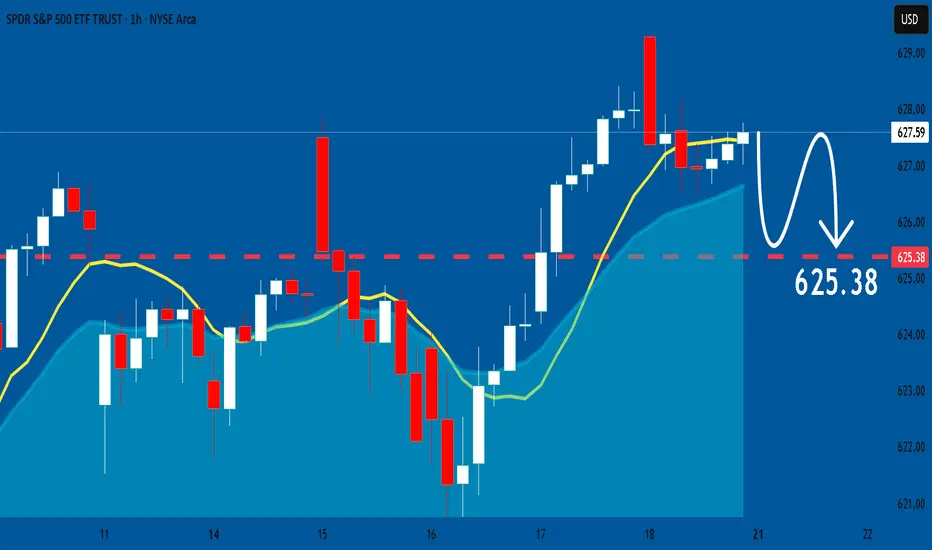
SPY What Next? SELL!
My dear friends,
Please, find my technical outlook for SPY below:
The instrument tests an important psychological level 627.59
Bias - Bearish
Technical Indicators: Supper Trend gives a precise Bearish signal, while Pivot Point HL predicts price changes and potential reversals in the market.
Target - 625.38
About Used Indicators:
Super-trend indicator is more useful in trending markets where there are clear uptrends and downtrends in price.
Disclosure: I am part of Trade Nation's Influencer program and receive a monthly fee for using their TradingView charts in my analysis.
———————————
WISH YOU ALL LUCK
hihiThe convergence of artificial intelligence and decentralized finance presents a paradigm shift in global economic systems, where algorithmic governance, autonomous agents, and smart contracts could redefine trust, efficiency, and access. This fusion offers transformative potential but raises critical ethical, regulatory, and socio-technical challenges demanding interdisciplinary exploration and resilient systemic safeguards.
Ask ChatGPT
COW : Daily Chart : Multiple Price Action ExamplesThere is a large bull flag.
Then toward its maturation the tweezer pattern forms to confirm the large flag.
Then there is now the Follow-Up after a tweezer which is looking nice.
I would now buy the break higher and follow it up to the left there is green wicks leading the way.
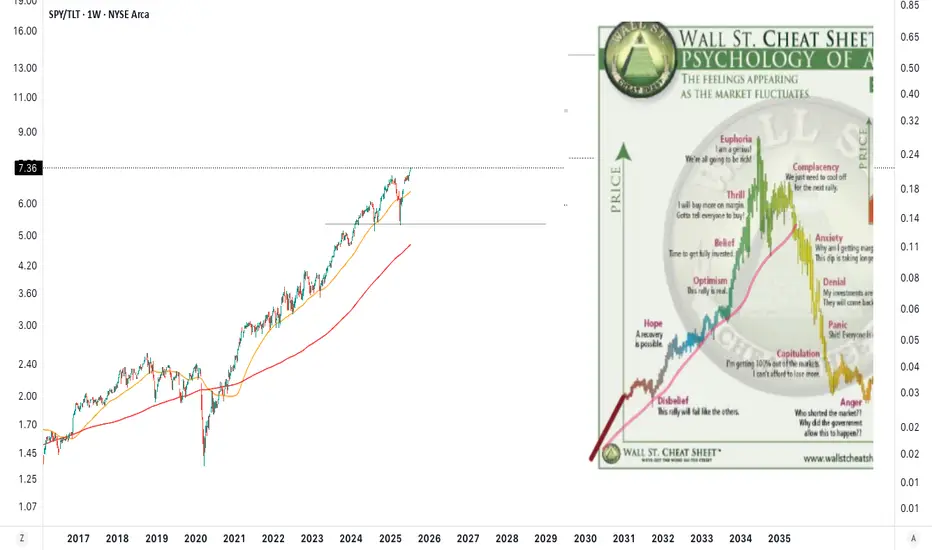
Possible Scenario for the Bond FundSimply took a previous move the Bond Fund already made, and inverted it, copy pasted and voila. It has already happened before

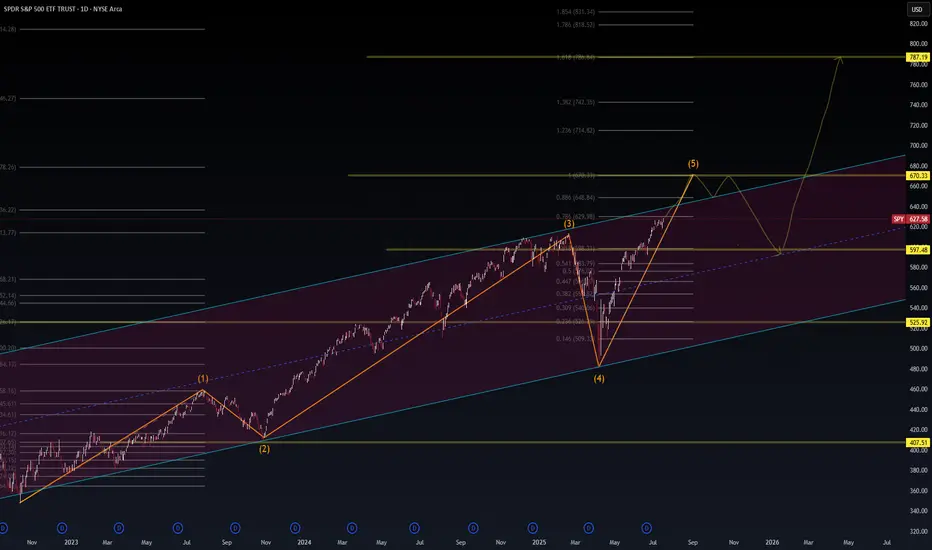
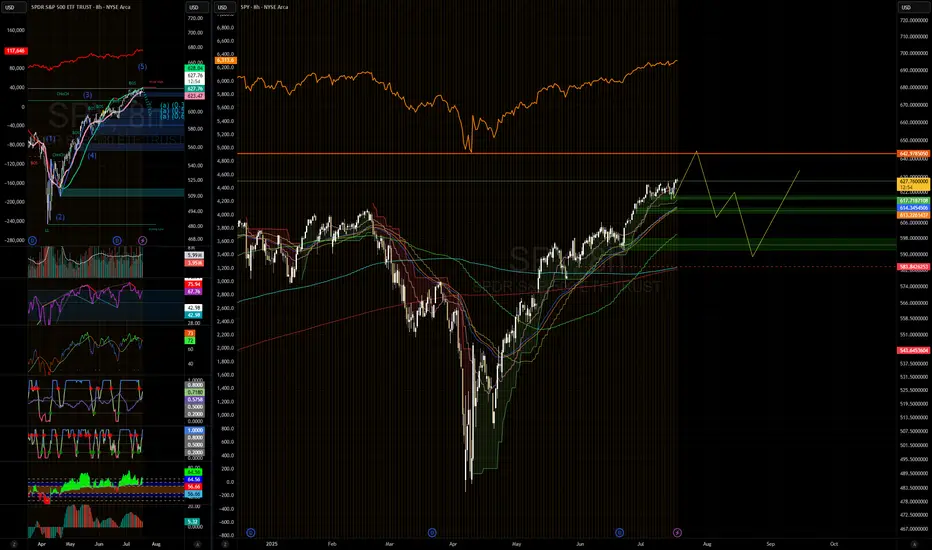
SPY Macro Wave Outlook – Bullish Fifth Wave into AI Supercy📈 SPY Macro Wave Outlook – Bullish Fifth Wave into AI Supercycle?
🧠 WaverVanir DSS | VolanX Protocol | Institutional AI Alignment
The SPY rally appears to be unfolding within a 5-wave macro impulse, currently inside Wave (5) targeting the 670–787 zone, depending on macro alignment and Fed behavior. This structure converges with long-term Fibonacci clusters and macro transition signals.
🔍 Thesis:
Wave (5) in Progress – Next resistance seen at ~670.33, followed by long-term targets near 787.19.
Pullback Scenario – A temporary correction into the 597–600 range is possible before further upside.
Structure Validity – Channel and Fibonacci extensions confirm bullish continuation unless macro conditions deteriorate sharply.
🧠 Macro Alignment Required:
Fed Pivot Late 2025 → Probability: 60%
Earnings Growth Led by AI → 11% projected for S&P500 (GS)
Productivity > Consumption → AI-led industries showing 5%+ labor productivity growth (Dallas Fed)
Low Inflation Reacceleration Risk → Core PCE stabilization key
⚠️ Risk Matrix:
Macro Risk Probability Notes
Fed Hawkish Reversal 30% Data-dependent but unlikely unless inflation re-flares
AI Concentration Shock 25% Tech-heavy rally, breadth remains a concern
Valuation Compression 20% Shiller CAPE near 37
Trade War Reignition 15% Tariff risk remains a geopolitical tail
🎯 Target Zones:
Near-term: 670.33 (Wave 5 peak)
Medium-term: 714–787 (Fib clusters)
Correction Zone: 597–600, invalidation below 525
The AI economy is accelerating—productivity is now outpacing consumption in several sectors. This macro regime shift could be the foundation for the next secular bull wave.
🔺 Powered by VolanX Protocol
⚠️ Not financial advice. Educational chart generated by institutional DSS models.
#SPY #VolanX #WaverVanir #ElliottWave #MacroTrading #AIProductivity #Fibonacci #FedPivot #USEquities #TradingSignals #SmartMoneyConcepts #InstitutionalStrategy #AIInvesting #SP500
SPY: Week of Jul y21stPosting an idea on SPY against better judgement.
Its a mess of an index but here is my attempt at an analysis with this trainwreck, haha.
Best of luck, safe trades and take care!

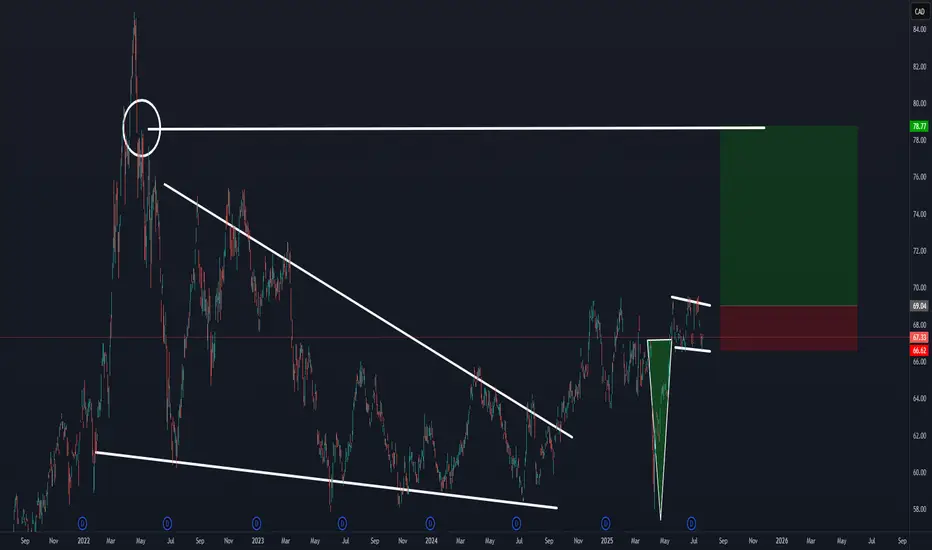
NEVER GO FULL..... GOLD EUPHORIAGOLD EUPHORIA HAS GONE FULL CYCLE — AND THAT MAKES ME NERVOUS
There was a time not too long ago when uttering the word gold in financial circles would elicit smirks, eye-rolls, or worse — instant dismissal. Between 2014 and 2019, the mere suggestion of accumulating physical bullion or positioning in junior miners like GDXJ was treated as a form of ideological extremism. You were either a doomsday prepper, a Ron Paul groupie, or a relic yourself — a “pet rock” clinger, waiting for a catastrophe that the Fed’s digital printing press would forever keep at bay.
But fast-forward to mid-2025, and gold isn’t just back — it’s fashionable. That should terrify you.
Suddenly, everyone sees it. Systemic fragility. Fiscal nihilism. The slow, nauseating decay of the dollar’s purchasing power. Even the “trust-the-Fed” technocrats and QE-forever interventionists are parroting the same doomsday lingo they spent a decade mocking. Now, they’re loading up on precious metals, layering macro doom threads on Twitter, and waxing poetic about Bretton Woods III. The same institutions that branded you a lunatic for shorting the Treasury complex in 2020 are now publishing breathless gold forecasts and endorsing BRICS currency chatter like it’s gospel.
When the gold trade starts getting consensus nods from CNBC anchors and Brookings fellows, something has changed. And not for the better.
Take a look at the VanEck Junior Gold Miners ETF (GDXJ) — the quintessential proxy for speculative precious metals froth. From its late-2024 bottom near $40, it rocketed to over $72 by June 2025 — a near-80% vertical melt-up in seven months. The volume on that ascent was substantial, no doubt, but what’s come since is even more telling. We’ve now got three weeks of topping candles, declining volume, and a weekly close this Friday at $66.19, down nearly 4% on the week. Support at $65 is teetering, and the next real floor sits closer to $60 — the prior breakout zone.
Technically, it smells like distribution. Psychologically, it reeks of complacency.
Call it the Minsky moment of the gold trade. Stability breeds instability. And nothing screams instability like a former pariah asset becoming a near-universal safe haven consensus play, right as speculative capital piles in at nosebleed valuations.
This isn’t a call on gold’s long-term validity — far from it. The monetary rot is real. The fiat debasement is mathematically terminal. And the entire global sovereign debt pile is one rate shock away from implosion. But markets don’t move in straight lines. Especially not when everyone is suddenly on the same side of the boat, citing the same macro talking points they ridiculed five years ago.
I’ve been here before. I remember accumulating metal when it was hated — not merely unloved, but reviled. Back when CPI read 0.2% and the Fed pretended it could tighten. Back when nobody knew what an SDR was and gold bugs were caricatured as paranoid survivalists waiting for a return to the gold standard. That was value. That was accumulation.
What we have now is a FOMO-soaked crescendo, where even the Keynesians are starting to sound like Austrian-school newsletter writers.
So yes, I’ve sold into this rally — at least the speculative tranche. I’ve taken gains in miners, trimmed the GDXJ fat, and built a list of bear-side entries for what I think is the inevitable correction. Because when the least-likely characters start echoing your thesis word-for-word, it’s time to reassess your positioning.
This doesn’t mean the dollar survives. It doesn’t mean the Fed has regained credibility. It simply means markets are reflexive — they overshoot in both directions. And when the gold trade becomes saturated with latecomers who believe the dollar dies tomorrow and the DXY is going to 40 in a straight line, the odds of a savage retracement increase tenfold.
I remain a long-term gold bull. But right now? The fever is high. The crowd is euphoric. And in markets, that’s when gravity tends to do its finest work.
Chart Notes:
Weekly candle closed at $66.19, down -3.85%.
Resistance: $72.00.
Immediate support: $65.00.
Stronger support zone: $60–61.
Weekly volume: 16.86M, with signs of declining momentum.

Stock Market Forecast | TSLA NVDA AAPL AMZN META MSFTStock Market Forecast | CME_MINI:NQ1! CME_MINI:ES1!
Mag 7 Forecast | NASDAQ:TSLA NASDAQ:NVDA AAPL AMZN META MSFT GOOG

AGQ - LongAGQ
Well if this chart is any kinda indicator, it would suggest going up.
I have been long silver for a little while. All precious metals.
I like the potential.
thanks

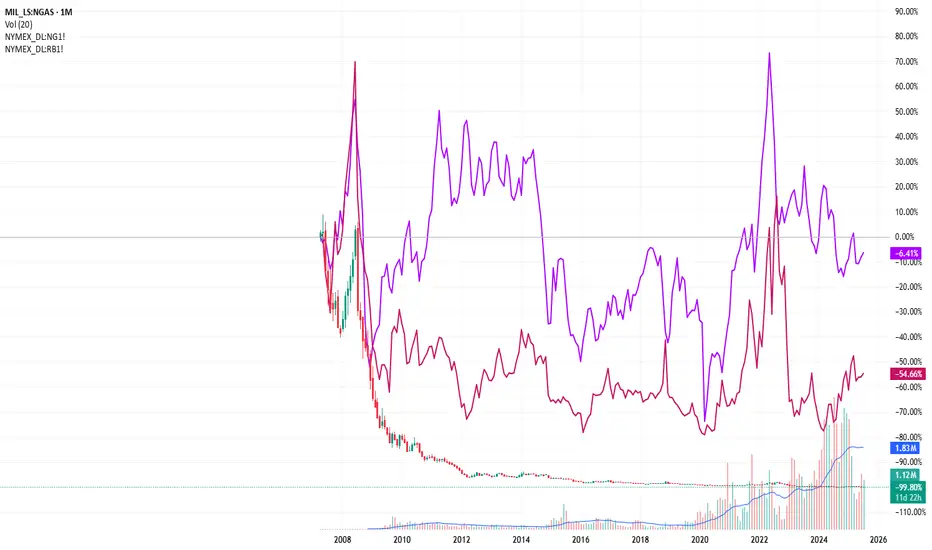
NGAS vs henry hub & rbob - basement levelswill the ngas always remain so low?
with the huge run up of natural gas prices, the stocks have already run 10x. If you are too late to the party there are etfs such as NGAS that are at basement levels that have historically tracked against the gas futures
SPY: Market of Sellers
Our strategy, polished by years of trial and error has helped us identify what seems to be a great trading opportunity and we are here to share it with you as the time is ripe for us to sell SPY.
Disclosure: I am part of Trade Nation's Influencer program and receive a monthly fee for using their TradingView charts in my analysis.
❤️ Please, support our work with like & comment! ❤️
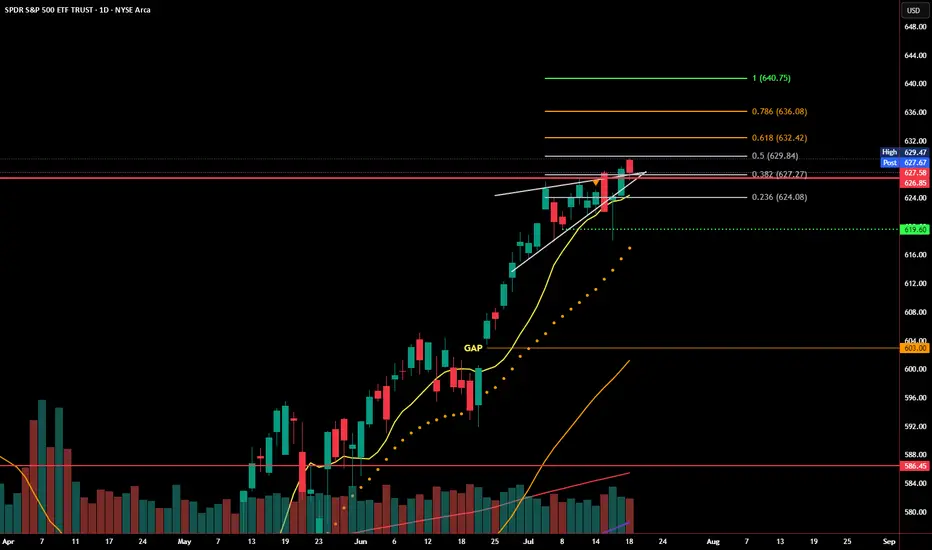
SPY Reclaims Rising Wedge Support - Bear Trap or Breakout Setup?SPY dropped below its rising wedge earlier this week, but that move may have been a bear trap. Price quickly reversed, reclaiming the wedge trendline and closing just below a key Fibonacci level at 629.84.
Buyers stepped in aggressively near the 0.382 and 0.236 retracement zones, defending short-term support. The bounce came on increased volume, signaling strength behind the recovery. Momentum remains intact as long as SPY holds above 626.
Now, bulls need to confirm with a breakout above 629.84–631.96 to open the door to the next levels at 635.63 and 640.30. Failure to break through could lead to another rejection and revisit lower support zones.
Levels to watch:
Support: 626.64, 623.62, 619.60
Resistance: 629.84, 631.96, 635.63
SPY is at a decision point. Reclaiming wedge support is a bullish signal, but bulls need follow-through to avoid another fakeout in the opposite direction.
Opening (IRA): SPY August 15th 490 Short Put... for a 5.00 credit.
Comments: Laddering out, targeting the strike paying around 1% of the strike price in credit ... .
Will generally look to roll up to the shortest duration <16 delta strike paying 1% of the strike price if in profit.

Earnings Heat Up - 6300 and 6200 SPX Key Levels RemainMarket Update
SPX Key Levels
-SPX poked 6300 Tuesday, Thursday, and poked higher Friday (but settled back to 6300)
-6200 support remains a key level
-6050/6000/5800 next floor levels, I'll be looking for dips
I can see the market slowly (and I mean SLOWLY) grinding higher but preparing for a
reasonable seasonal selloff through end of July into end of September window
July 28-August 1 is a monster week in the markets
-Megacap Earnings (MAG7 Tue/Wed/Thu)
-Wed July 30 - FOMC (Pause expected but Powell's Press Conference is important)
-Friday August 1 - Non-Farm Payroll, Tariff Deadline
I'm hitting fresh YTD highs so I'm not complaining about this melt-up and grind, I'm simply wanting to allocate positions and add to my positions at better levels and with a slightly
higher VIX to help take advantage of the expected move being greater than the actual move
Have a great weekend and thank you watching!!!

SPY risk on for a few weekslooks like we are still moving up (SPX 6,400-6,500) but the risk to a correction is increasing.
FOMO phase on meme stock. so still profit to be had
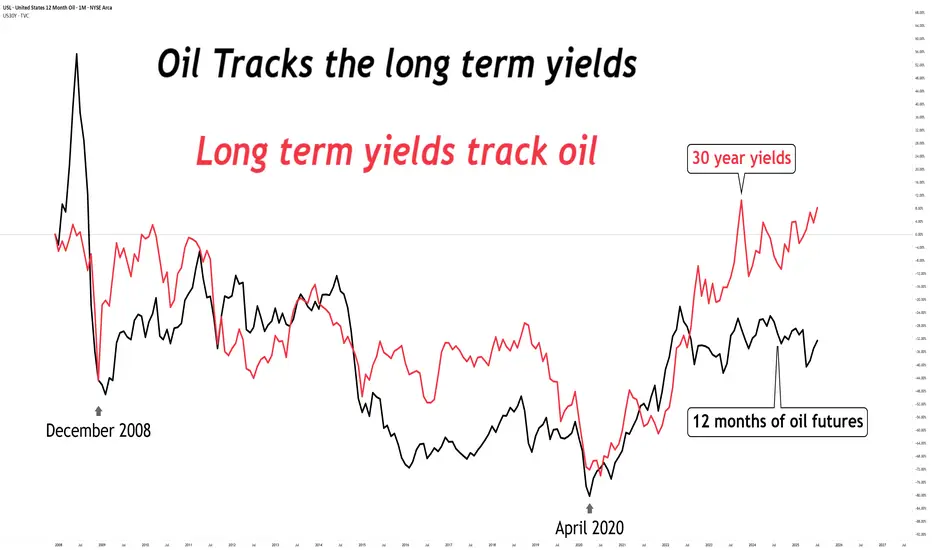
Oil tracks yields (or vice-versa)Looking at this chart...
Where do you think oil & long term yields are going?
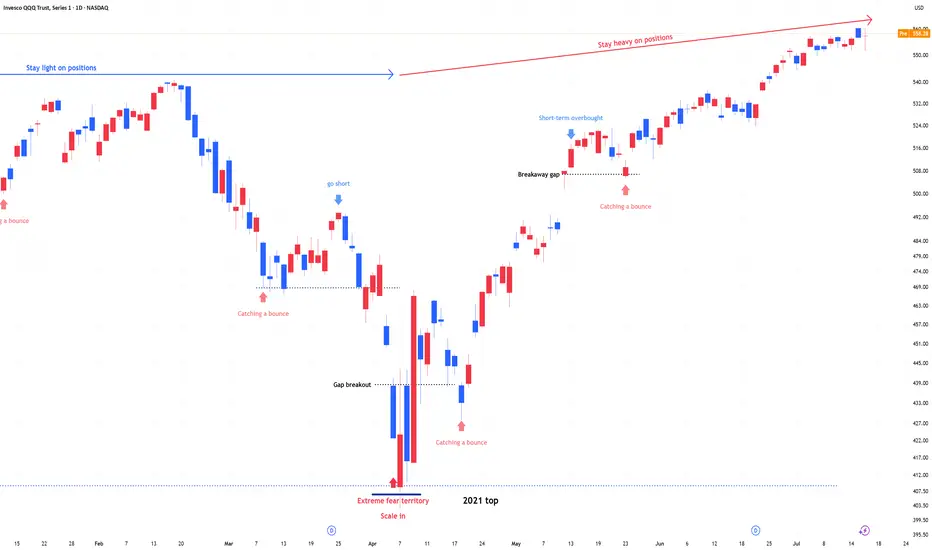
QQQ : Stay Heavy on Positions1) April Fear & Buy Signals
In early April, the Nasdaq 100 experienced a sharp sell-off, triggering extreme fear sentiment across the market.
At that point, scale-in buy signals appeared—classic "buy the fear" conditions.
2) Current Market State: No More Fear, but Watching
Since then, the market has stabilized.
The fear has disappeared, but we are still in a wait-and-see mode as traders assess the next move.
Momentum is holding, but participation remains cautious.
3) Stay Heavy on Positions
Despite short-term uncertainty, I’m maintaining an overweight position on the Nasdaq 100.
As long as we don’t see a major breakdown, the bias remains bullish.
Nightly $SPY / $SPX Scenarios for July 19, 2025🔮 Nightly AMEX:SPY / SP:SPX Scenarios for July 19, 2025 🔮
🌍 Market-Moving News 🌍
🏢 U.S. Corp Buybacks Set to Propel Stocks
Citadel Securities expects U.S. companies to repurchase roughly $1 trillion of stock in 2025. With the blackout period ending in August, buybacks—historically strong in July, the stock market’s best month—could bolster valuations
⚖️ Fed Independence Debate Intensifies
President Trump’s continued criticism of Chair Powell has already weakened confidence in Federal Reserve autonomy. The fallout shows up in a weaker dollar, elevated Treasury yields, and rising inflation expectations—though stocks have remained resilient
🇺🇸 Immigration Rollback Sparks Economic Concern
The rescinding of Temporary Protected Status for ~900,000 immigrants could remove up to 1.1 million workers from the labor force. Analysts warn of potential stagflation risks, with GDP growth potentially down 0.3–0.4 percentage points and labor-market tightening ahead
💵 Massive T-Bill Issuance Incoming
Following the debt-ceiling deal, the Treasury plans over $1 trillion in T-bill issuance in the next 18 months. Money-market funds are expected to absorb much of it, influencing short-term rates and cash-market dynamics
📊 Key Data Releases & Events 📊
📅 Friday, July 19:
8:30 AM ET – Initial Jobless Claims
Weekly figure on new unemployment filings—a real-time indicator of labor-market resilience.
8:30 AM ET – Existing Home Sales (June)
Measures signed contracts on previously owned homes; key for gauging housing-market health.
All Day Events:
Ongoing corporate buybacks entering open window
Treasury auctions and T-bill issuance updates
⚠️ Disclaimer:
This information is for educational and informational purposes only and should not be construed as financial advice. Always consult a licensed financial advisor before making investment decisions.
📌 #trading #stockmarket #economy #monetarypolicy #debt #housing #labor #technicalanalysis