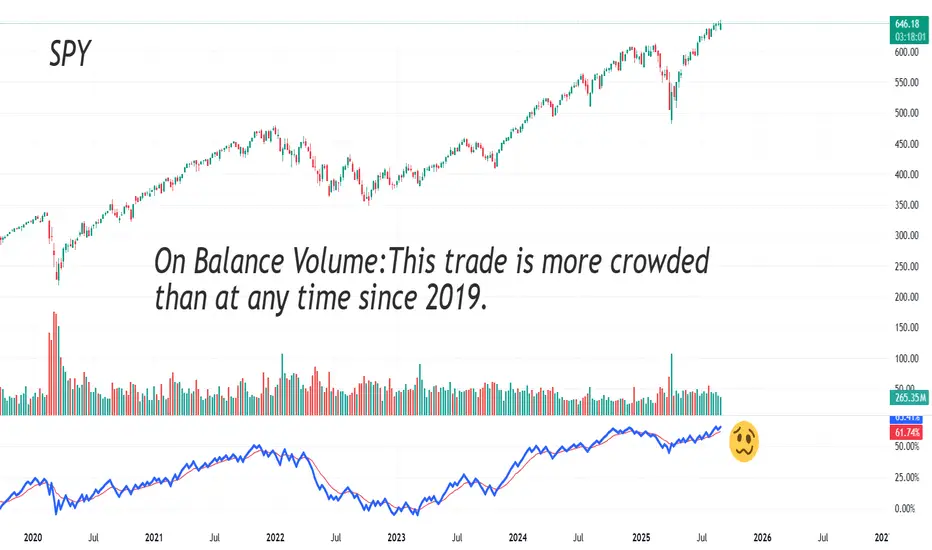
This trade is more crowded than at any time since 2019.On-balance volume keeps rising, but at a slowing pace. Along with a small bearish divergence, this shows few new entrants. Still, they’re all bullish. And if you look at the OBV level, this trade has never been so crowded since, at least, 2019.
The market can stay irrational longer than… yes, we all know the line. But when this one falls, it will look like a giant avalanche.
ETF market
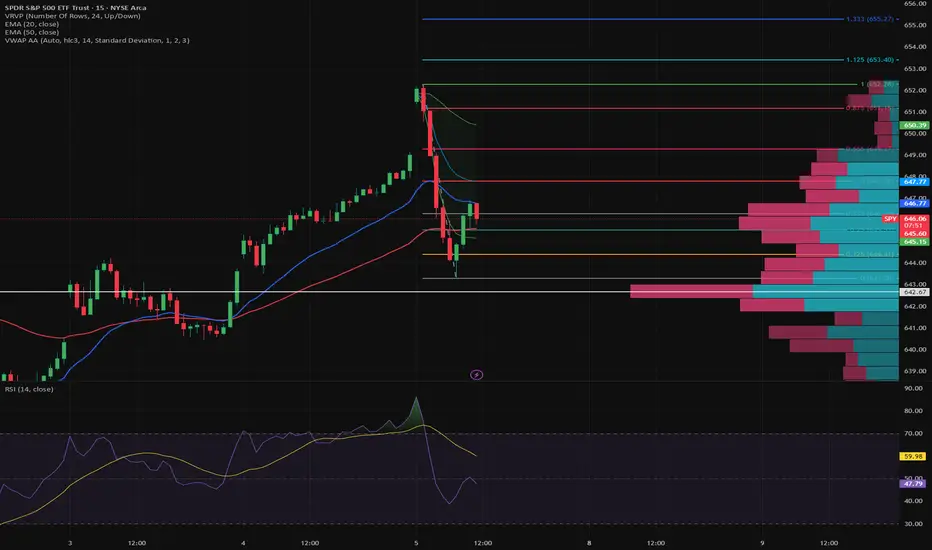
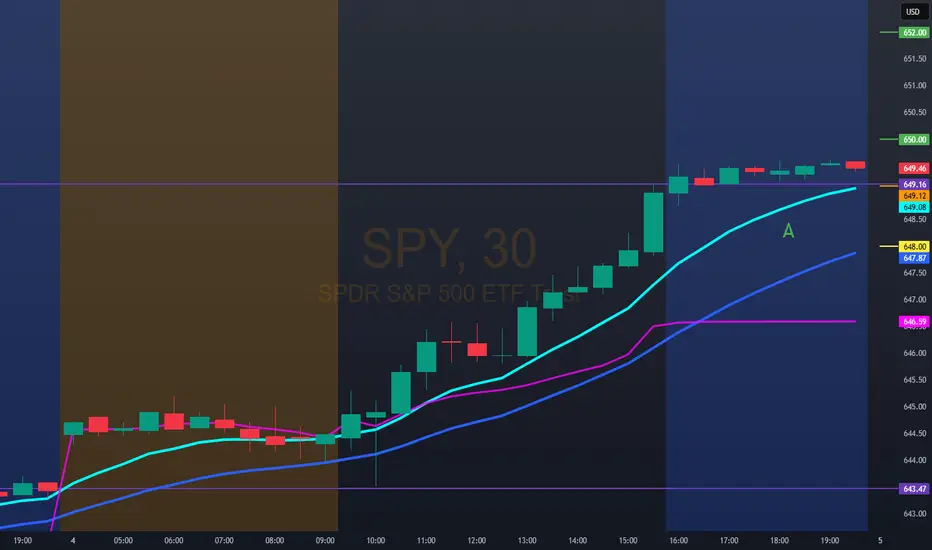
$SPY Intraday ResistanceThere is thick diatonic resistance right below VWAP at 647.85. Next diatonic level above will be 649's.
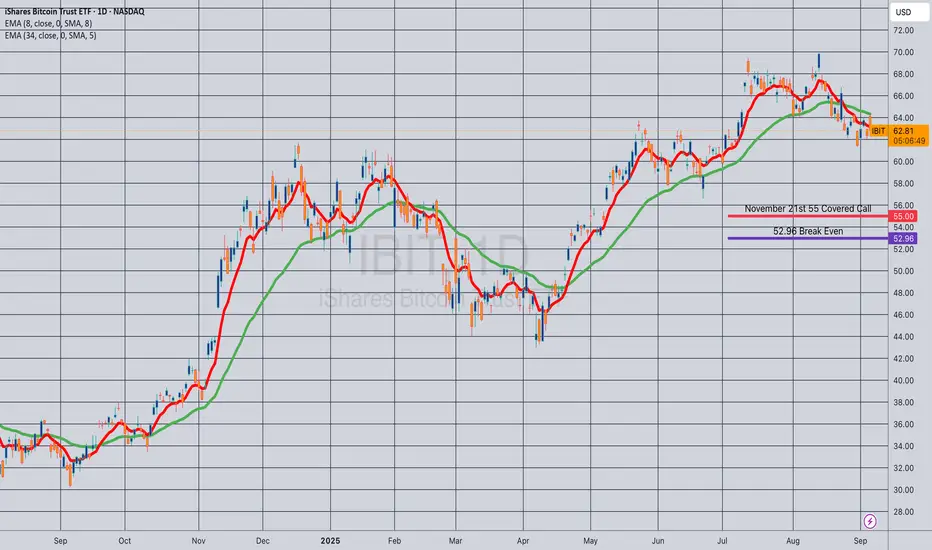
Opening (IRA): IBIT November 21st 55 Monied Covered Call... for a 52.96 debit.
Comments: Slowly building a position. Would've preferred a down day, but can't have everything. Selling the -75 delta call against shares to emulate the delta metrics of a 25 delta short put, but with the built-in defense of the short call and to take advantage of higher call side IV.
Metrics:
Buying Power Effect/Break Even: 52.96
Max Profit: 2.04 ($204)
ROC at Max: 3.85%
50% Max: 1.02 ($102)
ROC at 50% Max: 1.93%
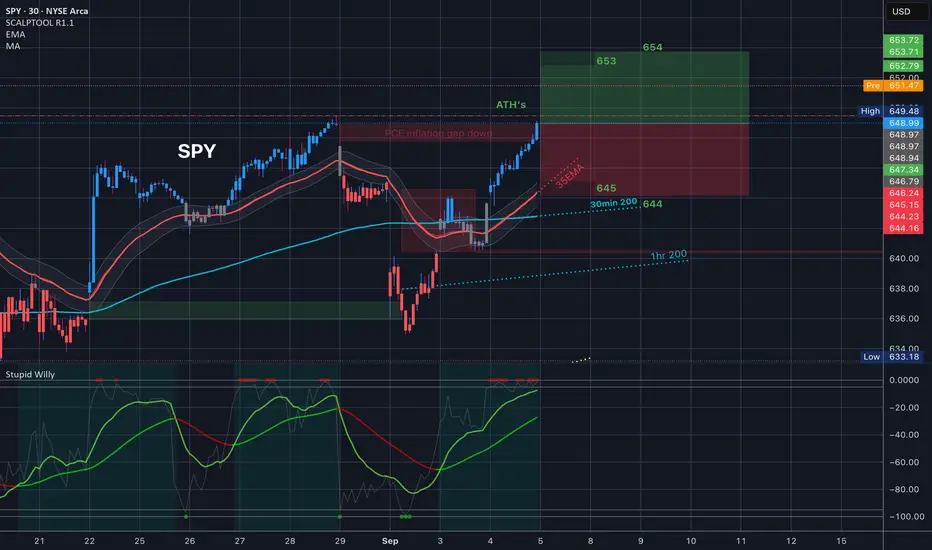
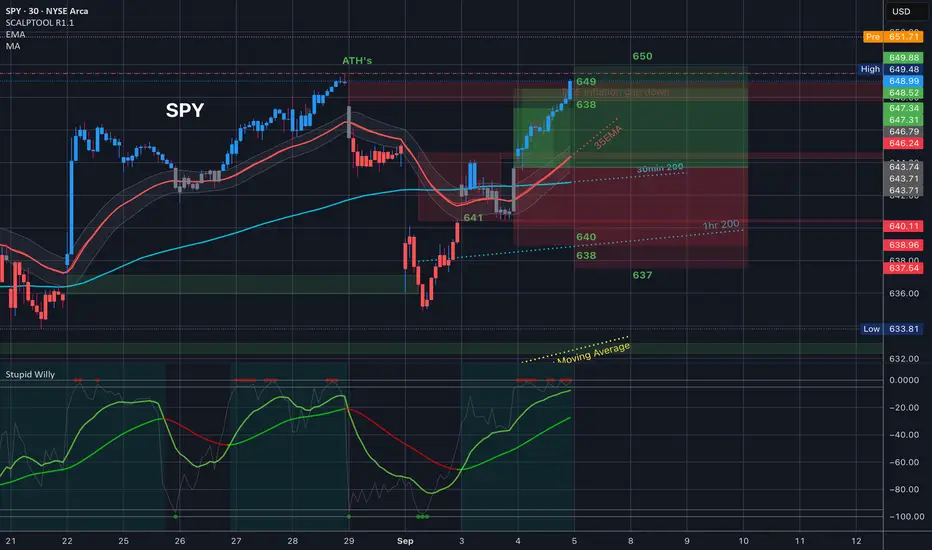
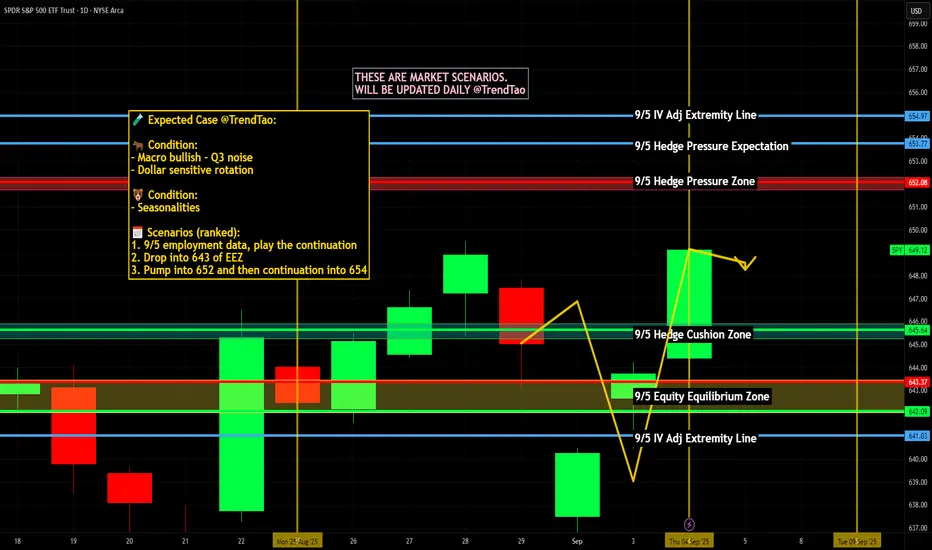
$SPY $SPX Analysis, Key Levels & Targets 9.5.25
Alright, the only two levels in todays range are the 35EMA and ATH’s. Always know where the 35EMA is - its a magnet. Let’s go
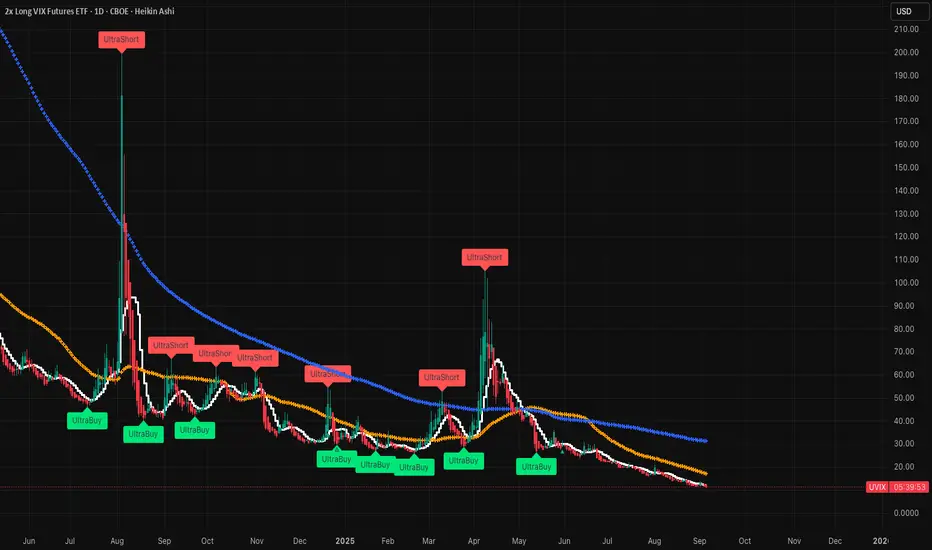
Potentially a nice upside to VIXHorrible jobs report and no clear sign that things will get better make it a great recipe for the VIX (UVIX) to spike. The glimmer of light from cutting interest rates likely won't make a dent in the economy. It's too little TOO LATE! A massive correction needs to happen and PE / CAPE ratios show that the stock market is the most expensive it has every been. I've seen many people get wiped out, always read the signs....
How Many Indicators Are Too Many?
I have been trading for around 5 years and in that time, I lost money and hope more often than I can count. A common coping strategy I use when in a time of loss is to strip all the "completely useless" indicators from my charts. And 6 months later, I have more than I had before.
Recently, I have actually started to earn small amounts of money from the markets consistently but my indicator problem persists. The picture above is an example of just some of the indicators I use. So now I ask the question,
-How many indicators are too many?
There really is not an answer despite what those on reddit might tell you. I seem to always have this fantasy that I will find the perfect chart set-up with all my indicators telling me just what I want to know. And of course TradingView has Pinscript which only makes my habit worse by allowing me to create exactly what I want.
As I was thinking about chart layouts this morning I came to a conclusion that my trading will always be evolving and the way in which I view the visual output of markets will change as well. There will most likely never be a chart set-up that I will use for the next 20 years. Even when I find my edge, the process of trading will still evolve. My "edge" will never be an indicator or a set of indicators .
So I wrote this to try and help those that are experiencing the same dilemma. Just know that you are not alone in your obsession with finding that perfect layout. Add 100 indicators to your chart and then delete them all when you feel they don't belong. You will never find that perfect indicator but but neither will you stop looking. It may seems like it is all a waste of time but I assure you that everything you experience in trading is worth it and progress does happen .
Safe Trading, Frank
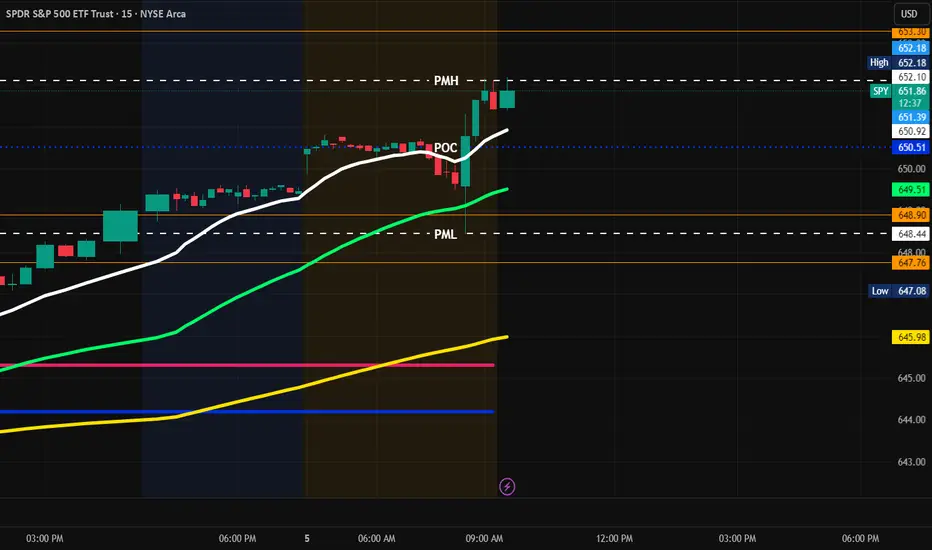
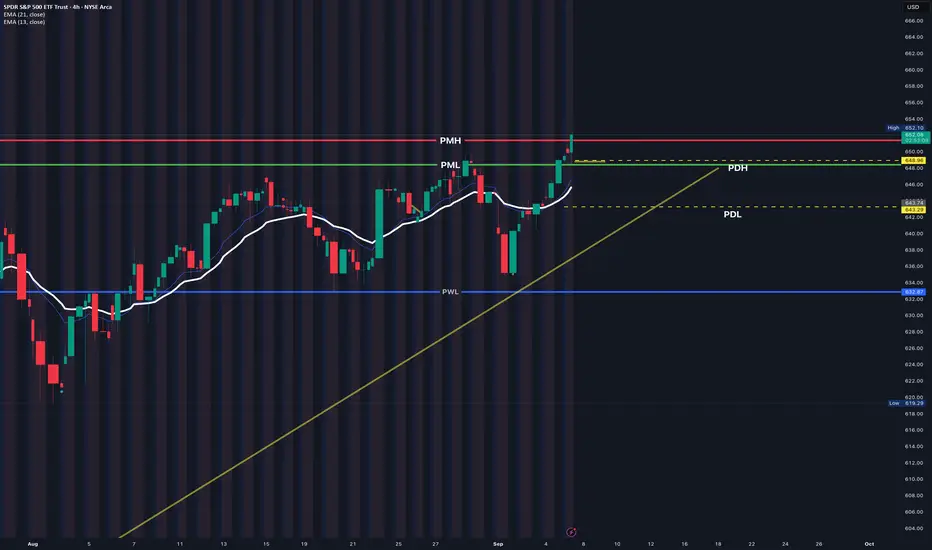
SPY Play 9/5/25After weak job report, Stock surge. SPY is in up. Be patient and allow the market to confirm it is still going higher. Don't guess - react. POI is at 650.51. You can wait until pullback to that and see if it holds for entry or use PMH. The range is 648.44-652.10. But if you wait the first 15 mins
PMH 652.10 Break-Retest and Hold = CALLS
PML 648.44 Break -Retest - Hold = PUTS
PDH 649.09
PDL 643.74
TP1 653.30
TP1 647.76
#YouGotOptions
"Discipline is the bridge between vision and victory. God gives the vision, but it's your daily obedience that builds the bridge."
$SPY $SPX $ES_F
Tomorrow was a HUGE move all the way to fill the PCE inflation gap and closed just under ATH’s
Since we made new ATH’s in premarket, expect a pullback today. This is yesterdays chart played out and today’s is coming out in just a few mins, but definitely keep that 650 level in mind today.
SPY Sept 5 Gameplan
Alright here’s what I’m seeing:
On the 4H chart SPY still holding a bull flag / ascending triangle vibe. VIX is under 15, 10-year yields are dumping, and DXY broke down — that all leans risk-on. Options flow shows big open interest stacked around 645–647, so that area is like a magnet.
I think price probably **chops around 648 first, then bounces and tries for 655+.
3 Scenarios
🟢 Bullish:
* Hold above 648 → reclaim 651 → run toward 655–658, maybe stretch 662.
* Confirmed if tech leaders (MSFT, META, AMZN) keep pushing.
Sideways / Chop:
* Stuck between 648–651, fakeouts both ways until volume picks a side.
* Basically consolidation around that option wall.
🔴 Bearish:
* Lose 648 with momentum → flush to 643–640.
* Would need DXY/yields to reverse back up or VIX to spike.
🎯 Key Levels
* PMH 651.30
* PDH 648.06
* PDL 643.51
* Option cluster: 645–647
* Targets: 655 → 658 → 662
💡 My bias → watch the 648 zone. If buyers defend it, I’m leaning long into that 655+ move.
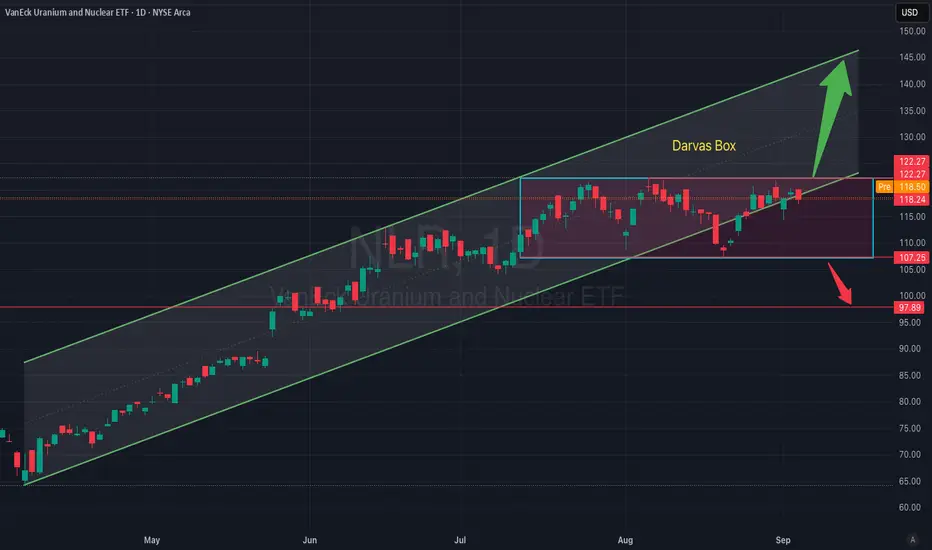
Darvas Box Breakout or Breakdown – $NLRThe VanEck Uranium and Nuclear ETF (NLR) is consolidating in a Darvas Box range between $107–122 while holding its broader rising channel. This zone is key for the next directional move:
A breakout above $122 would confirm bullish momentum, with upside potential toward the channel’s upper boundary around $135–145.
A breakdown below $107 would invalidate the current uptrend structure, exposing downside toward the next major support around $98–100.
Trade Plan:
Bullish Entry: Daily close above $122
Target: $135–145
Stop Loss: Below $118
Bearish Breakdown: Close below $107
Target: $98–100
Stop Loss: Above $112
This setup provides clear breakout and breakdown scenarios, making AMEX:NLR a key ETF to watch for trend continuation or reversal.
Impact of Currency Fluctuations on Global TradeIntroduction
Global trade is the lifeline of the modern economy. It connects countries, industries, and consumers across borders, enabling the exchange of goods, services, capital, and technology. However, at the core of every international transaction lies a critical factor that often gets overlooked in public discussions—currency exchange rates.
Currency fluctuations—the rise and fall of the value of one currency relative to another—play a significant role in shaping trade flows, competitiveness, profitability, and even the stability of entire economies. Exchange rate volatility can determine whether exports are competitive in global markets, how much importers pay for foreign goods, and how investors allocate capital across nations.
This essay explores the impact of currency fluctuations on global trade, breaking down causes, mechanisms, case studies, and long-term implications. It also looks at how governments, central banks, corporations, and financial institutions respond to mitigate risks associated with exchange rate volatility.
Understanding Currency Fluctuations
Currency fluctuations occur when the value of one currency rises or falls relative to another. The foreign exchange (forex) market, the largest financial market in the world, facilitates the buying and selling of currencies. Exchange rates are influenced by supply and demand, interest rates, inflation, political stability, monetary policy, and market speculation.
For example, if the Indian Rupee (INR) weakens against the US Dollar (USD), then Indian exporters receive more rupees for each dollar earned, making exports more competitive. On the other hand, importers must pay more for foreign goods priced in dollars, making imports costlier.
Key terms:
Appreciation: When a currency strengthens relative to another.
Depreciation: When a currency weakens relative to another.
Volatility: The degree of variation in currency values over time.
Causes of Currency Fluctuations
Monetary Policy & Interest Rates
Central banks influence exchange rates through interest rate decisions. Higher interest rates attract foreign capital, strengthening the currency, while lower rates weaken it.
Inflation Levels
Countries with lower inflation typically see currency appreciation, as purchasing power is preserved. High inflation erodes value.
Trade Balances
Nations running trade surpluses (exports > imports) often see stronger currencies, while deficits weaken them.
Capital Flows & Foreign Investment
Strong inflows of foreign direct investment (FDI) or portfolio investment increase demand for a currency, boosting its value.
Political & Economic Stability
Stable countries attract investors, strengthening their currency, while instability leads to capital flight and depreciation.
Market Speculation
Traders in the forex market bet on future movements, sometimes amplifying volatility.
Mechanisms of Impact on Global Trade
1. Export Competitiveness
When a country’s currency depreciates, its exports become cheaper for foreign buyers, boosting demand.
When a currency appreciates, exports become expensive, reducing competitiveness.
2. Import Costs
Currency depreciation increases the cost of imported raw materials, fuel, and machinery.
Appreciation makes imports cheaper, lowering input costs for domestic industries.
3. Profit Margins of Businesses
Exporters benefit from weaker domestic currencies, while import-heavy industries suffer.
Multinational corporations with global operations must manage “translation risk” when consolidating earnings from various currencies.
4. Balance of Payments (BoP)
Persistent depreciation can reduce trade deficits by discouraging imports and encouraging exports.
However, volatility creates uncertainty that disrupts long-term trade agreements.
5. Consumer Prices & Inflation
Currency depreciation makes imports costlier, leading to inflationary pressures in domestic markets.
This reduces consumer purchasing power and alters consumption patterns.
Case Studies: Real-World Examples
1. The US Dollar and Global Trade
The US dollar is the world’s reserve currency, used in most international trade. When the dollar strengthens:
Emerging markets struggle, as their imports become costlier.
US exporters lose competitiveness abroad.
Oil and commodity prices (often denominated in USD) rise for other countries.
2. Japan’s Yen Depreciation (2012–2015)
Japan deliberately weakened its yen under “Abenomics” to boost exports.
Japanese automakers and electronics manufacturers benefited.
Import costs for energy and food rose, impacting consumers.
3. Indian Rupee Volatility
The INR often faces depreciation pressures due to oil imports and trade deficits.
Exporters in IT and textiles gain from weaker rupee.
Oil importers, airlines, and electronics manufacturers face higher costs.
4. Eurozone Crises (2010–2012)
During the sovereign debt crisis, euro depreciation initially supported European exports. However, uncertainty discouraged investment and hurt overall trade confidence.
5. Chinese Yuan Management
China manages its currency to remain competitive in global trade. A weaker yuan supports Chinese exports, though it has often drawn criticism from trading partners accusing China of “currency manipulation.”
Short-Term vs Long-Term Impacts
Short-Term Effects:
Exporters and importers immediately feel gains or losses from currency shifts.
Volatility disrupts pricing strategies, contracts, and supply chains.
Long-Term Effects:
Persistent depreciation can erode investor confidence, discouraging capital inflows.
Companies may relocate production to hedge against currency risks.
Exchange rate instability may encourage protectionism and tariffs.
Sector-Wise Impact
Energy Sector
Oil prices, usually denominated in USD, fluctuate with dollar strength. Importing nations face inflation when their currency weakens.
Technology & Services
Outsourcing destinations like India benefit when their currency weakens, as dollar earnings translate into higher domestic revenue.
Manufacturing & Automobiles
Export-oriented industries gain from weaker home currencies. However, dependency on imported raw materials can offset benefits.
Agriculture & Commodities
Farmers in export-driven economies gain from weaker currencies. But fertilizer, equipment, and fuel imports become costlier.
Tools to Manage Currency Risks
1. Hedging Instruments
Forward Contracts: Lock in exchange rates for future transactions.
Options: Provide flexibility to buy/sell at a fixed rate.
Swaps: Exchange currency cash flows between parties.
2. Diversification
Multinationals diversify production and sourcing across countries to reduce exposure.
3. Central Bank Intervention
Central banks buy/sell currencies to stabilize volatility.
4. Trade Agreements
Regional trade blocs (e.g., EU, ASEAN) reduce intra-region currency risk by using common or pegged currencies.
Winners and Losers in Currency Fluctuations
Winners: Exporters during depreciation, importers during appreciation, forex traders exploiting volatility.
Losers: Import-dependent industries during depreciation, debt-heavy countries with foreign loans, consumers facing inflation.
Broader Economic Implications
Global Supply Chains
Exchange rate volatility complicates cost management in multinational supply chains.
Foreign Debt Servicing
Countries with debt denominated in foreign currencies face higher repayment costs if their currency depreciates.
Trade Wars & Protectionism
Currency disputes can lead to accusations of manipulation, tariffs, and retaliatory trade measures.
Financial Market Volatility
Sudden currency swings trigger capital outflows from emerging markets, destabilizing stock and bond markets.
Future Outlook
Digital Currencies & CBDCs: The rise of central bank digital currencies could reduce transaction costs and lower forex volatility.
Regionalization of Trade: More trade within blocs may reduce exposure to dollar dominance.
Greater Use of Hedging Tools: Firms will increasingly rely on sophisticated financial instruments to manage risk.
Geopolitical Uncertainty: Wars, sanctions, and supply chain disruptions will continue to drive currency volatility.
Conclusion
Currency fluctuations are both an opportunity and a risk in global trade. While depreciation can stimulate exports, it also raises import costs and inflation. Appreciation makes imports cheaper but hurts exporters. The net effect depends on a nation’s trade structure, economic resilience, and ability to manage risks.
For businesses, managing currency risk is now as important as managing production or marketing. Governments must balance exchange rate stability with economic growth, while central banks act as guardians against excessive volatility.
In an interconnected world, no nation is immune from the impact of currency swings. Exchange rate management and risk mitigation strategies will remain central to ensuring global trade continues to thrive despite fluctuations.
$SPY / $SPX Scenarios — Friday, Sept 5, 2025🔮 AMEX:SPY / SP:SPX Scenarios — Friday, Sept 5, 2025 🔮
🌍 Market-Moving Headlines
🚩 Jobs Friday = make or break. Nonfarm Payrolls, unemployment, and wages will lock in Fed expectations into September.
📉 Positioning light ahead of NFP — futures choppy as traders square books.
💬 Consumer sentiment wraps the week — expectations on inflation and spending will color the tape.
📊 Key Data & Events (ET)
⏰ 🚩 8:30 AM — Nonfarm Payrolls (Aug)
⏰ 🚩 8:30 AM — Unemployment Rate (Aug)
⏰ 🚩 8:30 AM — Average Hourly Earnings (Aug)
⏰ 10:00 AM — Wholesale Trade (Jul)
⏰ 10:00 AM — UMich Consumer Sentiment (Final, Aug)
⚠️ Disclaimer: Educational/informational only — not financial advice.
📌 #trading #stockmarket #SPY #SPX #NFP #jobs #labor #Fed #economy #bonds #Dollar
Hello Trader, SPY for tomorrow: 09/05/25Double top 649.00, bullish entry 650.00/652.00, possible target 655.00/656.00
Bearish entry: 648.00/649.00, technical potential, could be a possible rebound
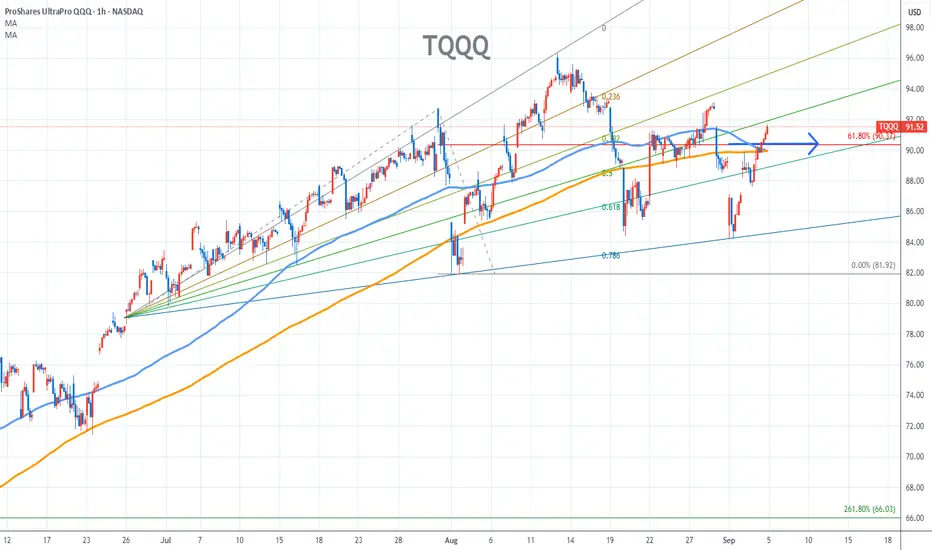
TQQQ Stock Chart Fibonacci Analysis 090425Trading Idea
1) Find a FIBO slingshot
2) Check FIBO 61.80% level
3) Entry Point > 90/61.80%
Chart time frame:B
A) 15 min(1W-3M)
B) 1 hr(3M-6M)
C) 4 hr(6M-1year)
D) 1 day(1-3years)
Stock progress:A
A) Keep rising over 61.80% resistance
B) 61.80% resistance
C) 61.80% support
D) Hit the bottom
E) Hit the top
Stocks rise as they rise from support and fall from resistance. Our goal is to find a low support point and enter. It can be referred to as buying at the pullback point. The pullback point can be found with a Fibonacci extension of 61.80%. This is a step to find an entry-level position. 1) Find a triangle (Fibonacci Speed Fan Line) that connects the high (resistance) and low (support) points of the stock in progress, where it is continuously expressed as a Slingshot, 2) and create a Fibonacci extension level for the first rising wave from the start point of the slingshot pattern.
When the current price goes over the 61.80% level, that can be a good entry point, especially if the SMA 100 and 200 curves are gathered together at 61.80%, it is a very good entry point.
As a great help, TradingView provides these Fibonacci speed fan lines and extension levels with ease. So if you use the Fibonacci fan line, the extension level, and the SMA 100/200 curve well, you can find an entry point for the stock market. At least you have to enter at this low point to avoid trading failure, and if you are skilled at entering this low point, with the fibonacci6180 technique, your reading skill of to chart will be greatly improved.
If you want to do day trading, please set the time frame to 5 minutes or 15 minutes, and you will see many of the low points of rising stocks.
If you prefer long-term range trading, you can set the time frame to 1 hr or 1 day
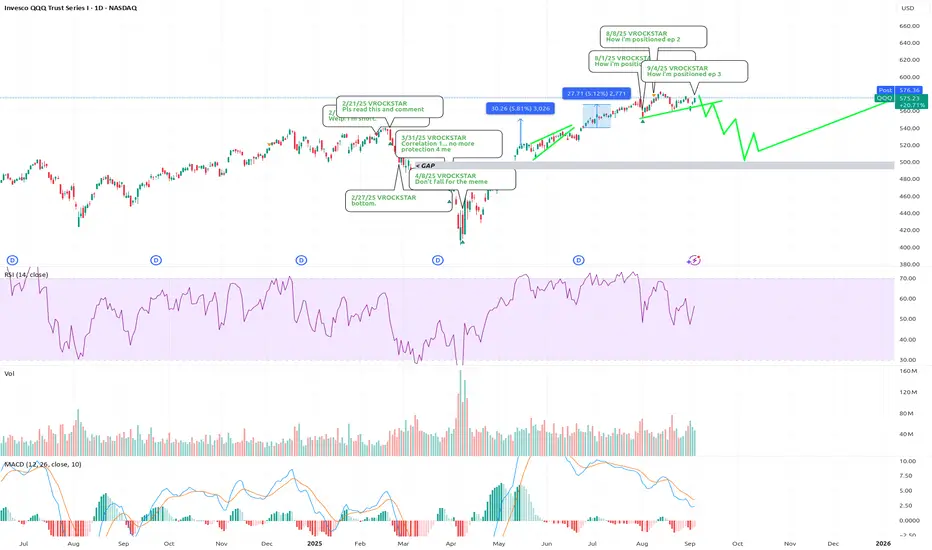
9/4/25 - $qqq - How i'm positioned ep 39/4/25 :: VROCKSTAR :: NASDAQ:QQQ
How i'm positioned ep 3
- it's hard not to notice the q's and the spy's are about 50 bps away from a gap fill
- while i'm a strong believer in the efficient market hypothesis (lol - i'm kidding), with googl's timely headline driving risk higher, today's whatever bid getting bid and "rate cuts" as a known known driving "narrative" bid... it all just feels so roll-over-y
- lulu tn just basically confirms... besides having ms sweeney providing green dillys across basement dwelling "portfolios"... the consumer is, has been, and will be cooked like a road kill goose... and rate cuts won't help
- even my NYSE:ONON feels like something i need to manage more lightly.
- it. is. just. hard. to. own. anything.
so i just took down risk a lot.
i'm about 30% cash. tempted to get to 35 or 40%
- still packing a solid 55% obtc, but well hedged w/ ibit puts (as i've described)
- onon leaps at 5% at 3-1 (but honestly it's probably too big)
- smlr to play the mstr headline, but it's honestly just an obtc/ mnav arb exercise w/ shorter term triggers and allows me to keep risk on exposure to btc while managing cash
- nxt still a staple, but it's only 5% of the portfolio at 2-1 leverage (so 10% gross). feels like the only one i have confidence in, but it's performed lol. *don't cut winners, V*
so i draw out some tea leaves green lines not as a prediction but as a thesis for what i think could be a path given liquidity constraints and how rate cuts won't immediately help this.
the memes are bearish divergence all over. correlation 1. these things v likely to trigger leverage liquidations all over on the way down. i think funds might be (and should be) willing to short these too which could amplify the tape.
this all just feels like we're in a seasonal wtf is going on.
hard to own anything, even btc unhedged.
20% ytd and always above 0% still feels "good" but has been too much lift and the juice for the squeeze is like hitting a hawt gurl pilates after hour passion project establishment in LA... $20 bucks for the instagram photo. too many ppl posting PnL gainz is exhausting and a sign.
all i'm saying is... make sure you know what you own. you are taking note of all the strangeness around. acknowledge liquidity conditions are not loose and rate cuts won't immediately help (rates are high! people are cooked! we need rates to BURN to really boost liquidity).
finally. remember - bankers like to pay themselves one more time into YE. don't become their exit liquidity here and also their source of assets toward the dippity do dah.
hand sitting feels smart.
V
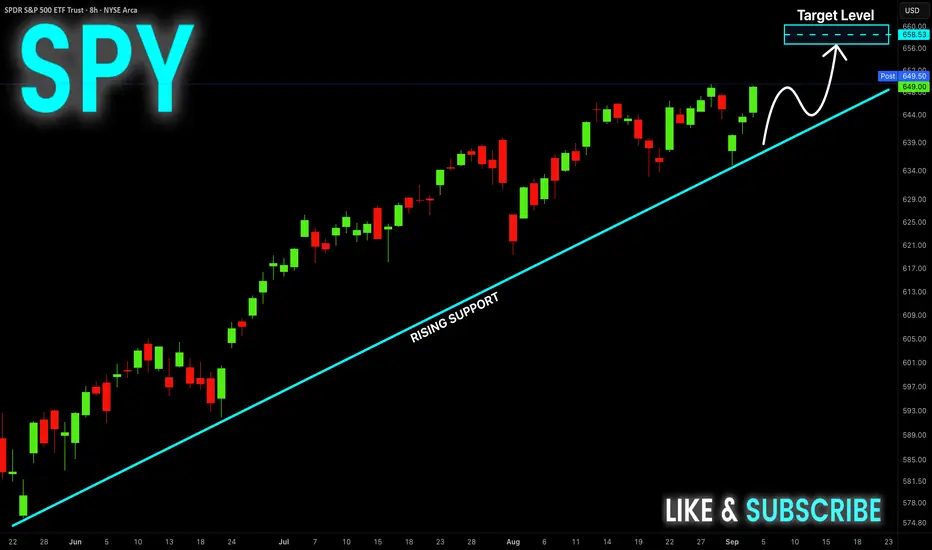
SPY Will Keep Growing! Buy!
Hello,Traders!
SPY is trading along the
Rising support line and
The index made a rebound
From the rising support
So we are bullish biased
And we will be expecting
A further bullish move up
Buy!
Comment and subscribe to help us grow!
Check out other forecasts below too!
Disclosure: I am part of Trade Nation's Influencer program and receive a monthly fee for using their TradingView charts in my analysis.
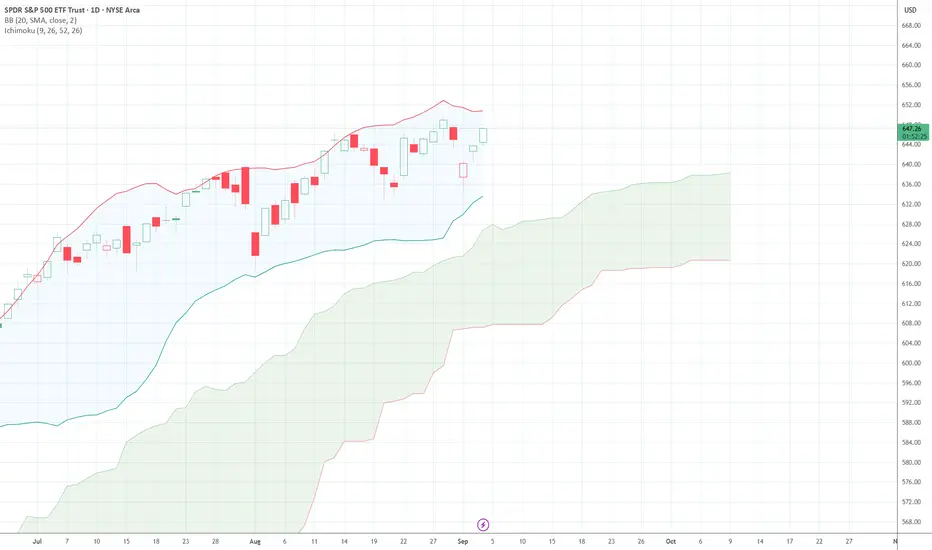
$SPY Ready to ExpandAMEX:SPY finally looks ready to expand here. Lots of bullish flow coming in. Tight daily bands after a month of chop.
$SPY rounded top forming potentiallyLooks to me like the AMEX:SPY AMEX:SPY is losing steam and CBOE:VXX CBOE:VXX and CBOE:UVIX CBOE:UVIX are showing potentials for reversal and when the Barrons cover says Citadel is in 1 in 4 stocks that means to me that they are positioning for a larger drop to come potentially 25% this fall
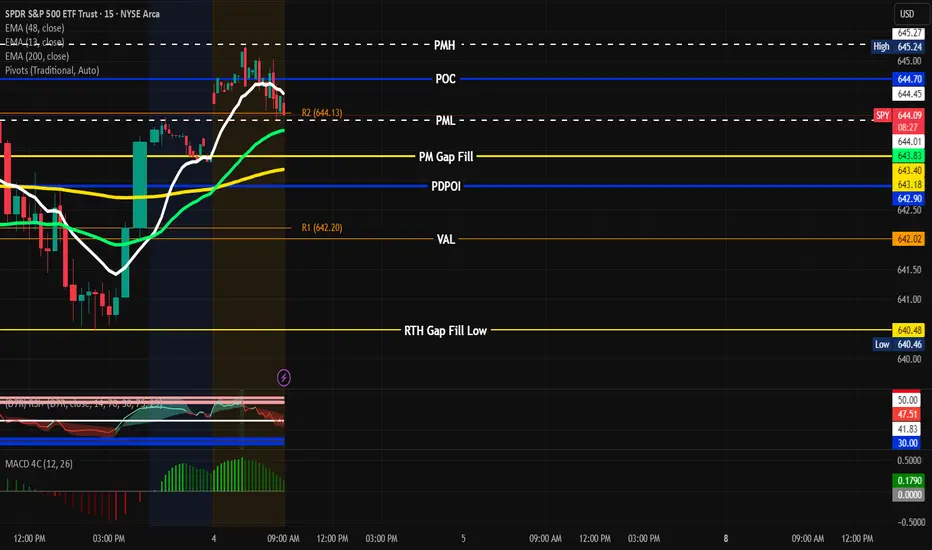
SPY setup 9/4/25PMH 645.27
PML 644.01
POI 645.24
PM Gap Fill 643.40
Range is between 6.43.17-645.27 Look for SPY to go back and retest PMH before coming back down to 644.70. If it breaks through look for it to go to PML 644.01 or Fill the Gap at 643.40. Wait for clear signs before hopping in. If it breaks, retest and hold PML look for PUTs to 642.90-642.20 T/P 1. If it breaks PMH and pullback and hold look to enter for CALL 646.10 T/P 1. You can also use the 9/13 EMA as entry. Use S/L and manage risk properly. Let’s Goooo! “Discipline is the tithe you pay, The reward is financial freedom.” - #You Got Options
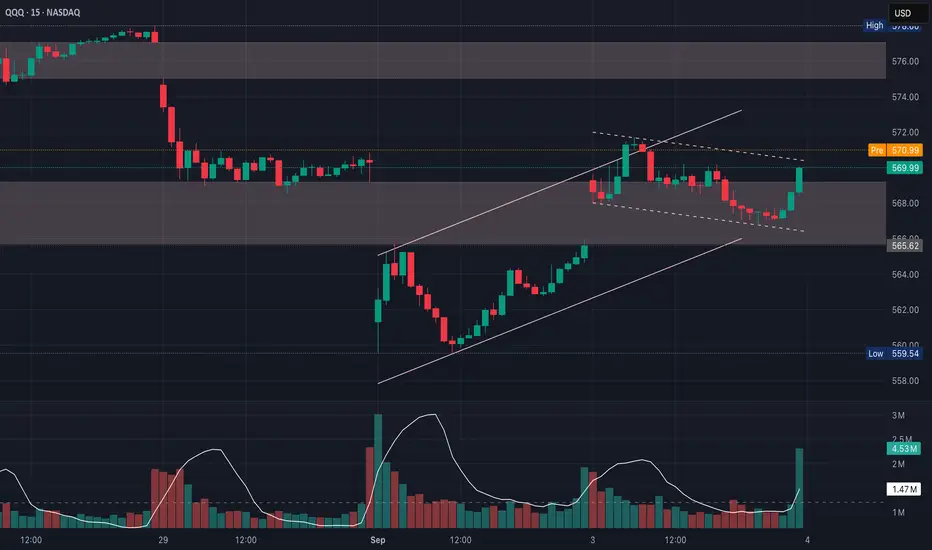
QQQ Potential Bearish ResolutionOn the larger timeframe, the overall structure is a bear flag off the bigger down-move, much better than the earlier wedge attempt
If QQQ were forming a wedge, price would be swinging wider with higher highs & lower lows, like a volatility burst after sideways action
This leans bearish (because of the descending highs & flat-ish support), but the final signal will be whichever side breaks with volume
The consolidation isn’t bullish (yet) because it’s drifting against the prior impulse down
It's a bull flag nested inside a bigger bear flag
It's a setup that needs confirmation, so bullish in theory, but the market still has to “vote” with price + volume
If you view the current consolidation as a bull flag, you’re keying off the last impulse up ($559-$572)
If you view it as a bear flag, you’re keying off the last dominant leg down ($583-$559)
That last green bar is encouraging for bulls, but overall the consolidation volume looks like it’s contracting (fits both a flag & a bear retrace)
The decisive clue will be whether volume expands on the breakout/breakdown
Puts
Watch for rejection at $571 with fading volume
Calls
Watch for strong volume push above $572, targeting ~$578
1. Volume
Buyers came in strong on the last green bar, but for a sustained push through $571, should see rising buy volume
2. Structure
If price fails at $571 & volume fades, it could roll over to test $565-$560
If buyers push cleanly above $572 with conviction, then the upper gap $574–$578 comes into play as the next target
If sellers defend $571 again, odds favor a breakdown toward $560
If volume surges & $571 breaks, bulls have a clean magnet up to $578–$582
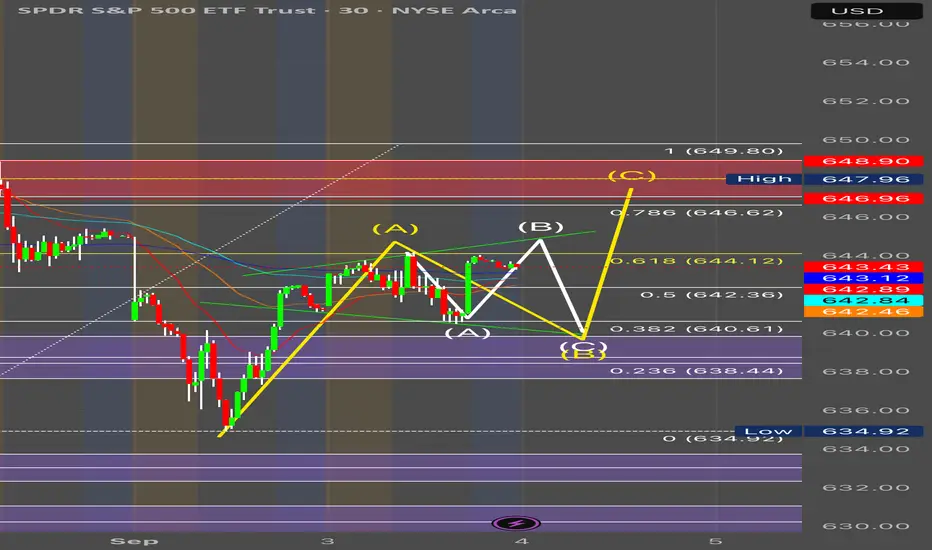
Spy possible move for 9/4Spy in my opinion has been looking weak I believe it’s in a wave 2 before we see the next move down which I anticipate comes Friday, but right now looks as it’s in an abc correction looking for a small gap up in the morning or we stay flat an pop then reversal to the downside then back to the upside to end the day. We’ll see how this plays out nfa
OPEC and Global Oil Market StabilityIntroduction
The global oil market is one of the most critical pillars of the world economy. Oil is not only a major source of energy but also a raw material for industries, transportation, and even household consumption. Prices of oil influence inflation, trade balances, and even the geopolitical relationships between countries. In this complex ecosystem, the Organization of the Petroleum Exporting Countries (OPEC) plays a central role in managing supply, stabilizing markets, and balancing the interests of oil producers and consumers.
Since its establishment in 1960, OPEC has shaped the trajectory of the global oil market through production quotas, supply coordination, and negotiation with major oil consumers. But with the rise of new producers, renewable energy, and geopolitical tensions, OPEC faces constant challenges in ensuring oil market stability.
This article provides a comprehensive exploration of OPEC and its role in global oil market stability, covering history, functions, mechanisms, challenges, and the outlook for the future.
1. Origins and Evolution of OPEC
1.1 Birth of OPEC
OPEC was founded in September 1960 in Baghdad, Iraq, by five founding members:
Iran
Iraq
Kuwait
Saudi Arabia
Venezuela
The idea came as a response to the dominance of Western oil companies (known as the “Seven Sisters”) who controlled oil production, pricing, and profits. At that time, producing countries received little revenue compared to multinational corporations.
The main purpose of OPEC was to unify and coordinate petroleum policies among member states, ensure fair and stable prices, and secure steady income for oil-producing nations.
1.2 Expansion
Over time, more countries joined OPEC. Today, OPEC has 13 member states (as of 2025), mostly located in the Middle East, Africa, and South America.
Key members include:
Saudi Arabia (largest producer)
Iraq
Iran
United Arab Emirates (UAE)
Kuwait
Nigeria
Angola
Venezuela
Algeria
In 2016, OPEC entered into a broader alliance with non-member oil producers like Russia, Mexico, and Kazakhstan—creating what is known as OPEC+. This alliance increased OPEC’s influence, especially in handling crises such as the COVID-19 oil demand collapse.
2. Structure and Decision-Making in OPEC
OPEC functions as an intergovernmental organization with structured decision-making processes:
2.1 OPEC Conference
The OPEC Conference is the supreme authority, held twice a year at OPEC’s headquarters in Vienna, Austria. Each member country is represented by its oil minister. Decisions, especially on production quotas, are made through consensus (not majority voting).
2.2 Secretariat
The OPEC Secretariat, headed by a Secretary-General, conducts research, prepares reports, and provides technical support to member countries.
2.3 Advisory Committees
Several technical and economic committees assist in monitoring the market and suggesting production strategies.
3. OPEC’s Role in Oil Market Stability
OPEC’s influence revolves around controlling oil supply to balance demand and stabilize prices. The group cannot control demand (which depends on global economic activity), but it can adjust production quotas.
3.1 Price Stabilization
When oil prices fall sharply: OPEC reduces production quotas to cut supply, preventing oversupply and stabilizing prices.
When oil prices rise excessively: OPEC increases supply to avoid demand destruction and global inflation.
3.2 Balancing Producers and Consumers
OPEC seeks a “fair price”—high enough for producers to gain revenues but not too high to harm global growth. This balance ensures long-term stability.
3.3 Countering Market Volatility
Oil markets are highly volatile due to speculation, geopolitical risks, and unexpected shocks (wars, pandemics, sanctions). OPEC acts as a stabilizer by adjusting production and coordinating with partners.
4. Mechanisms of OPEC Influence
4.1 Production Quotas
The most important tool OPEC uses is the allocation of production quotas among its members. For example, if the group decides to cut output by 2 million barrels per day (bpd), each member reduces supply proportionally.
4.2 Spare Capacity
Saudi Arabia, in particular, maintains spare capacity—extra production ability that can be brought online quickly. This flexibility makes OPEC the “swing producer.”
4.3 Strategic Alliances (OPEC+)
By collaborating with non-members such as Russia, OPEC expands its control over a larger share of global supply, making it more effective in stabilizing prices.
5. Case Studies: OPEC and Market Stability
5.1 1973 Oil Crisis
During the Arab-Israeli war, OPEC imposed an oil embargo on the US and allies, leading to a quadrupling of oil prices. This demonstrated OPEC’s political and economic power, but it also destabilized global markets.
5.2 1980s Oil Glut
OPEC faced challenges from non-OPEC producers (North Sea, Mexico). Prices collapsed, showing the limits of OPEC’s influence when demand weakens and alternative supplies grow.
5.3 2008 Financial Crisis
Oil prices spiked to $147/barrel in July 2008, then collapsed to $40 by December. OPEC responded by cutting production to stabilize markets.
5.4 2020 COVID-19 Pandemic
Oil demand plunged as lockdowns halted travel and industry. At one point, US oil prices even went negative. OPEC+ implemented record production cuts of nearly 10 million bpd, helping markets recover.
6. Challenges Facing OPEC
6.1 Internal Divisions
Members often have conflicting interests. For example:
Saudi Arabia favors production cuts to maintain high prices.
Iran and Venezuela often push for higher quotas due to budgetary needs.
This lack of unity can weaken OPEC’s effectiveness.
6.2 Rise of Shale Oil
The US shale revolution has made America the world’s largest oil producer. Shale oil production is flexible, meaning when OPEC cuts supply and prices rise, shale producers increase output—reducing OPEC’s control.
6.3 Energy Transition
The shift towards renewable energy, electric vehicles, and climate policies threatens long-term oil demand. OPEC must adapt to remain relevant in a decarbonizing world.
6.4 Geopolitical Tensions
Sanctions on countries like Iran and Venezuela, wars in the Middle East, and political instability in Africa complicate OPEC’s coordination.
7. OPEC and Global Economy
7.1 Impact on Inflation
Oil prices directly affect inflation. High oil prices raise transportation and production costs, leading to higher consumer prices. OPEC’s actions therefore influence central bank policies and interest rates worldwide.
7.2 Impact on Trade Balances
Oil-importing nations (like India, Japan, and most of Europe) face trade deficits when oil prices rise. Exporters (like Saudi Arabia) benefit with higher revenues. OPEC’s pricing decisions reshape global trade balances.
7.3 Impact on Financial Markets
Oil is a key commodity in futures markets. OPEC announcements on quotas or cuts often move not only oil prices but also stock and currency markets.
8. OPEC and the Future of Oil Market Stability
Looking ahead, OPEC faces a delicate balance between maintaining relevance and adapting to new energy realities.
8.1 Role in Energy Transition
OPEC argues that oil will remain essential for decades, even as renewables grow. It plans to invest in cleaner technologies and carbon capture to defend oil’s role in the energy mix.
8.2 Strengthening OPEC+
The alliance with Russia and others (OPEC+) has proven successful in stabilizing markets. Expanding and institutionalizing this partnership may secure OPEC’s influence.
8.3 Diversification by Member States
Many OPEC members, especially in the Gulf, are investing in diversification (Saudi Vision 2030, UAE’s renewable projects) to prepare for a post-oil future. This may reduce the pressure to maximize oil revenues in the short term.
9. Criticisms of OPEC
9.1 Cartel Accusations
Critics often label OPEC a “cartel” because it manipulates supply to influence prices. This has sparked legal challenges, such as the proposed NOPEC bill in the US Congress, which aims to make OPEC subject to antitrust laws.
9.2 Transparency Issues
OPEC’s decision-making is often criticized as opaque, with little clarity on quota compliance or future strategies.
9.3 Dependence on Oil Revenues
By focusing heavily on oil, many OPEC members remain vulnerable to price volatility, making them dependent on OPEC’s collective decisions.
10. Conclusion
OPEC has been a dominant force in the global oil market for more than six decades. By adjusting supply and coordinating production, it has sought to bring stability to a highly volatile market. Its role has been critical in balancing the interests of oil producers and consumers, cushioning global economies from extreme shocks, and ensuring steady revenues for member states.
However, OPEC’s future is not without challenges. Internal divisions, the rise of US shale, geopolitical tensions, and the accelerating global energy transition all threaten its influence. Yet, with the OPEC+ alliance and adaptive strategies, OPEC continues to hold a central position in global energy governance.
The world is moving towards cleaner energy, but oil will remain crucial for decades. As long as oil is at the heart of economic growth and industrial activity, OPEC’s role in maintaining global oil market stability will remain vital—though increasingly complex.
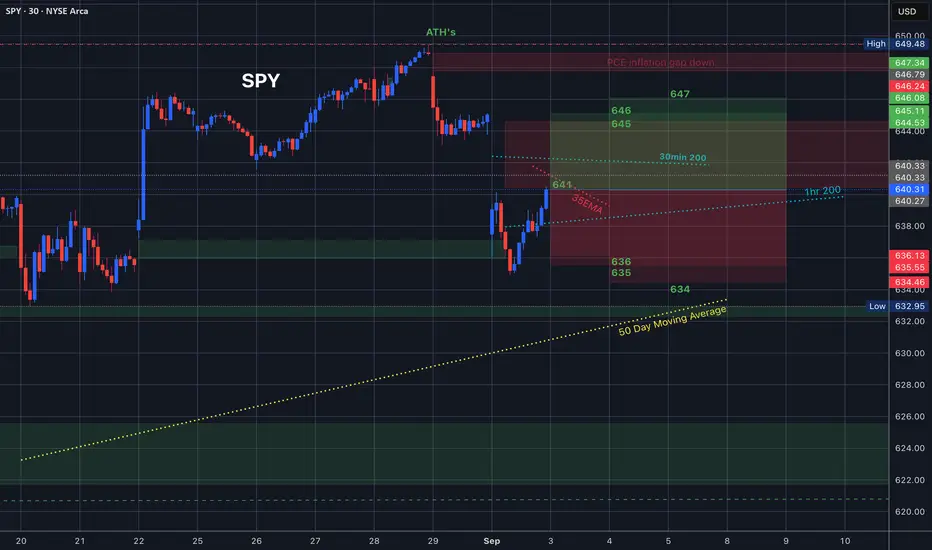
$SPY Trading Range for 9.3.25
Tomorrow’s trading range is interesting for sure. The upward facing 1hr 200MA caught us with the help of the bull gap just underneath it.
We now have two big bear gaps above us off of ATH’s.
Let me know how you guys are going to play this. Let’s go. I need a better day today than yesterday.