Learn how to trade EOD / FOD Professional StrategyEOD /FOD is an acronym for End of Day buy or sell short entry that holds overnight and the First of Day sell the ETF or stock at Market Open. This is a strategy for experienced to Elite aka Semi-Professional Traders. Beginners need to hone skills and practice in a simulator.
Professional Traders use this strategy all the time. They rarely intraday trade aka "day trading" unless they are Sell Side Institution floor traders who do intraday trading all daylong.
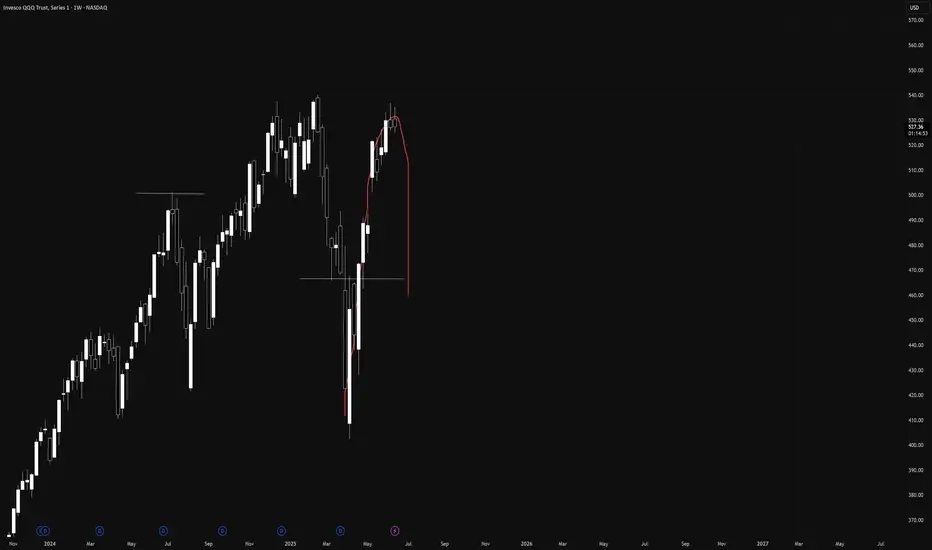
EOD /FOD is a very simple, easy to learn strategy for when Buy Side Giant Dark Pools have accumulated OR have Supported the Market and the Dark Pools foot print of a rectangle that is narrow with consistent highs and lows.
TWAP Dark Pool orders trigger at a low price or lower and usually move price minimally. When in Support the Market mode. The run up is a long white candle.
TWAPs are automated Time Weighted At Average Price. These orders ping at a specific time and buy in accumulation mode. If the stock price suddenly moves up beyond the high range of the TWAP, then the orders pause or halt.
Then pro traders do nudges and runs are instigated by either Gap Ups by HFTs, OR smaller funds VWAP ORDERS, or MEME's or other large groups of retail traders all trading and entering orders in sync or as close to sync as possible to create a flood of small lots that do move price upward OR downward rapidly.
Using the EOD /FOD requires understanding of how the Dark Pools, Pro Traders and other groups react to price and what, where and when orders are automated.
When ever you see a platform trend pattern such as we have on the QQQ yesterday at close and early this morning, then the entry would have been in the last 5 minutes of yesterday's market.
ETF market

Technology ETF Flirts with New HighsTechnology stocks have been coming to life recently, and some traders may expect new highs soon.
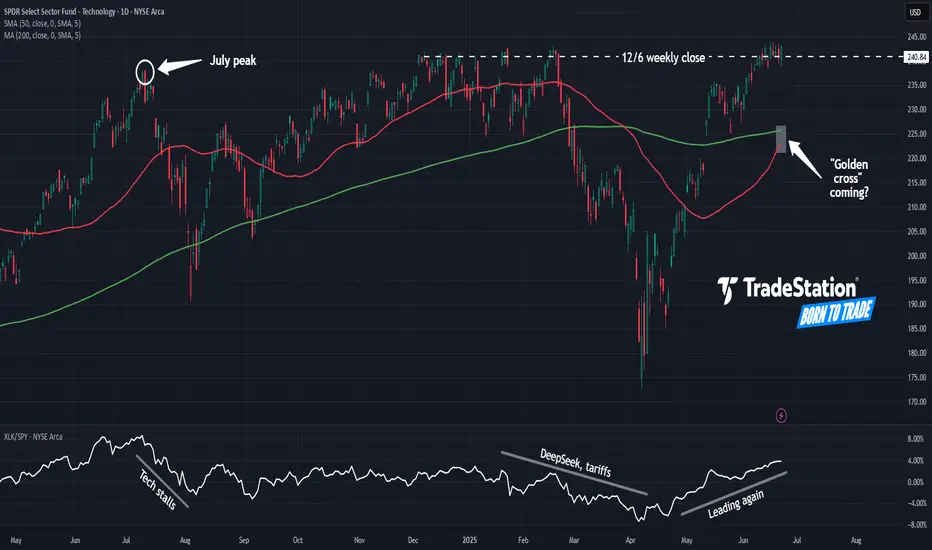
The first pattern on today’s chart of the SPDR Select Sector Technology Fund is last July’s peak around $238. As the fund retreated from that level, it began a period of underperformance. (See ratio chart in the lower study.) The weakness continued through April, when it started to outpace the broader market again.
Second is $240.84, the final price on December 6 and the highest weekly closing price ever. XLK is on track to potentially surpass that level, which could confirm a breakout.
Third, the 50-day simple moving average (SMA) is nearing a potential “golden cross” above the 200-day SMA. Is the longer-term trend turning bullish again?
Finally, price action in this fund could be important for the broader market because technology represents almost one-third of the S&P 500 index.
Standardized Performances for the ETF mentioned above:
SPDR Select Sector Technology ETF (XLK)
1-year: +9.87 %
5-years: +135.69%
10-year: +432.42%
(As of May 30, 2025)
Exchange Traded Funds ("ETFs") are subject to management fees and other expenses. Before making investment decisions, investors should carefully read information found in the prospectus or summary prospectus, if available, including investment objectives, risks, charges, and expenses. Click here to find the prospectus.
Check out TradingView's The Leap competition sponsored by TradeStation.
TradeStation has, for decades, advanced the trading industry, providing access to stocks, options and futures. If you're born to trade, we could be for you. See our Overview for more.
Past performance, whether actual or indicated by historical tests of strategies, is no guarantee of future performance or success. There is a possibility that you may sustain a loss equal to or greater than your entire investment regardless of which asset class you trade (equities, options or futures); therefore, you should not invest or risk money that you cannot afford to lose. Online trading is not suitable for all investors. View the document titled Characteristics and Risks of Standardized Options at www.TradeStation.com . Before trading any asset class, customers must read the relevant risk disclosure statements on www.TradeStation.com . System access and trade placement and execution may be delayed or fail due to market volatility and volume, quote delays, system and software errors, Internet traffic, outages and other factors.
Securities and futures trading is offered to self-directed customers by TradeStation Securities, Inc., a broker-dealer registered with the Securities and Exchange Commission and a futures commission merchant licensed with the Commodity Futures Trading Commission). TradeStation Securities is a member of the Financial Industry Regulatory Authority, the National Futures Association, and a number of exchanges.
TradeStation Securities, Inc. and TradeStation Technologies, Inc. are each wholly owned subsidiaries of TradeStation Group, Inc., both operating, and providing products and services, under the TradeStation brand and trademark. When applying for, or purchasing, accounts, subscriptions, products and services, it is important that you know which company you will be dealing with. Visit www.TradeStation.com for further important information explaining what this means.
Nightly $SPY / $SPX Scenarios for June 24, 2025🔮 Nightly AMEX:SPY / SP:SPX Scenarios for June 24, 2025 🔮
🌍 Market-Moving News 🌍
🇺🇸 Markets Eye Powell Testimony & Consumer Confidence
Today brings a double dose of market-moving data: the June Consumer Confidence Index and Fed Chair Jerome Powell’s testimony before Congress. These will be key indicators of household sentiment and potential shifts in Fed rate guidance
🛢️ Oil Volatility Persists on Middle East Strain
Oil prices briefly spiked after U.S. strikes on Iran’s nuclear facilities, prompting fears of supply disruptions. However, prices have since dipped as ceasefire hopes emerge. Investors remain cautious on energy headwinds
💱 Dollar Retraces on Safe-Haven Rotation
The dollar softened after peaking as geopolitical tensions eased slightly. Still, it remains sensitive to Powell’s tone and confidence data, which could reintroduce volatility
📊 Key Data Releases & Events 📊
📅 Tuesday, June 24:
10:00 AM ET – Conference Board Consumer Confidence (June)
Monitors household optimism; a rebound could support consumer spending and equities.
10:00 AM ET – Fed Chair Powell Testimony Begins
Powell appears before the House Financial Services Committee. Market focus: inflation outlook, tariffs, and potential timing for rate cuts.
⚠️ Disclaimer:
This information is for educational and informational purposes only and should not be construed as financial advice. Always consult a licensed financial advisor before making investment decisions.
📌 #trading #stockmarket #economy #Fed #trade #energy #technicalanalysis
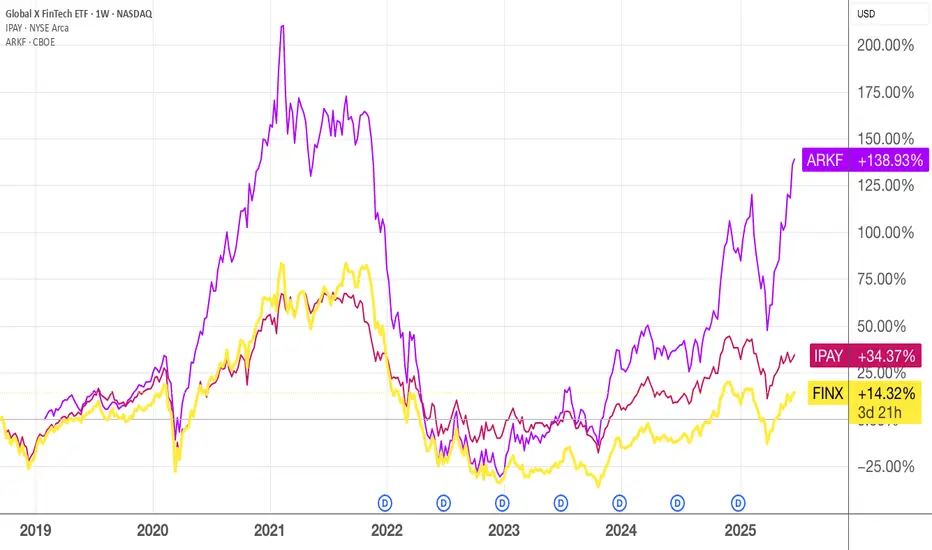
Global Paymasters - how many do you own in your portfolio?In many countries, you would have some payment processing companies with the global brand like Visa, Mastercard, Paypal dominating. In China, we have Tencent and Alibaba which I am invested in.
So, if you like the fundamentals and growth story of these payment companies, buying into the ETFs may be a good idea.
Here's three promising ETFs to consider.
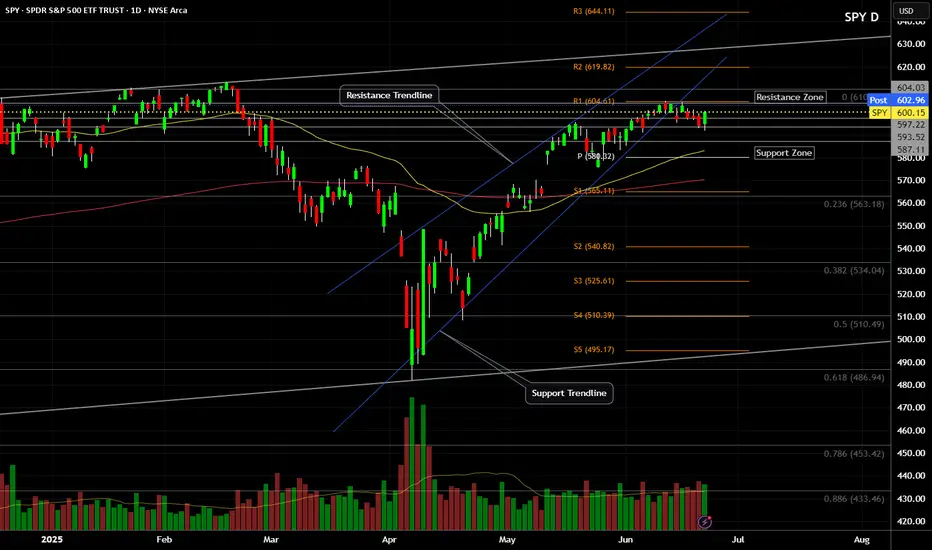
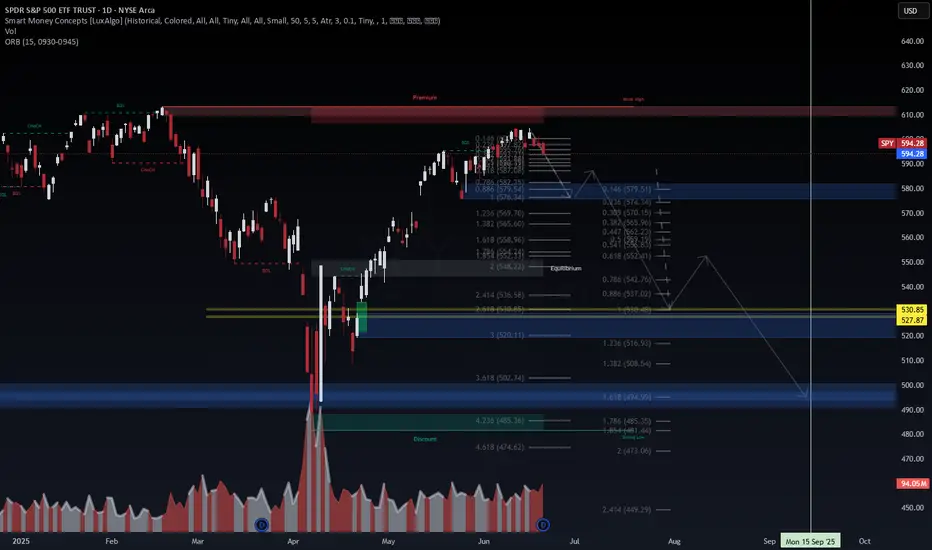
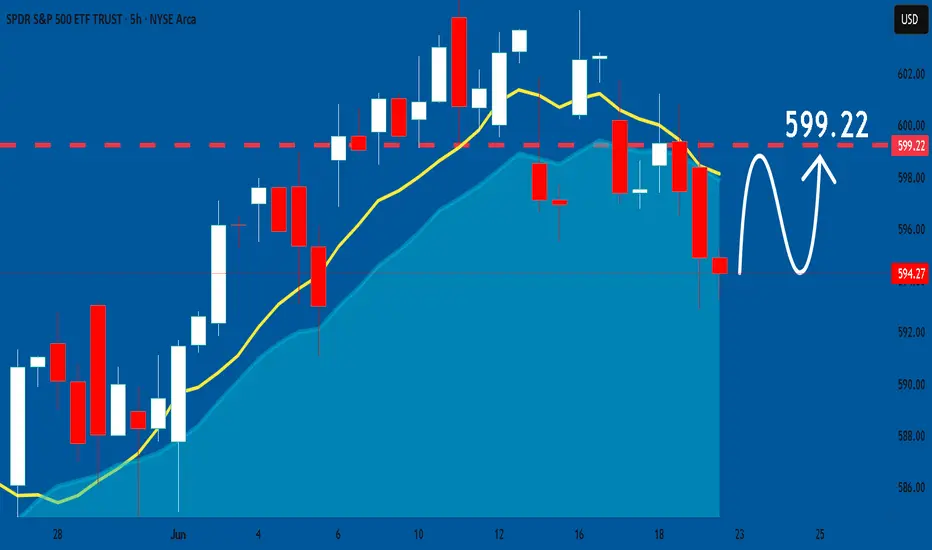
SPY (S&P500 ETF) - Price Bouncing Up from Support after NewsSPY (S&P500 ETF) price has bounced up from the $593 support level after recent global news (de-escalation news).
Price action has slowed and consolidated in June 2025, and the S&P500 is still maintaining a price uptrend.
The 50EMA and 20EMA Golden Cross is still active and in progress (since May 2025).
The next stock market earnings season is not for another 3 months. Inflation, interest rate news, global events, government news, corporate news will continue to affect price volatility this summer.
Resistance Levels: $604, $610, $612, $619.
Support Levels: $600, $593, $586, $579.
SPY/QQQ Plan Your Trade For 6-23 : Afternoon UpdateWhat happened to the CRUSH pattern?
Everyone wants to know why the CRUSH pattern didn't show up today. Well, I keep telling all of you these SPY Cycle Patterns are based on GANN, Tesla and Fibonacci price structures. They do not take into consideration news, global events, or anything outside of PRICE.
They are predictive - meaning they attempt to predict potential price shapes/patterns weeks, months, and years in advance.
The markets, obviously, are seeking some normalcy after the Iran conflict. I thought the CRUSH pattern would have been a perfect fit for today - but obviously the markets didn't agree.
If you have been following my videos, you know I keep saying the US stock market is acting as a global hedge for risks. Traders are pouring capital into the US stock market as a way to avoid global risk factors.
Traders are also pouring capital into Gold/Silver. Demand for physical metals is through the roof right now.
Time will tell if my Excess Phase Peak pattern plays out as I expect or if we rally to new ATHs.
Obviously, this sideways rollover topping pattern could present a breakaway in either direction.
Again, my patterns are not correlated based on news or other events. They are strictly price-based.
Get some...
#trading #research #investing #tradingalgos #tradingsignals #cycles #fibonacci #elliotwave #modelingsystems #stocks #bitcoin #btcusd #cryptos #spy #gold #nq #investing #trading #spytrading #spymarket #tradingmarket #stockmarket #silver

Update into the closeSPY is at resistance. OIL looks like a C wave. My feeling is there could be a swift down move on SPX futures overnight. I'm wrong if we open above 602 on SPY tomorrow

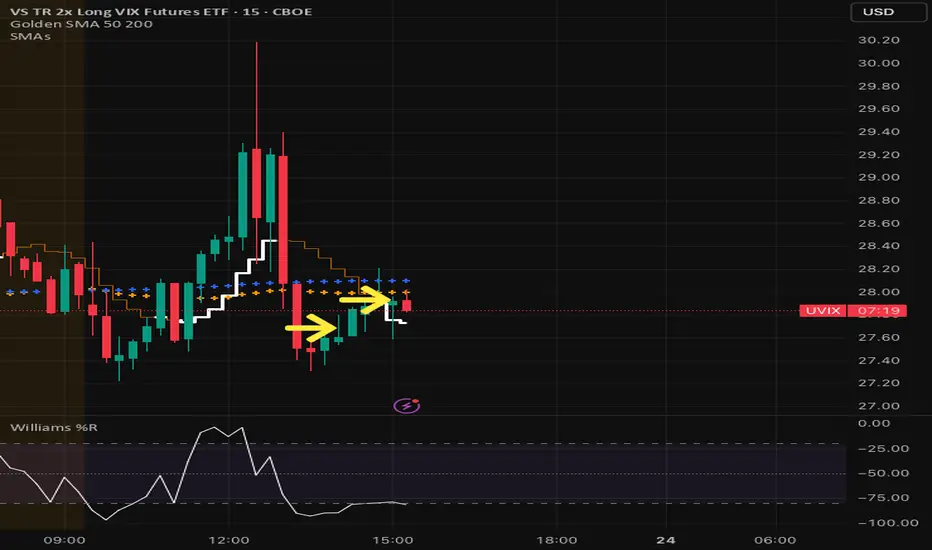
UVIX entry signal looks strongVIX is spiking bc of the market weakness. Looks like a good time to get in!
Always do your own due diligence and best of luck!
Monday UpdateSPX and SPY both look like they are trying to decide if the 18ma will hold as support or not, we have to wait for the close. Gold looks like it wants to go higher. Oil and Natural Gas as well. I forgot BTC, I'll do it tomorrow.

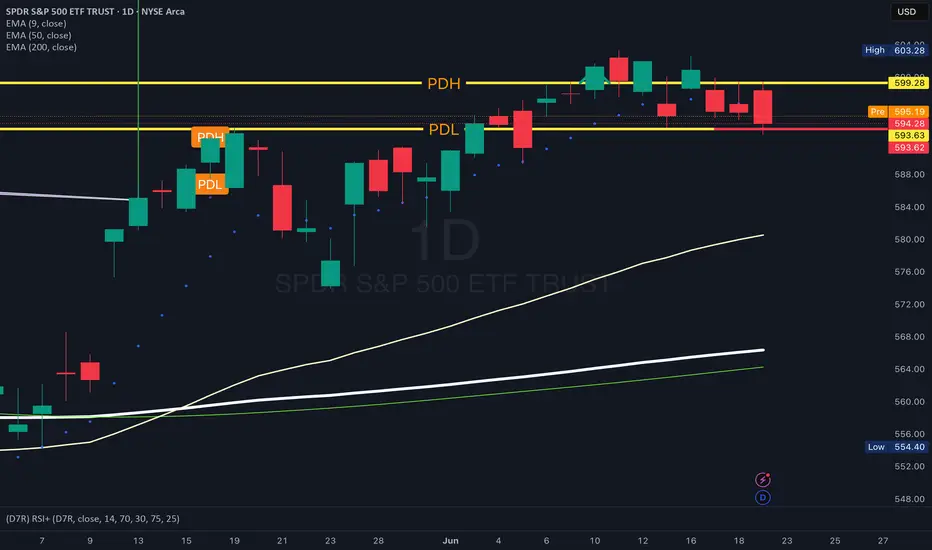
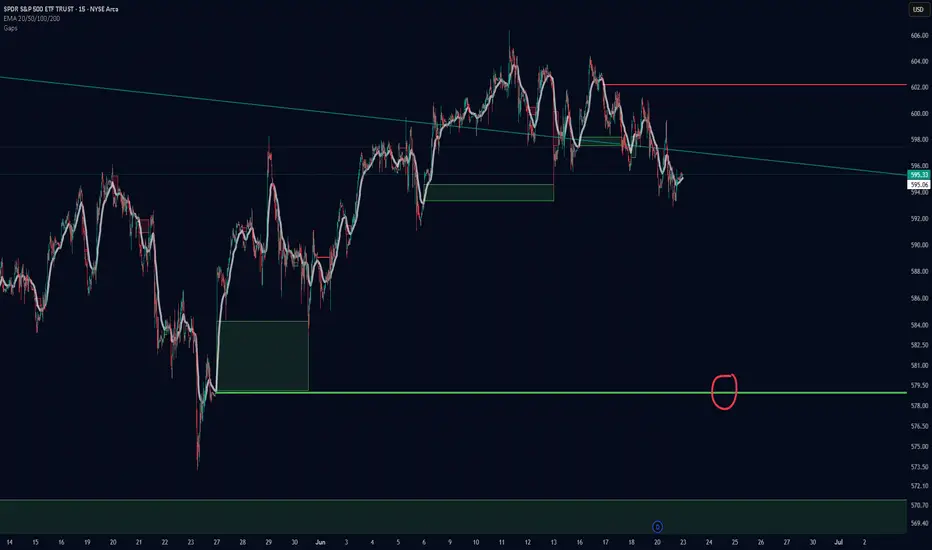
SPY- Premarket readPre-Market Read – June 23
AMEX:SPY
Premarket High: 595.15
Premarket Low: 592.15
Bias: Leaning Bearish
Price got rejected again at that 600–602 zone — that’s been a wall.
All the EMAs (9/50/200) are stacked tight, which usually means something’s brewing.
Institutions bought heavy down around 572–579 — they’re already green, so they might start selling into strength.
I’m expecting chop between 593–595 off the open.
I’ll probably wait out the first 15 min and let the ORB build.
If we break out, I’m watching both sides, but I lean put.
SPY/QQQ Plan Your Trade For 6-23 : CRUSH PatternToday's CRUSH pattern suggests the markets will struggle to find any support for a rally. A CRUSH pattern is usually a large breakdown type of price bar that moves aggressively against the dominant trend.
Som, today I'm expecting some fairly large price action and I believe the markets may start a breakdown move this week as we continue to get more news related to the Israel/Iran/US conflict.
This week will be a "resettling" week in my opinion. Buyers will start to actively liquidate and reposition assets as we move deeper into this conflict. When buyers turn into sellers (to get out), the markets usually react very aggressively in trend.
Metals continue to hold up without making any big moves. I believe the increased FEAR level could play out as a moderate rally for metals over the next 15-30+ days.
BTCUSD broke down very hard (more than 6%) over the past 3-4+ days. This is a big move downward for Bitcoin and could suggest US technology stocks/sectors could also collapse on fear of a "rollover top" in the US stock market.
Smart traders will hedge and pull capital away from this potential top - just like I've been suggesting for the past 2-3+ weeks.
Oddly enough, if we do get a rollover/top this week because of the Iran conflict, it plays right into my Excess Phase Peak pattern and the predictions I've been making over the past 4+ months.
No, I don't foresee events like this Israel/US/Iran conflict. I can't see into the future.
What I can do, and continue to try to deliver, is the best analysis I can offer without becoming BIASED by indicators, comments, or other inputs.
I just read the chart and will tell you what I see as the most likely outcome.
Get some..
#trading #research #investing #tradingalgos #tradingsignals #cycles #fibonacci #elliotwave #modelingsystems #stocks #bitcoin #btcusd #cryptos #spy #gold #nq #investing #trading #spytrading #spymarket #tradingmarket #stockmarket #silver

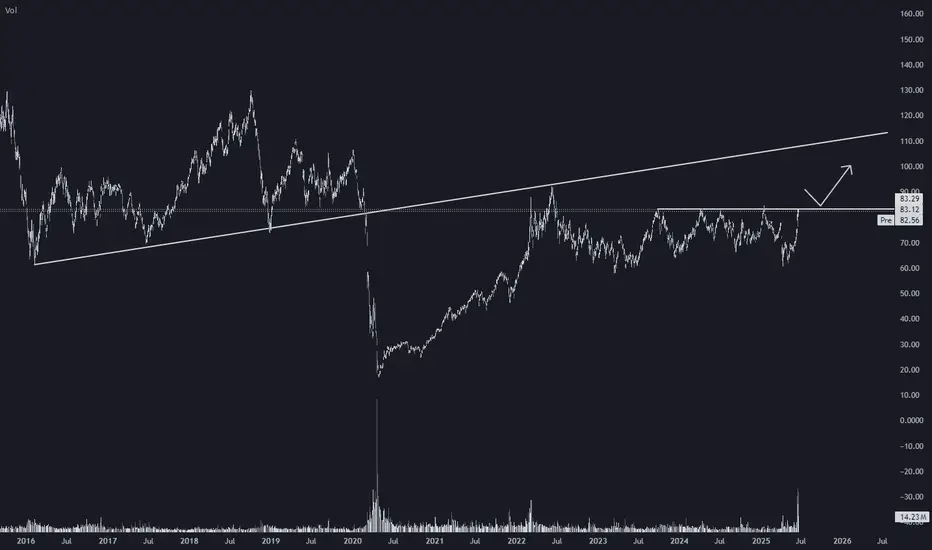
Major Resistance Test for OilUSO trying to break above the $83 area for the fifth time since 2023 here. If it can manage to do so I'd be expecting a much bigger move. Potentially all the way up to the trendline above or the high from 2022 around $93.
Ideal long entry would be on a break and retest of $83, or just longing on the break since it could be a while before it retests. Just have to be careful for a potential fake out which could lead to yet another big rejection.
SPY 500 BreadthCurrently see weakness on the breadth of the S&P500. We go back below the 9-EMA and could head back down to the gap-fill area. For now I'm working on my watchlist and looking for potential bounces on leading stocks.

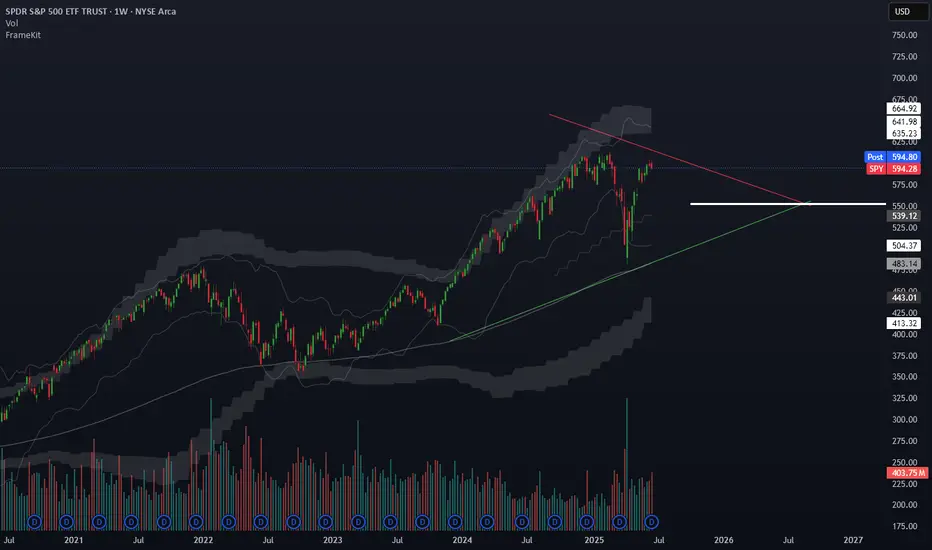
SPY: ASI DIMENTION SHIFT TRADESPY: ASI Dimension Shift Trade
Markets are no longer responding to human logic—they're reacting to macro compression and machine foresight.
This trade captures the inflection point where AI and capital collide.
📌 Watch:
AMEX:SPY holding above 532 = dimension support
Breakdown below 518 = confirmation of SMC exit
VolanX signal: “Shift registered. Volatility node expanding. Defensive alignment required.”
#SPY #VolanX #SMC #AITrading #ASIDimension #MacroBreakout #WaverVanir
579 spy incoming?I posted this a week or so ago. I think we are finally going to have the momentum, or lack thereof, to make it down to fill the rest of that gap. I have noticed that large gaps that leave a small gap below(you must adjust the indicator to show it) almost always get filled before continuing up. This 579 level also matches up perfectly with the 20ema on the weekly which should provide further support. I will be looking for this level all week while being aware of any short squeezes that could occur on the way down. Will definitely go long at this 579 level as I think we will have a very green July.
Weekly $SPY / $SPX Scenarios for June 23–27, 2025🔮 Weekly AMEX:SPY / SP:SPX Scenarios for June 23–27, 2025 🔮
🌍 Market-Moving News 🌍
🌐 Geopolitics Add to Risk Aversion
The S&P 500 is up about 0.9% so far in June, but analysts warn it’s facing a “precarious” phase amid renewed Middle East conflict and looming U.S. tariff deadlines in July–August. Elevated oil prices could fuel inflation, while fiscal and debt ceiling pressures weigh on sentiment
🎙️ Powell Heads to Capitol Hill
Fed Chair Powell will testify before Congress this week. His remarks on inflation and rate outlook—particularly regarding the Fed’s recent dot-plot revisions and monetary policy uncertainty—will be central to market direction
📈 Nike, FedEx & Micron Earnings Under Focus
Key corporate earnings (Nike, FedEx, Micron) could provide fresh insight into how tariffs and supply-chain disruptions are impacting major U.S. businesses
🛢️ Oil Prices Elevated
Oil remains range-bound at multi-week highs near $75–80/bbl following U.S.–Israel military action in Iran, which briefly spiked prices ~7–11%. Continued dependence on Middle Eastern supply may keep energy complex volatile
⚖️ NATO Summit Tightens Security Focus
NATO leaders meet in The Hague, marking an elevated global defense posture amid geopolitical uncertainty. Defense and aerospace stocks may remain pressured or volatile depending on summit outcomes
📊 Key Data Releases & Events 📊
📅 Monday, June 23
9:45 AM ET: S&P Global Flash U.S. Services & Manufacturing PMI (June)
10:00 AM ET: Existing Home Sales (May)
📅 Tuesday, June 24
10:00 AM ET: Consumer Confidence Index (June)
Testimony: Fed Chair Jerome Powell appears before Congress
📅 Wednesday, June 25
10:00 AM ET: New Home Sales (May)
📅 Thursday, June 26
8:30 AM ET: Advance Q1 GDP (Final Estimate)
📅 Friday, June 27
8:30 AM ET: Core PCE Price Index (May) — Fed’s preferred inflation gauge
⚠️ Disclaimer:
This is for educational and informational purposes only. It does not constitute financial advice. Always consult a licensed financial advisor before investing.
📌 #trading #stockmarket #economy #geopolitics #Fed #oil #charting #technicalanalysis
exposing the inner workings of the illusive 'black box'Black box reveal
I was debating whether i'd ever share this publicly, but i came to an agreement with myself and decided to share this out of commission model. With the knowledge that comes with understanding predictive quant models, I was able to derive patterns the had arisen in the market via matching algorithms which gave me the ability to predict where a market was likely to open, make a high, make a low, and close on any given day where no news was being priced in. I was always told to keep my findings private, but no one wins if I do that, so I decided to share and the individuals that have the ability and care to figure out the puzzle for themselves can do so with this as a starting point. Im writing this post in one take so I apologize for any grammatical errors. In tradingview's LEAP challenge i've kinda been blowing my account over the last week and have just under 80% profit and no open positions with a week to go before it ends, so this post is also for people to look back and see if intraday trading can catapult my account. Good luck to all the participants!
Stock Market Forecast | TSLA NVDA AAPL AMZN META MSFTStock Market Forecast | !nq1! !es1! SPY QQQ
Mag 7 Forecast | NASDAQ:TSLA NASDAQ:NVDA AAPL AMZN META MSFT GOOG

SPY: Expecting Bullish Continuation! Here is Why:
Balance of buyers and sellers on the SPY pair, that is best felt when all the timeframes are analyzed properly is shifting in favor of the buyers, therefore is it only natural that we go long on the pair.
Disclosure: I am part of Trade Nation's Influencer program and receive a monthly fee for using their TradingView charts in my analysis.
❤️ Please, support our work with like & comment! ❤️
Uranium The Epic Explosion!Global uranium demand is up to rise about 28% by 2030, driven by clean-energy pushes, nuclear restarts (e.g., Japan), and advanced modular reactors
Kazakhstan’s largest producer, Kazatomprom, cut its 2025 production forecast by ~17% due to logistical hurdles and resource constraints
Iran signaled openness to discussions with European counterparts aimed at curbing its uranium enrichment levels. However, seasoned diplomacy and regional conflict issues complicate prospects for an agreement
Bottom line: Uranium markets are tightening due to production cuts and geopolitical risk, while long-range demand is gaining momentum thanks to nuclear expansion and emerging energy technologies.

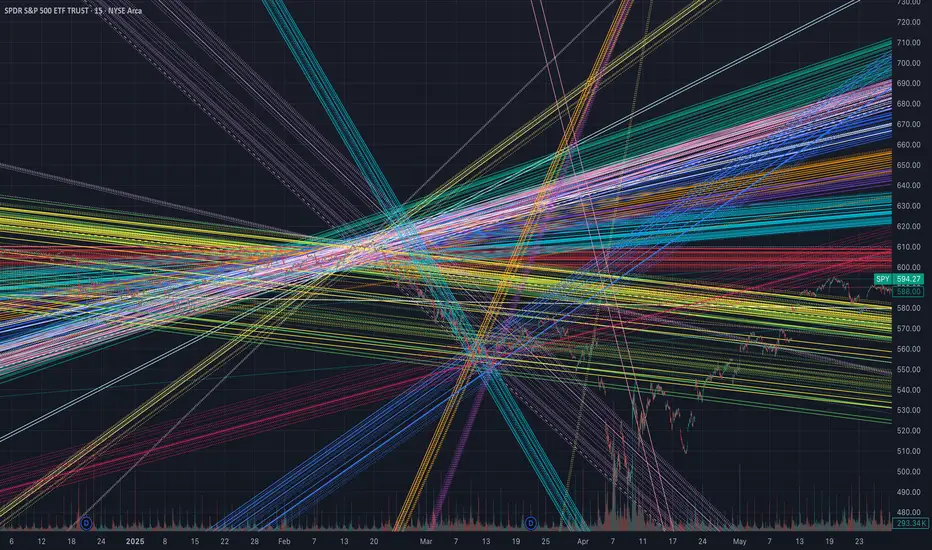
Low frequency trading (LFT) vs HFTHey fellow tarders and financial mojol,
I've got some insider info that's going to blow your minds! 🤯
According to my top-secret sources (aka my pet parrot who squawks numbers at me), low-frequency trading algorithms have finally figured out the true fair price of the S&P 500. Drumroll, please... It's $550! That's right, folks, all those high-frequency trading bots are currently aiming for this magical number as we speak.
But wait, there's more! The next step in this thrilling financial adventure involves radiowaving all the way down to $400. Yes, you heard it here first. We're talking about some serious next-level trading strategies that involve actual radio waves. Who needs fiber optics when you've got good old-fashioned radio, right?
So, buckle up and get ready for the ride of your life. The market's about to take a trip back to the good old days when $550 was the dream and $400 was just a stone's throw away.
Happy trading, and remember, if your broker gives you weird looks, just tell them you're tuning into the market's frequency! 📡💸
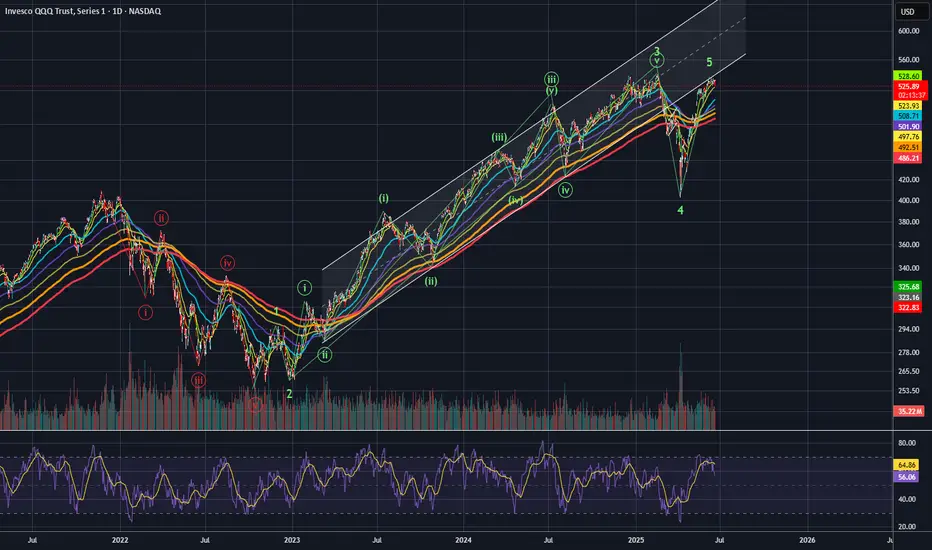
long term short on QQQ level $501 and 465there some level i would like to to look for on QQQ$
Main target is level $465- 495 -$ 501
Disclaimer- it a opinion