Friday updateSPY likely put in an ABC, I expect lower for most of today. Gold probably higher for now. Oil is just consolidating. NG looks like a buy. BTC i think will breakdown under 100k over the weekend.
ETF market

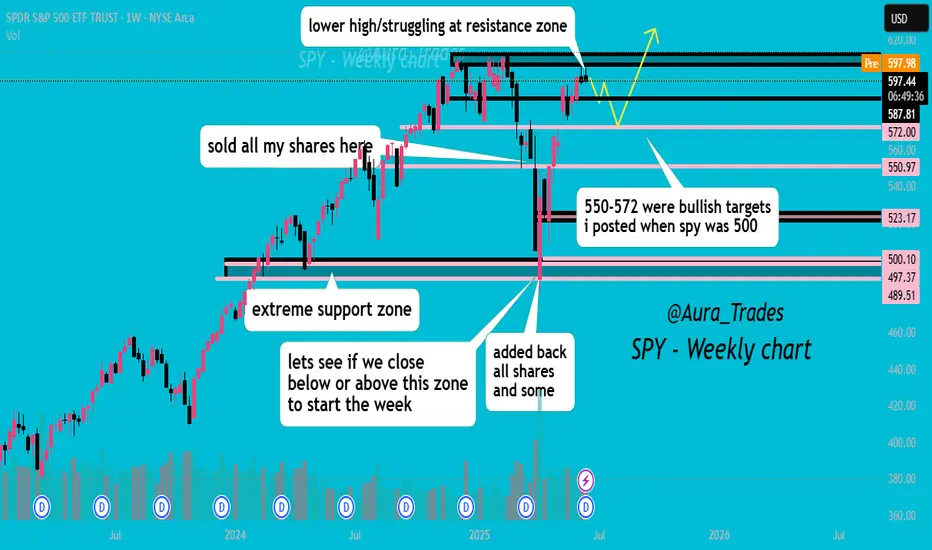
bullish targets smashed ;)spy broke my bullish targets i posted when it was 500, now struggling with a lower high at resistance zone, push down to 572-580 or so is possible before they try to push for all time highs🚀
boost and follow for more 💖
SPY/QQQ Plan Your Trade For 6-20 : Pause Bar PatternToday's Pause Bar pattern suggests the SPY/QQQ will slide into a sideways type of PAUSE in price action today. I'm not expecting much to happen and if we do see any breakaway or breakdown trending it will likely be related to news.
While we have options expiration today and a host of other things that could drive the markets, I believe the markets are struggling to find direction right now. Thus, a pause in trading would be somewhat normal after a holiday-shortened trading week.
Gold and Silver are struggling after a brief rally last week. I believe this is fear related to the Israel/Iran conflict. Metals should continue to move higher.
BTCUSD is slightly higher (forgot to cover BTCUSD in the video), but not moving into a breakaway phase.
Overall, everything is very flat in early trading today. It may stay that way with my PAUSE BAR pattern.
Get some.
#trading #research #investing #tradingalgos #tradingsignals #cycles #fibonacci #elliotwave #modelingsystems #stocks #bitcoin #btcusd #cryptos #spy #gold #nq #investing #trading #spytrading #spymarket #tradingmarket #stockmarket #silver

18.35This channel is not providing individualized trading or investment advice, nor is it a banking service, brokerage service, trading service, investment service or money management service
Boil proved good 30%

Five investment in Fusion Energy EFT'sFusion generation is coming on line in the next five years. This is a list of ETF's which track the Fusion generation companies.
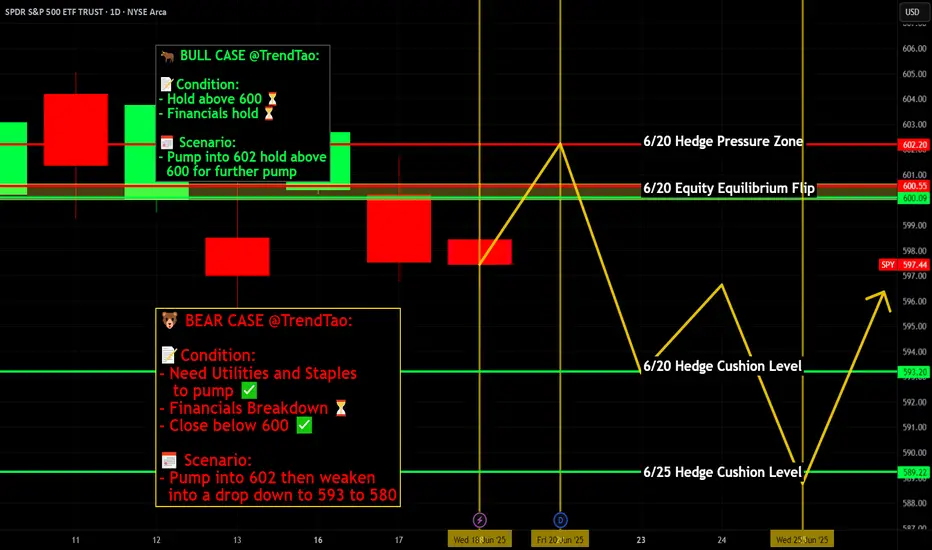
Nightly $SPY / $SPX Scenarios for June 20, 2025🔮 Nightly AMEX:SPY / SP:SPX Scenarios for June 20, 2025 🔮
🌍 Market-Moving News 🌍
🏦 Fed Holds Rates, Warns on Tariffs
Fed kept interest rates steady on June 19, cautioning that tariffs could stoke inflation and slow growth. Inflation projections were raised from 2.7% to 3.0%, while growth estimates were revised lower to 1.4%
🌍 Middle East Risk Drags Markets
Global stocks fell and safe-haven assets surged after U.S. futures weakened amid heightened tensions in the Israel–Iran conflict. Yields were mixed: gold weakened and bonds gained, while oil held steady near seven-week highs
📈 Treasury Yields Edge Higher
Despite safe-haven demand, U.S. 10‑year yields ticked up as markets absorbed the Fed’s updated rate outlook. The yield curve remains elevated ahead of next week’s $38 bn auction of long-dated notes
📊 Key Data Releases 📊
📅 Friday, June 20:
(No major U.S. economic reports)
Markets will be driven by Fed commentary follow-ups and geopolitical headlines over the weekend.
⚠️ Disclaimer:
This information is for educational and informational purposes only and should not be construed as financial advice. Always consult a licensed financial advisor before making investment decisions.
📌 #trading #stockmarket #economy #geopolitics #fixedincome #inflation #charting #technicalanalysis
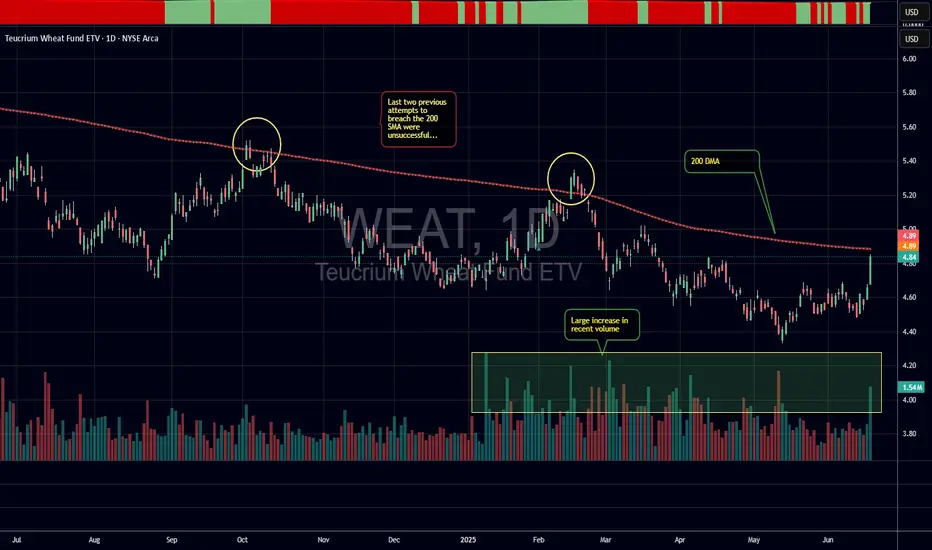
WEAT on the move?Wheat futures (ZW) have cleared a zone of resistance with a 4.6% one day move. As tracked by the WEAT ETF, current price seems to be heading for a retest of the 200 Daily SMA (currently at $4.90). The 200 Daily SMA has reversed previous attempts to break out in October 2024 and February 2025. Will third time be different?
Note that this ETF reached a high over $12 in 2022 when the Russian/Ukrainian war started.
Choppy daySPX closed under the channel trendline which I think bodes well for bears. Gold looks like it's breaking down. Nat Gas looks strong. USOIL looks like it will go higher. BTC is at support.

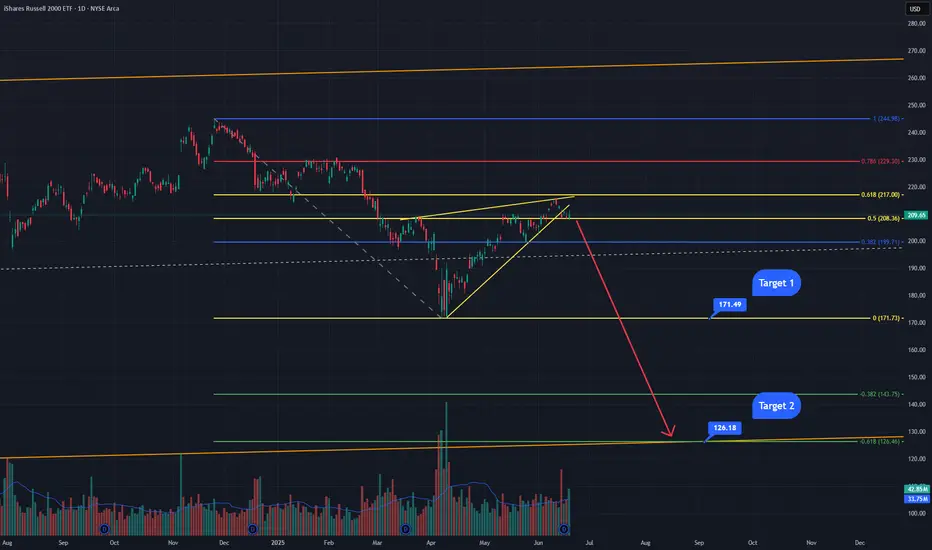
Small Caps about to get SlammedThe IWM has been trading inside this upward sloping wedge/bear flag for a few months. It just broke the bear flag this week and then tested the underside of it as resistance before getting rejected. This area also happens to be a golden pocket retracement zone from a Fibonacci I have drawn from the all-time highs made in November of last year to the lows made 2 months ago in April. The next probable move is back down to target 1 at the bottom of the Fibonacci retracement at $171. These golden pocket retracements have a very high probability of moving back down to the bottom of the retracement, sometimes breaking lower. This area at $171 has a lot of support but if it breaks, I expect it to come down to the orange line which is an upward sloping paralell channel that the IWM has been trading in since the financial crisis of 2008. The bottom of said channel connects the 2009 lows through the covid lows of 2020. This area also happens to be the -0.618 Fibonacci retracement area, it would be the 3rd hit of the bottom this major weekly channel and would very likely contain the lows for the current bear market.
SPY/QQQ Plan Your Trade For 6-19: GAP Reversal Counter TrendToday's pattern is a GAP Reversal in Counter Trend mode. I believe this could represent a breakdown in the ES/NQ as the US stock market is closed for the Juneteenth holiday.
Obviously, after the Fed comments yesterday (stating "uncertainty") and with the continued Israel/Iran conflict playing out, it makes sense to me that the US markets would move into a pre-weekend consolidation phase.
Even though the US stock market will be closed, the futures market will likely stay open and will carry some general market sentiment and reactions to news.
Watching Gold/Silver and Bitcoin should be very interesting today. I suspect the markets will continue to consolidate downward today - leading to a potential breakdown seeking support day on Friday.
Buckle up. We'll likely have 3-5+ days of news related to the Israel/Iran conflict and other issues over this weekend. It could be very interesting to see how the global markets move through this news.
Get some.
Happy Juneteenth
#trading #research #investing #tradingalgos #tradingsignals #cycles #fibonacci #elliotwave #modelingsystems #stocks #bitcoin #btcusd #cryptos #spy #gold #nq #investing #trading #spytrading #spymarket #tradingmarket #stockmarket #silver

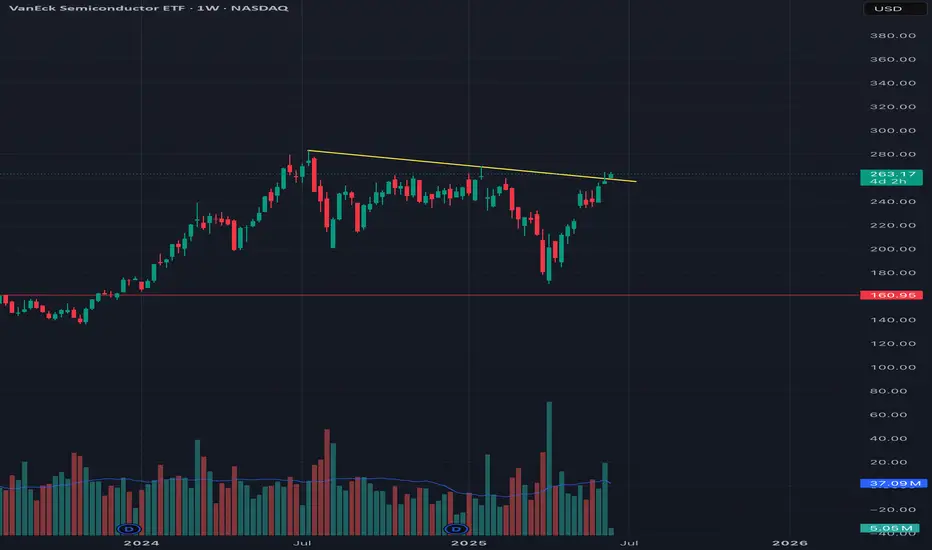
Semiconductors into MAJOR resistanceAs you can see from this weekly chart, the semiconductors have tried three different times to get above this trend line and have gotten rejected all three times. Could it go higher from here? Of course it could, but you have to ask yourself what are the probabilities that it will continue to go up through all this heavy resistance? Not very good is the answer. A close above last weeks candle would confirm a breakout, otherwise, bearish view remains intact.
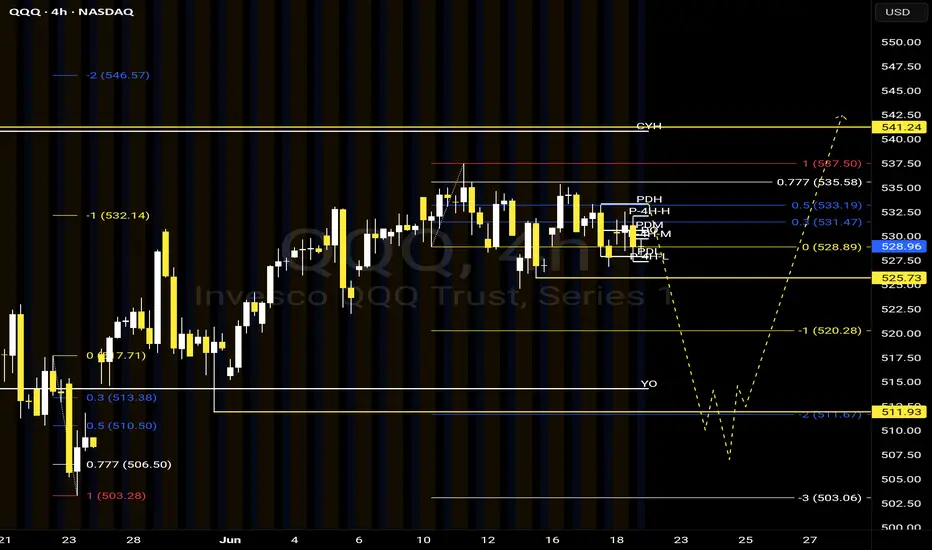
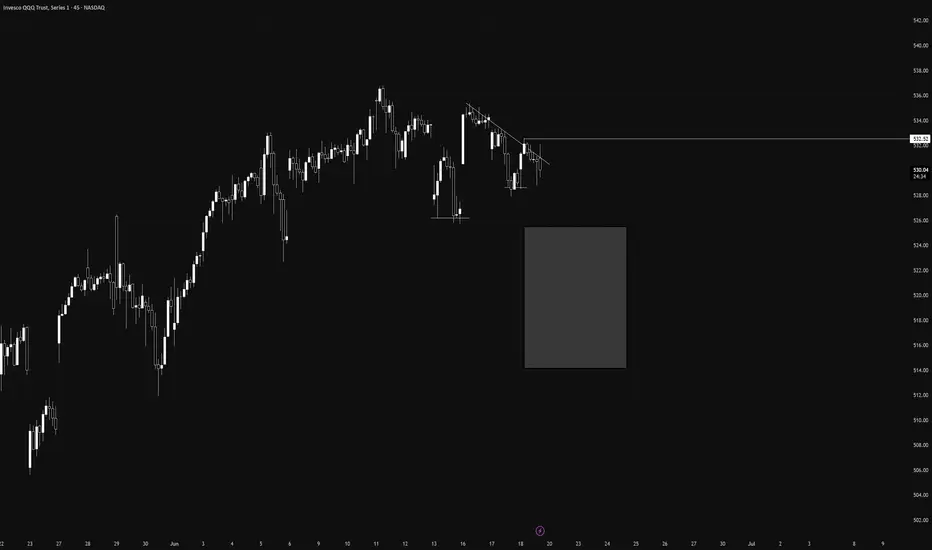
QQQ Potential *Short Term Bearish SetupAfter studying the HTF here is what I am seeing as a potential setup forming.
We formed a HTF MSS on the 4H close to ATH leaving an epic equal high to come back to later. I am looking for a candle body closures *BELOW lows to confirm as we leave the MSS yellow zone and head to TP1 (-1). Once we approach TP2 (-2) we are entering another HTF BULLISH MSS. If this zone holds and we start seeing candle *BODY closures *ABOVE highs then my bias will no longer be bearish.
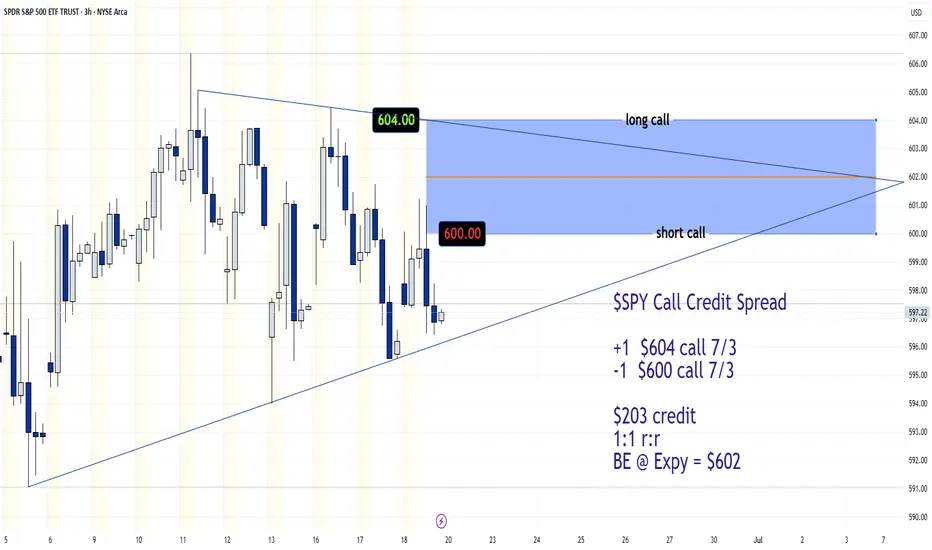
$SPY Call Credit Spread for 7/3 Expy IdeaAMEX:SPY Call Credit Spread
+1 $604 call 7/3
-1 $600 call 7/3
~$200 credit
1:1 risk:reward
Breakeven @ Expy = $602
We'll see...
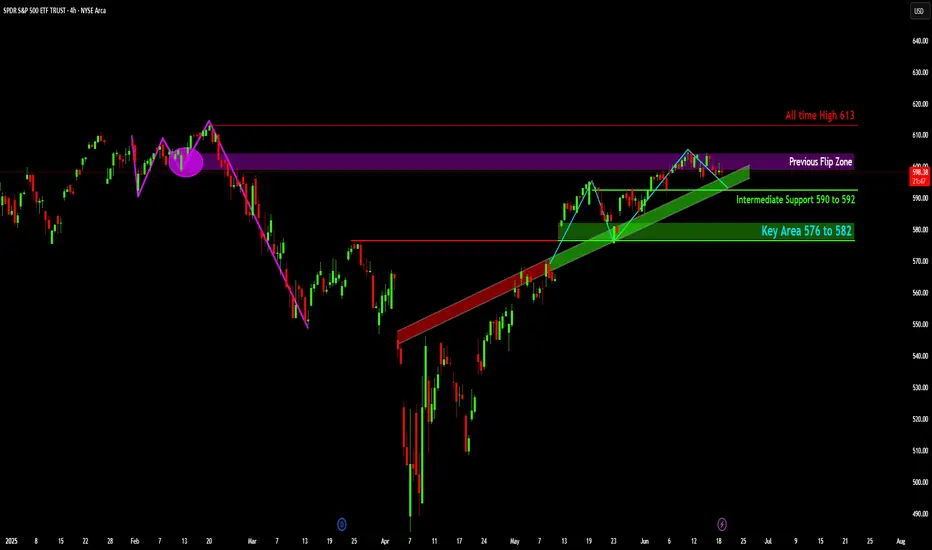
SPY: What's Next After the Resistance Retest?
The price action of SPY, shows a significant decline from early February highs, followed by a strong recovery and an established uptrend from mid-April.
Price is currently testing the "Previous Flip Zone" (indicated by the purple shaded area), a level that previously acted as support before the market's sharp decline and has since been retested as resistance.
The "All time High 613" is marked as a major overhead resistance level, representing the peak achieved before the February drawdown.
An "Intermediate Support" zone is identified between 590 and 592, coinciding with the upward-sloping green trendline that has supported the recent rally.
A "Key Area" of support is highlighted further down between 576 and 582, indicating a more substantial demand zone should the intermediate support be breached.
Disclaimer:
The information provided in this chart is for educational and informational purposes only and should not be considered as investment advice. Trading and investing involve substantial risk and are not suitable for every investor. You should carefully consider your financial situation and consult with a financial advisor before making any investment decisions. The creator of this chart does not guarantee any specific outcome or profit and is not responsible for any losses incurred as a result of using this information. Past performance is not indicative of future results. Use this information at your own risk. This chart has been created for my own improvement in Trading and Investment Analysis. Please do your own analysis before any investments.
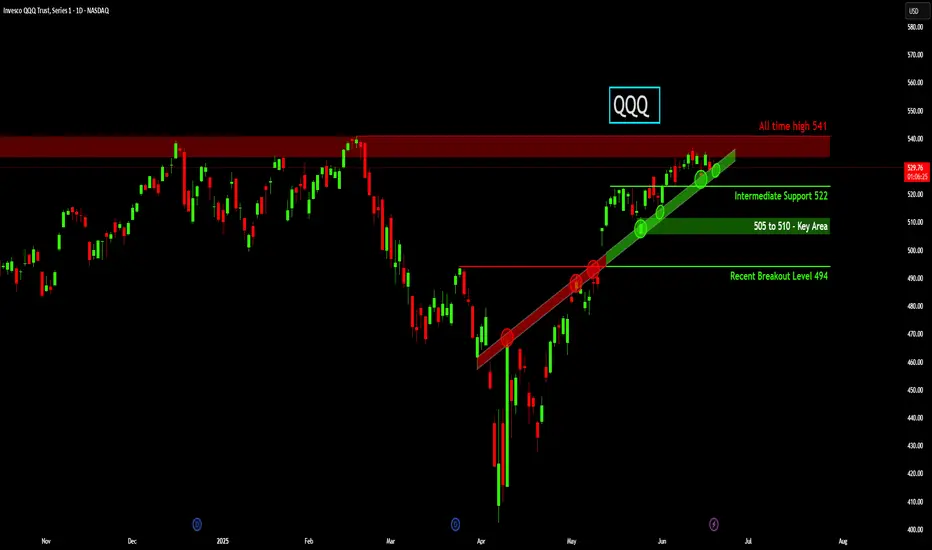
QQQ: All-Time High Resistance vs. Strong Trendline Support• Approaching All-Time High Resistance: QQQ is currently trading directly beneath its all-time high of $541 and is encountering a robust overhead resistance zone, indicating a critical test for bullish momentum.
• Strong Ascending Trendline Support: The price action is consistently supported by a well-defined ascending trendline (green), which has successfully held on multiple tests, signaling an intact short-term bullish trend.
• Key Horizontal Support Levels: Below the current price, immediate support is identified at $522, with a more substantial "Key Area" of demand observed between $505 and $510, offering deeper potential support.
• Prior Trend Reversal Confirmed: Earlier in the chart, QQQ successfully broke above a significant descending resistance trendline (red), which had previously capped rallies, confirming a shift from a bearish to a more bullish market structure.
• Foundational Breakout Level: The $494 level, marked as a "Recent Breakout Level," now acts as a key historical resistance-turned-support, providing a foundational base for the current upward movement.
Disclaimer:
The information provided in this chart is for educational and informational purposes only and should not be considered as investment advice. Trading and investing involve substantial risk and are not suitable for every investor. You should carefully consider your financial situation and consult with a financial advisor before making any investment decisions. The creator of this chart does not guarantee any specific outcome or profit and is not responsible for any losses incurred as a result of using this information. Past performance is not indicative of future results. Use this information at your own risk. This chart has been created for my own improvement in Trading and Investment Analysis. Please do your own analysis before any investments.
QQQ Put level 513 The main reason it has been two regetetion on two levels it on a down trend for short term.
And with the wars that is Happening and the market are closed on thursday we dont know what is going to happend friday.
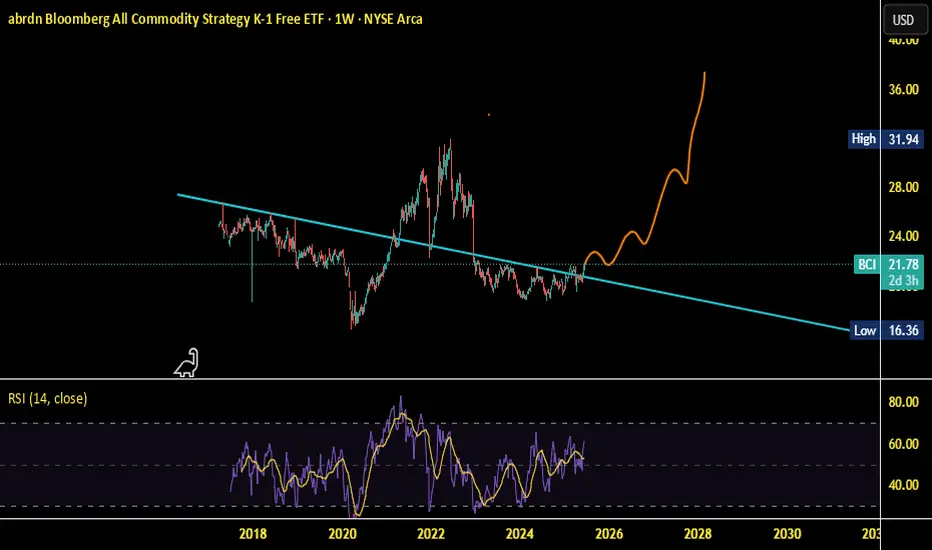
BCI Commodities Bull CycleThere is a strong supply line that is being broken by the chart, above this line there appears to be high volatility, which is also matching up with tensions in the Middle East in regards to Crude prices. Perhaps the move is equities to commodities soon.
At A Stand Still Until FOMCAll eyes on FOMC
holding 600 have to see what he says also 1st move wrong one so we want rally first

SPY/QQQ Plan Your Trade For 6-18 : GAP Potential PatternToday's GAP Potential pattern suggests the SPY/QQQ may GAP a bit higher at the open, then move into a melt-up phase, trying to identify resistance, then roll into a topping pattern and move downward.
I believe the recent "rollover" of the markets (initiating last Friday with the Israel/Iran conflict) is still dominating the markets and news related to the ongoing conflict could drive a moderate pullback in US assets.
Headed into the Juneteenth holiday (Thursday, June 19), I suggest traders prepare for the US markets to move into somewhat of a SETTLEMENT mode today - where traders don't want to hold too many open positions into Friday's trading.
Additionally, Gold and Silver could move into a very strong upward price move over the next 4-5+ days. So be prepared for metals to hedge risks when the US stock market is closed.
BTCUSD seems to be struggling into the FLAG APEX. I'm waiting to see if my FLAG count is correct and if we get the breakdown in BTCUSD as I expect.
Get some.
#trading #research #investing #tradingalgos #tradingsignals #cycles #fibonacci #elliotwave #modelingsystems #stocks #bitcoin #btcusd #cryptos #spy #gold #nq #investing #trading #spytrading #spymarket #tradingmarket #stockmarket #silver

DRIP — Geopolitical Oil Risk Creates a Buying OpportunityDRIP (inverse 2x ETF on US oil & gas exploration/production) is approaching a key technical support zone.
While oil may continue rising short term due to geopolitical tensions — especially US-Iran risks and Middle East instability — this short-term pressure could push DRIP lower toward the $5.00–6.00 area. That zone aligns with strong historical reversal points and trend support. From there, a rebound toward $12.00–20.00 is technically and fundamentally possible, offering 30–50%+ profit potential. I’m planning staged entries in the marked range, managing risk with awareness of commodity market volatility and global uncertainty.

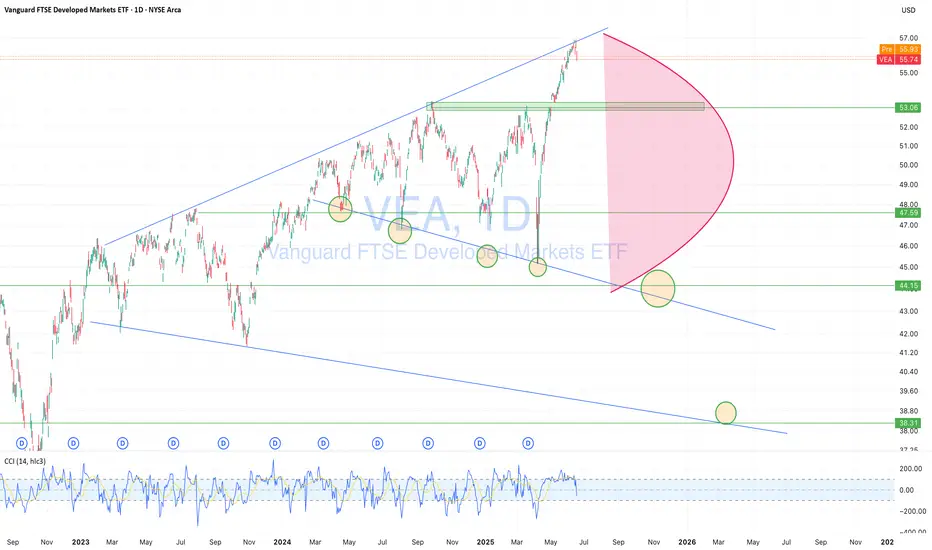
Rising Geopolitical Tension (Iran Conflict) Signals Market RiskMoving Partially to Cash (VEA, QQQ, TQQQ, SPY, TECL, SOXL)
The global market is entering a high-risk environment. Geopolitical escalation, particularly the growing threat of direct US involvement in a military conflict with Iran, is pushing global uncertainty to new highs. Tensions in the Middle East, rising oil and gold volatility, and increased friction between major world powers all point toward a potential market breakdown. On the chart, VEA ETF is showing signs of topping out within a rising wedge pattern. Meanwhile, institutional funds are starting to reduce exposure to high-risk assets. I'm taking partial profits and shifting to cash across VEA, QQQ, TQQQ, SPY, SOXL, and TECL to preserve gains. Buy-back zones are set around 53.00, 48.00, and 44.00. In an environment of global escalation and rapid risk-off sentiment, active portfolio defense is more important than passive hope.
Trading the VIX – Part 2Trading the VIX – Part 2: VIX ETPs and Strategic Applications
In Part 1 of this series, we explored the structure of VIX Futures, focusing on the roll-down effect in a contango VIX futures curve—common in calm market conditions.
In Part 2, we turn our attention to VIX-related Exchange-Traded Products (ETPs)—specifically, the popular and liquid:
• VXX – unleveraged long VIX ETP
• UVXY – leveraged long VIX ETP
• SVXY – inverse VIX ETP
Each of these products is based on a specific VIX futures strategy, the “S&P500 VIX Short Term Futures Index” , which is maintained by S&P, Dow Jones (the “SPDJ-Index”). The Fact Sheet and Methodology can be obtained from the S&P Global website.
What is the SPDJ Index that these ETPs track?
The SPDJ-Index is a strategy index that maintains a rolling long position in the first- and second-month VIX futures to maintain a constant 30-day weighted average maturity.
Key Features of the SPDJ Index:
• Starts with 100% exposure to VX1 (the front-month future) when it’s 30 days from expiration.
• Gradually it rolls from VX1 to VX2 (next-month future) each day to maintain a 30-day average expiration.
• At all times, the index is long either one or both VX1 and VX2, with exposure shifting daily from VX1 to VX2.
• This roll mechanism causes value erosion in contango (normal markets) and gains in backwardation (during volatility spikes).
• Since contango is the dominant market state, the index loses value over time—with occasional short-lived gains during sharp volatility increases.
Importantly, the SPDJ Index does not represent the VIX or any other volatility level, it simply reflects the value of this futures-based rolling strategy.
________________________________________
Breakdown of the ETPs: VXX, UVXY, and SVXY
VXX – Long SPDJ Index (1x)
• Tracks the SPDJ Index directly
• Suffers from the roll-down drag in contango environments.
• Useful only for short-term exposure during expected volatility spikes.
• Timing for long positions is critical
UVXY – Leveraged Long (Currently +1.5x)
• Replicates a strategy that maintains a constant leverage of 1.5 to the SPDJ Index.
• Formerly +2x leverage; reduced in April 2024.
• Highly sensitive to VIX moves; underperforms long term due to both roll-down drag and leverage decay (see below). Timing for long positions is even more important than for the VXX.
SVXY – Inverse (-0.5x)
• Replicates a strategy that maintains a constant exposure of -0.5 to the SPDJ Index.
• Benefits from falling VIX levels as well as from contango in the front part of the VIX futures curve.
• Formerly -1x before the Feb 2018 volatility spike triggered massive losses (XIV, a competing ETP, collapsed at that time).
• Performs well in calm conditions but is vulnerable to sharp volatility spikes.
Leveraged & Inverse ETPs – Important Notes affecting the UVXY and SVXY (without going into details):
• Daily resetting for the replicating strategies to maintain constant exposure factors (different from 1x) are pro-cyclical and can cause compounding errors, specifically in turbulent markets (e.g. Feb 2018).
• The real volatility of the VIX futures itself acts as a drag on returns, independent of the index’s direction.
• Risk management is essential—especially with inverse products like SVXY.
All three of these ETPs track a VIX futures strategy, they are not levered or unlevered versions of the original VIX index. Each of these ETPs benefits from liquid option markets, enhancing the toolkit for volatility trading.
Trading Strategies Using VIX ETPs
Here are several practical approaches to trading these products:
VXX and UVXY
• Best used for short-term trades aiming to capture volatility spikes.
• Options strategies such as zero-cost collars, vertical and calendar spreads can help mitigate the challenge of precise timing.
• Avoid long-term holds due to erosion from roll-down and leverage decay (see historical performance!).
SVXY – The Carry Trade Proxy
• Ideal for profiting from prolonged calm periods and the contango structure.
• Acts like a carry trade, offering a positive drift—but must be paired with robust stop-loss rules or exit strategy to guard against sharp spikes in volatility.
Switching Strategies
• Tactically rotate in/out of SVXY based on short-term volatility indicators.
• One common signal: VIX9D crossing above or below VIX, i.e. long SVXY if VIX9D crosses under VIX, staying long while VIX9D < VIX, closing long SVXY position when VIX9D crosses over VIX. Some traders also use crossovers with VIX3M or the individual expirations of the VIX futures curve to manage entries.
• Switching between SVXY and VXX based on crossover triggers through the VIX futures curve is often advertised, but very hard to get working in practice due to the importance of timing the VXX entry and exit – signals from the VIX curve may not signal VXX entries and exits timely enough.
Term Structure-Based Combinations
• Combine short VXX with long VXZ (an ETP tracking longer-dated VIX futures, balancing the 4th to 7th VIX contracts to achieve a constant expiration of 60days).
• Weighting is determined by the Implied Volatility Term Structure (IVTS), calculated as VIX / VIX3M. This approach adjusts positions based on the shape of the VIX futures curve, indicated by the IVTS. For instance, when the VIX futures curve shifts from contango (where near-term futures are cheaper than longer-term ones) to backwardation (where near-term futures are more expensive), it involves reducing short positions in VXX and increasing long positions in VXZ.
• This approach mimics the spirit of a calendar spread strategy in VIX futures and reflects the “S&P 500 Dynamic VIX Futures Index” , with weightings backed by research from Donninger (2011) and Sinclair (2013) - see performance chart and weighting-matrix enclosed in the introductory chart).
________________________________________
VIX Curves as Market Indicators
Beyond trading, VIX instruments and their term structure are widely used as market sentiment gauges. For instance:
Signs of Market Calm:
• VIX9D < VIX
• VIX < VIX3M
• VIX < VX1
• VX1 < VX2
These relationships imply that short-term volatility is lower than longer-term expectations, indicating near-term calmness in markets, occasionally leading to market complacency.
Traders and institutions use these signals to:
• Adjust positioning in broad market indices
• Determine hedging requirements
• Evaluate suitability of selling naked options
________________________________________
Final Thoughts
VIX ETPs offer a powerful toolkit for traders seeking to profit from or hedge against volatility. But they come with structural decay, leverage dynamics, and curve risk. Timing, strategy, and risk control are key.

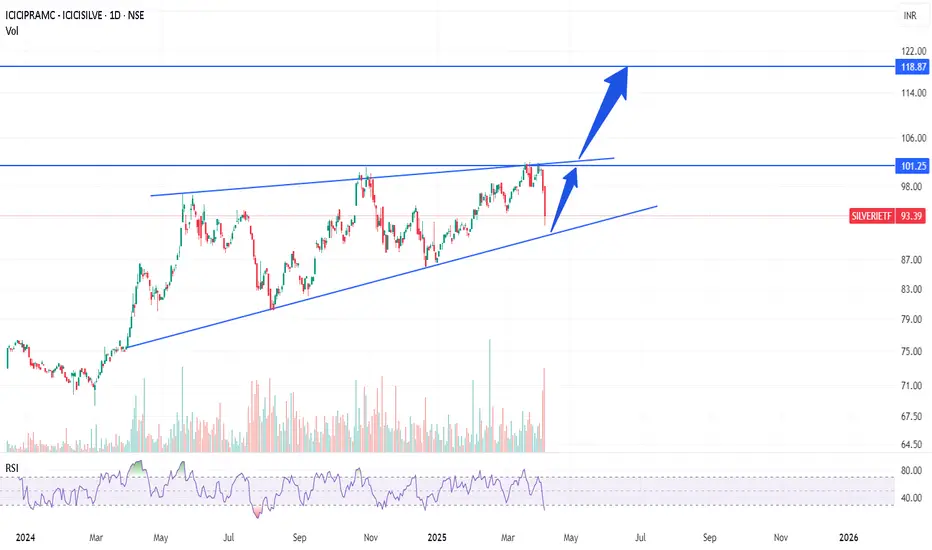
Buy Silver ETF @91Buy SILVER in all dips
Can be Multibagger!!
Target1 - 101
Target2 - 118
Target3 - 150
Disclaimer :-
I am not SEBI registered. The information provided here is for education purposes only.
I will not be responsible for any of your profit/loss with this channel suggestions.
Consult your financial advisor before taking any decisions