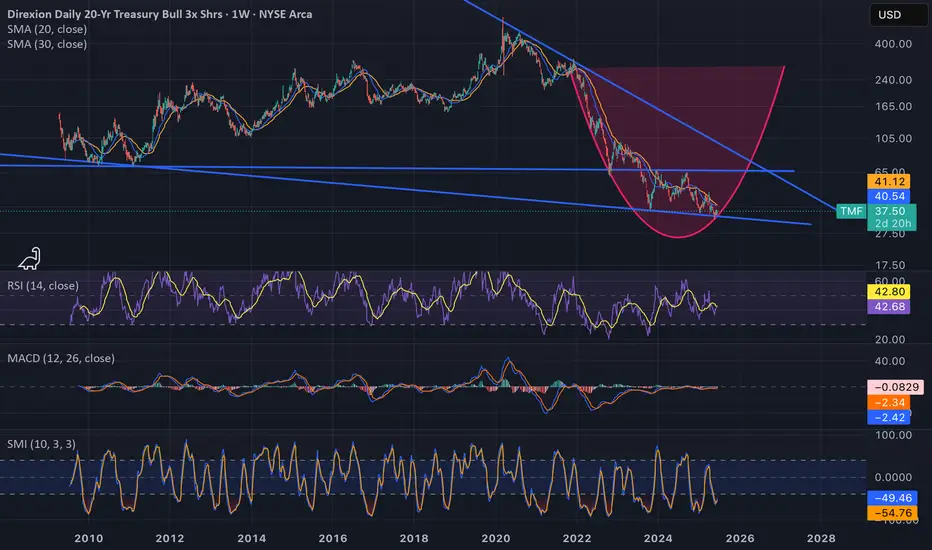
$TMF means Too Much FunIf it wasnt for politics, we would have already had a rate cut. The cut will come and when it comes, it might not be 25 bps. It may be much more because we need to catch up and the economy will be in the gutter. Enjoy the melt up but this thing will go parabolic in the next 2 years.
ETF market
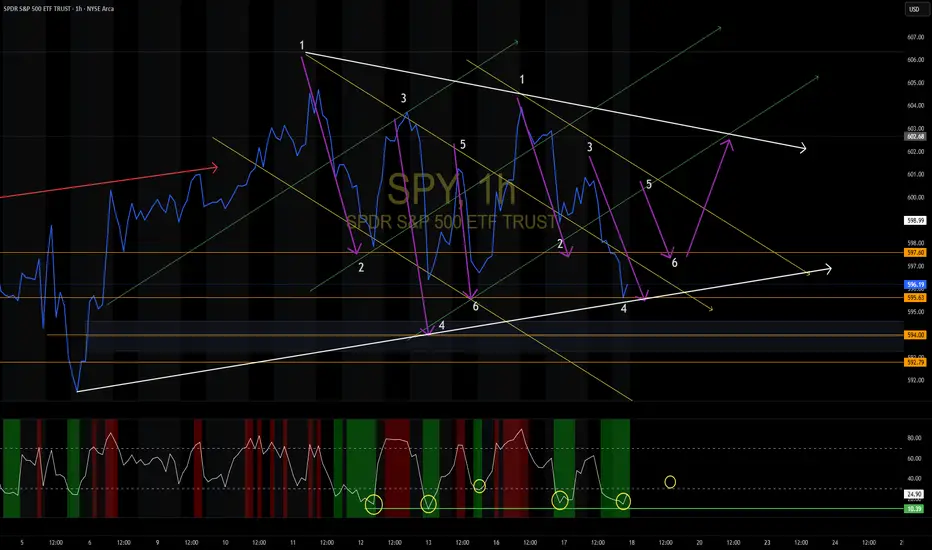
SPY repeating patternsSo just look at patterns that coincide with the RSI. Just keep an eye on the levels & channels & paly it smart
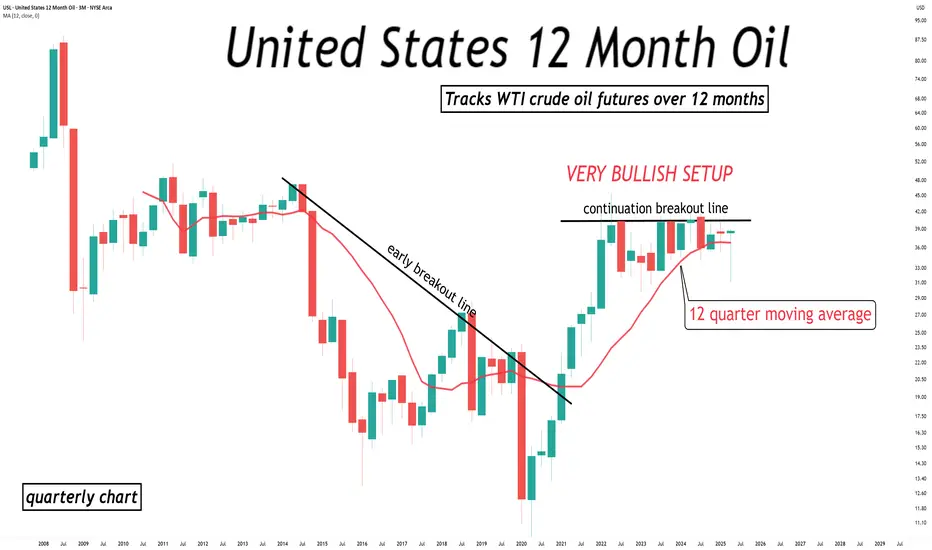
Bullish pattern morphing into existence for OilWhat a beautifully bullish pattern morphing into existence for crude oil !!!
With price being contained for over 3 years below that continuation breakout line, the 12 quarter moving average is squeezing, putting upwards pressure.
Oh boy, this could explode anytime soon ;-)
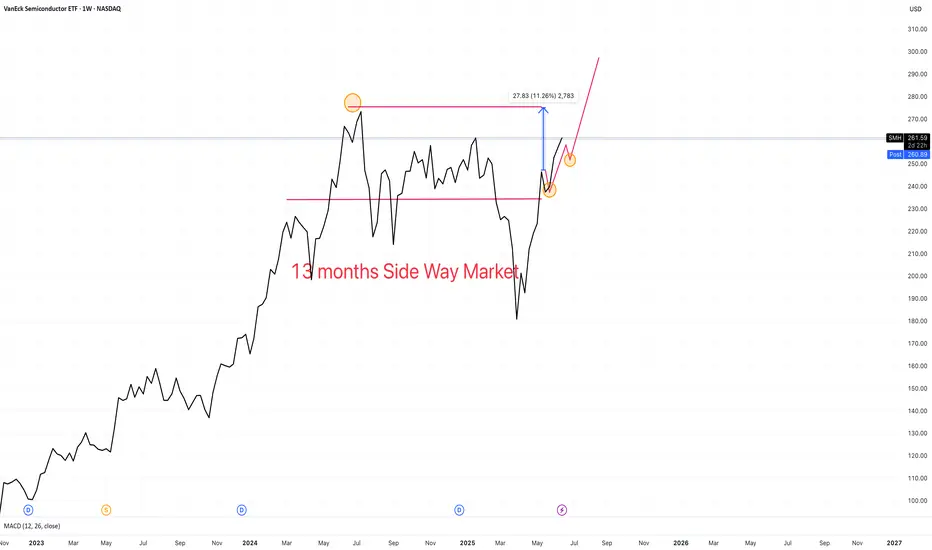
SMH BREAKOUT: Semiconductor ETF Explodes Higher After 13-Month VanEck Semiconductor ETF (SMH) - 1Y Chart Analysis
THE SETUP:
After 13 months of sideways chop between $180-$240, SMH has finally broken out with real conviction. This lengthy accumulation phase built a massive foundation for what could be the next major leg higher.
KEY LEVELS:
Breakout Level: $240 (now critical support)
Current Price: $261.59 (+1.79%)
Next Target: $300 (major psychological level)
Stop Loss: Below $240 breakout
WHAT HAPPENED:
Semis have been coiling throughout 2024, basically going nowhere while digesting the previous run. The break above $240 on solid volume tells me buyers are finally stepping in with size.
MY TAKE:
This looks like the real deal. 13 months is a long time to build a base, and when these sector ETFs finally break out of extended ranges, they tend to move fast. $300 is the obvious target - round numbers always matter in this game.
TRADE SETUP:
Long SMH with targets at $280 and $300. Stop below $240. The risk/reward here looks solid for swing traders who can handle the volatility.
Anyone else playing this breakout or waiting for a pullback? The semiconductor space has been dead money for over a year, so this could be the start of something bigger.
This is not financial advice. Trade at your own risk and size accordingly.
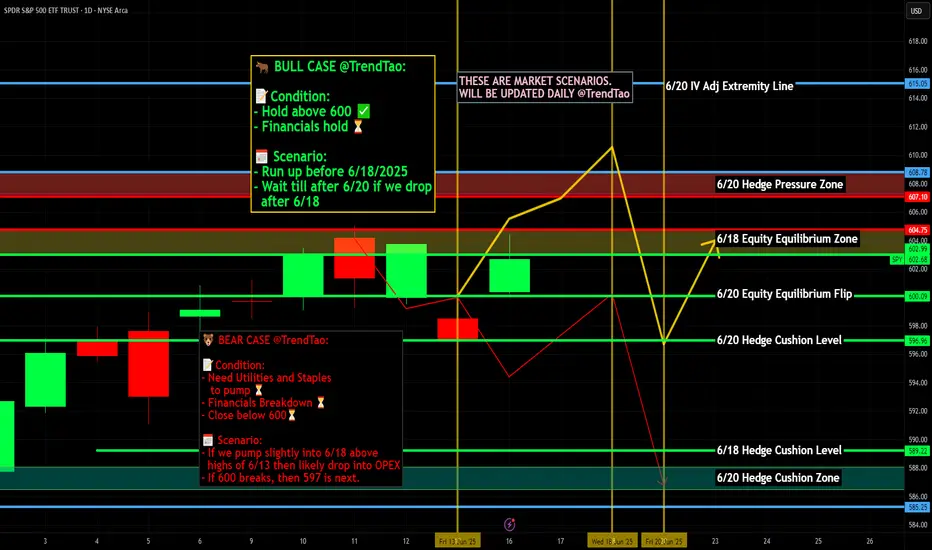
Nightly $SPY / $SPX Scenarios for June 18, 2025🔮 Nightly AMEX:SPY / SP:SPX Scenarios for June 18, 2025 🔮
🌍 Market-Moving News 🌍
💼 Business Inventories Flat in April
U.S. business inventories held steady in April, indicating stable consumer and wholesale demand. That suggests production won't need to cut sharply in the near term, supporting GDP outlook
🏭 Industrial Production Slips
Industrial output declined 0.2% in May, signaling ongoing weakness in factory activity amid less favorable global trade conditions .
🌐 Geopolitical Pressures Persist
Heightened tension in the Middle East continues to pressure risk assets. Investors remain focused on safe-haven flows into gold, Treasuries, and defensive equities, with analysts noting the risk backdrop remains tilted to the downside
📊 Key Data Releases 📊
📅 Wednesday, June 18:
8:30 AM ET – Housing Starts & Building Permits (May)
Measures new residential construction — leading indication of housing sector health.
8:30 AM ET – Initial Jobless Claims
Tracks the weekly count of new unemployment filings — useful for spotting early labor-market weakening.
2:00 PM ET – FOMC Interest Rate Decision
The Federal Reserve is expected to hold steady. Market focus will be on any commentary that hints at future tightening or easing plans.
2:30 PM ET – Fed Chair Powell Press Conference
Investors will parse Powell’s remarks for guidance on rate paths, inflation trends, and economic risks.
⚠️ Disclaimer:
This is for educational/informational purposes only and does not constitute financial advice. Consult a licensed advisor before making investment decisions.
📌 #trading #stockmarket #economy #housing #Fed #geo_risk #charting #technicalanalysis

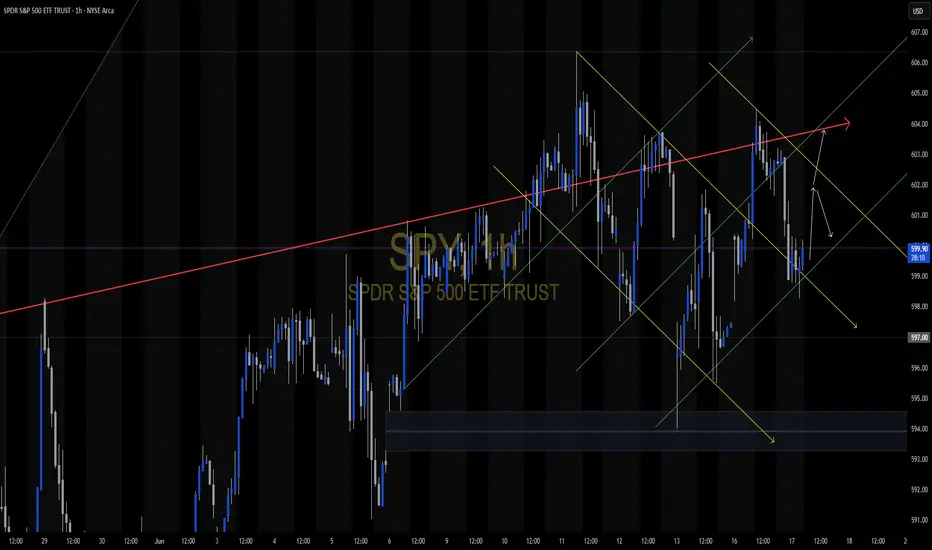
(No) IdeaWhy the handle of "The Uncertain Trader"? Let's check the daily SPY (S&P 500 ETF) chart just after the close of 17 Jun 2025;
I've got no idea where this thing is going.
Thus the handle.
No one has any idea where this is going. If they insist they do they are selling you something. In the words of Brad Hamilton, "Learn it. Know it. Live it".
However, one must form a hypothesis to trade from, right or wrong. And TradingView has excellent tools to do so AND a FREE social network to share such theories.
Back to SPY, I have my suspicions;
SPY closed at 597.53, below it's all-time high of 611.39 (gray line and box) from Feb 19 and above it's 200 day simple moving average of 577.41 (purple line and box). Besides some support at 595.48 (arrow), which is way too close to be useful, and maybe resistance at Wed's high (also too close), there's really no other obvious support or resistance. So, it's ~14 points to the solid resistance at that significant high and ~20 points to support. If one goes long it's 20 points to be proven wrong, 14 points to the good and where the trade will likely stall - not a good reward to risk. Going short is a little better, with 20 points to support with 14 points of risk, but still a rather meager reward to risk.
And now factor in an FOMC meeting tomorrow (Wed 18th). SPY could easily hit one of those marks (2.3% up, 3.4% down), or both, tomorrow afternoon.
The (safer) play is to hold off, stay neutral, and let SPY resolve this, up or down. Let it test/hold it's all-time high or it's 200-day.
Again, I have no idea where this is going - just my theory.
And please, read the following and, again, "Learn it. Know it. Live it";
My ideas here on TradingView are for educational purposes only. It is NOT trading advice. I often lose money and you would be a fool to follow me blindly.

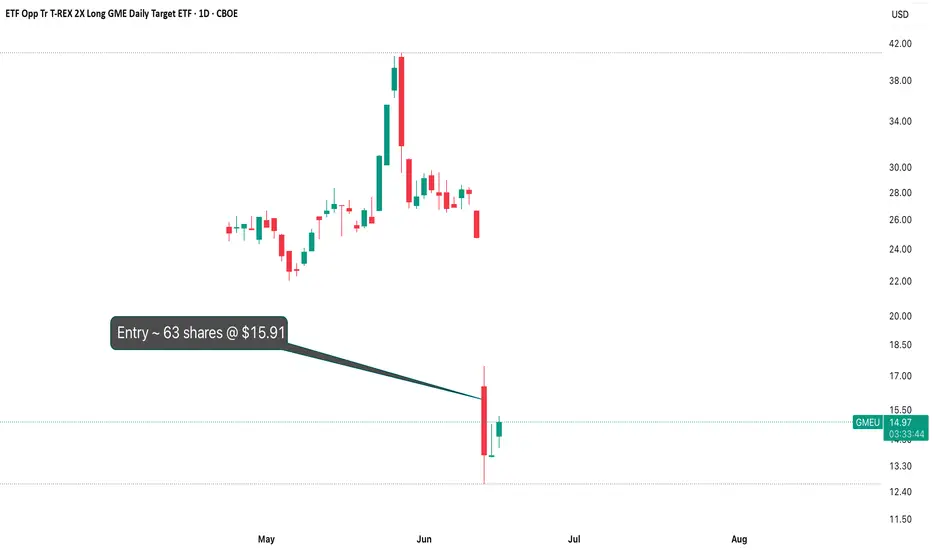
I'm in this trade $GME $GMEUThought process is that we see a mean reversion from here.
$6B in cash.
4710 BTC.
Profitable company.
Ryan Cohen is a financial engineer.
YOLO.
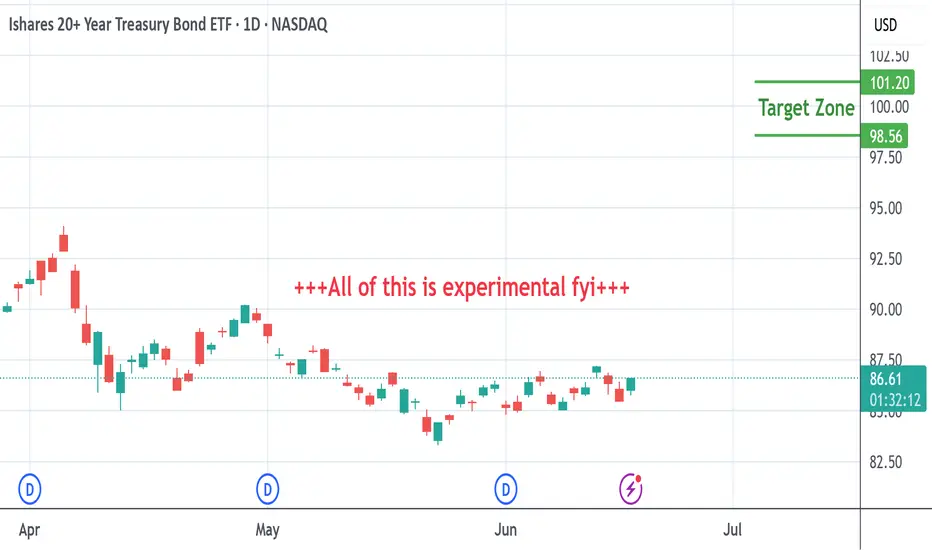
TLT long into Sept. 26th?I had TLT on my calendar (from the very EXPERIMENTAL dowsing work that I do) for yesterday and today from readings I did on 5/22 & 5/18.
Being that it was looking like a swing low in this date window, I checked this morning, & from the very experimental work that I do, I get that it's heading to around $100. I had a prior post suggesting a larger bottom in place, and this appears to have been accurate.
The date for exit (VERY EXPERIMENTAL & for journaling purposes) I get is Sept. 26th.
*** NOTE ***
I post things here as a method of journaling ideas. If it aligns with YOUR OWN WORK, great. I'm pretty sure everyone has their good and bad streaks no matter what method they use.
So, I had a rough patch after finding out my incredibly special companion kitty was dying. Did I know att this would affect my work? No! I tried to stay "normal" ( for me ;) ). Did I learn something? Of course, & in the future I will allow myself more downtime to come back to balance.
No one really knows what's going on in my life, but I guess this work is probably more subject than other methods to emotional or energetic disruptions. I always clear my energy, but in certain circumstances it may be better to just chill. I'm learning as I go. If you have any advice on making this work better, please lmk.
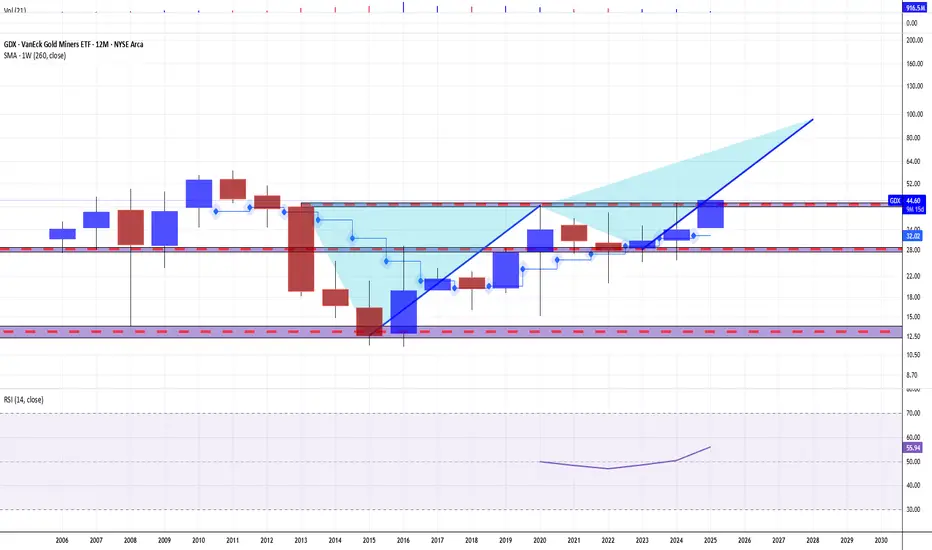
Gold Miners Break KEY multi-year resistanceIn the face of uncertainty, money flees to safe haven assets like Gold, Silver and the Dollar. When Gold moves up, gold miners do as well. As you can see from the weekly chart, the miners broke key resistance going all the way back to August 2020. These decade long highs at $46 were broken and there is a secondary trend line I have drawn that also intersects in the same area. The next probable move is for the miners to come down into the top of these trendlines and test the area as support before rocking to new all-time highs. Theres no guarantee that it will come down into this area, but if it does, you can bet your bottom dollar it'll be the buying opportunity of a lifetime.

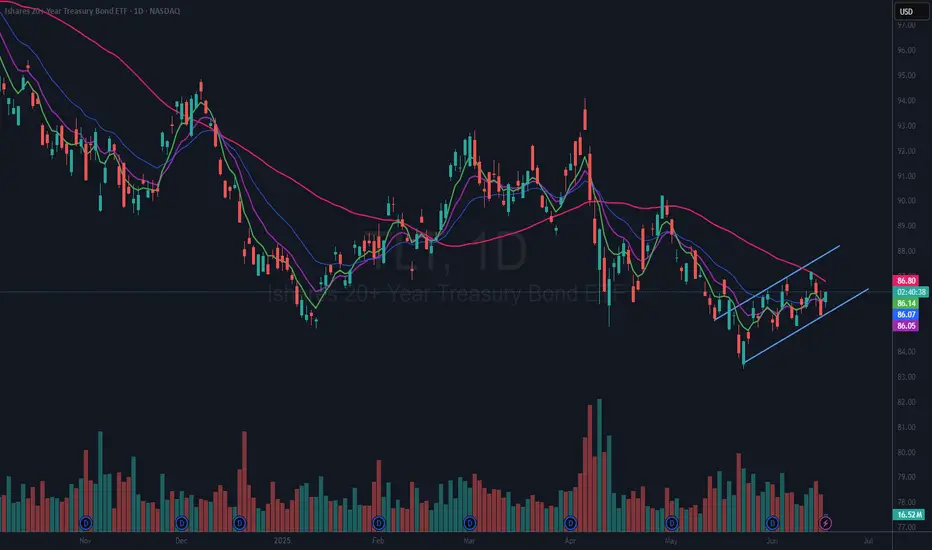
$TLT Rising Channel or Bear Flag?Is it time to invest in NASDAQ:TLT ? It looks positive to me. With inflation cooling down it looks like bond prices could increase, which means rates are lower. We do have a Fed Meeting coming up so there could be more volatility depending on the “Feds” messaging.
I am taking this long today with a ½ size position. I will place my stop just “below” yesterdays low of $85.46. I am going long because I see a series of higher lows and higher highs. And I have a well-defined risk level of about 1% to know if I am wrong.
If you like this idea, please make it your own. Make sure you follow your trading plan.
Gold Miners Stocks Go 'The Rife Game' in Town. Here's WhyGold mining stocks have emerged as one of the top-performing asset classes in 2025, driven by a combination of surging gold prices, improved profitability, and shifting investor sentiment.
Here’s fundamental and technical analysis of the key factors behind this outperformance, by our @PandorraResearch Super-Duper Beloved Team :
Record-High Gold Prices Fuel Margins
Gold prices surpassed $3,000 per ounce in March 2025 for the first time in history, marking a 14% year-to-date increase. This rally stems from:
Safe-haven demand amid geopolitical tensions, economic and political uncertainty including U.S. trade policy volatility.
Central bank buying , particularly by China, India, Turkey, and Poland, to diversify away from the U.S. dollar.
Anticipated interest rate cuts , which reduce the opportunity cost of holding non-yielding assets like gold.
Higher gold prices directly boost miners’ revenues.
For example, the NYSE Arca Gold Miners Index NYSE:GDM returned nearly 30% YTD by early March, outpacing both physical gold OANDA:XAUUSD (+14.5%) and the S&P 500 SP:SPX (-3.8%). Companies like Agnico Eagle Mines NYSE:AEM and Wheaton Precious Metals NYSE:WPM reached all-time highs, while ASX-listed miners such as Evolution Mining ASX:EVN (+39.5% YTD) and West African Resources ASX:WAF (+56.6% YTD) outperformed Australia’s broader market.
Margin Expansion and Shareholder Returns
Gold miners are leveraging rising prices to improve profitability:
Stabilized costs for labor, energy, and equipment have widened profit margins.
Free cash flow growth enabled dividend hikes and share buybacks. U.S. Global Investors, for instance, offers a 3.91% annualized dividend yield.
Undervalued stocks: Many miners traded at historically low valuations relative to gold prices, creating buying opportunities. Barrick Gold NYSE:GOLD (P/E 15.6) and Newmont Corp NYSE:NEM (P/E 15.5) remained attractively priced despite gains.
Royal Gold NASDAQ:RGLD , a streaming company with a 60.3% operating margin, exemplifies how non-traditional miners capitalize on gold’s rally without direct operational risks.
Sector-Specific Catalysts
Mergers and acquisitions. Consolidation activity has increased, with larger firms acquiring high-potential projects.
Copper exposure. Miners like Evolution Mining benefit from rising copper demand, diversifying revenue streams.
Institutional upgrades. Analysts at Macquarie and Morgan Stanley endorsed Newmont and Evolution Mining, citing currency tailwinds and free cash flow potential.
Macroeconomic and Market Dynamics
Dollar weakness. A declining U.S. dollar enhances gold’s appeal as a hedge.
Equity market volatility. With the S&P 500 struggling, investors rotated into gold equities for diversification (0.3 correlation to broader markets).
Fiscal deficits. U.S. budget imbalances and inflationary pressures reinforced gold’s role as a store of value.
Outlook for 2025
Analysts project further gains, with gold potentially reaching $3,300 per ounce. Miners are expected to sustain momentum through:
Operational efficiency improvements to align with higher gold prices.
Continued capital discipline , avoiding overinvestment in new projects.
Dividend growth , as seen with U.S. Global Investors’ monthly payouts.
Technical Outlook
The main technical graph for Gold Miners ETF AMEX:GDX indicates on further Long-Term Bullish opportunity, to double the price over next several years, in a case of the epic $45 mark breakthrough.
Conclusion
In summary, gold miners’ 2025 rally reflects a confluence of macroeconomic uncertainty, disciplined capital management, and gold’s structural demand drivers. While risks like cost inflation persist, the sector’s fundamentals and valuation upside position it as a compelling component of diversified portfolios.
--
Best 'Golden Rife' wishes,
@PandorraResearch Team 😎
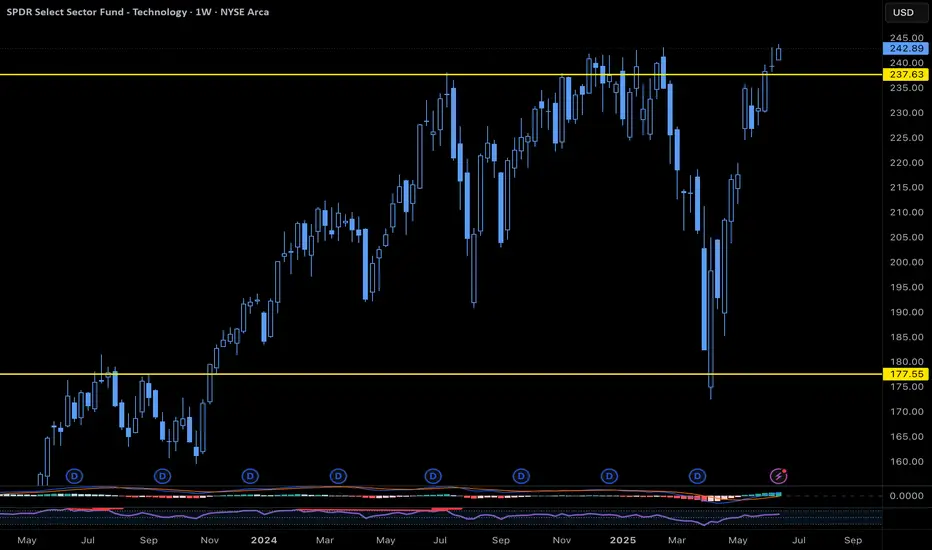
XLK Breaks All-Time High – Will It Stick the Landing or Soar?AMEX:XLK just broke into new all-time high (ATH) territory — barely — but the move is worth watching.
The breakout came on the heels of a strong bullish candle in the first week of June, followed by a doji last week, and now we're seeing fresh bullish momentum early this week with a gap-up.
➜ The big question:
Will XLK continue to hover just above the ATH, or finally break through with conviction?
This move could set the tone for tech stocks this summer, especially if we see confirmation like we did with NASDAQ:MSFT — which broke its ATH on June 6 and hasn’t looked back.
➜ Watching for:
➲ Continuation above ATH
➲ Potential summer trend leadership
➲ Confirmation from big names in the sector
#XLK #techstocks #SPDR #technicalanalysis #breakout
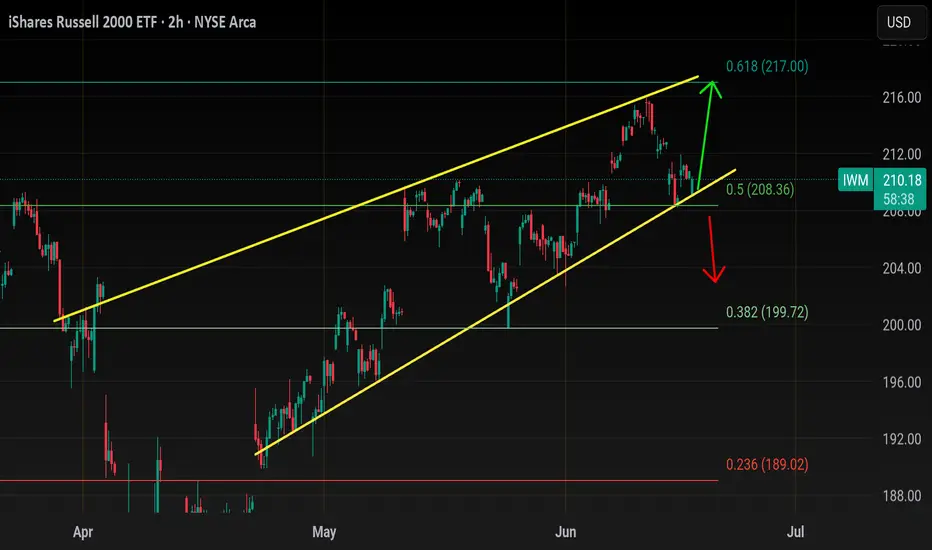
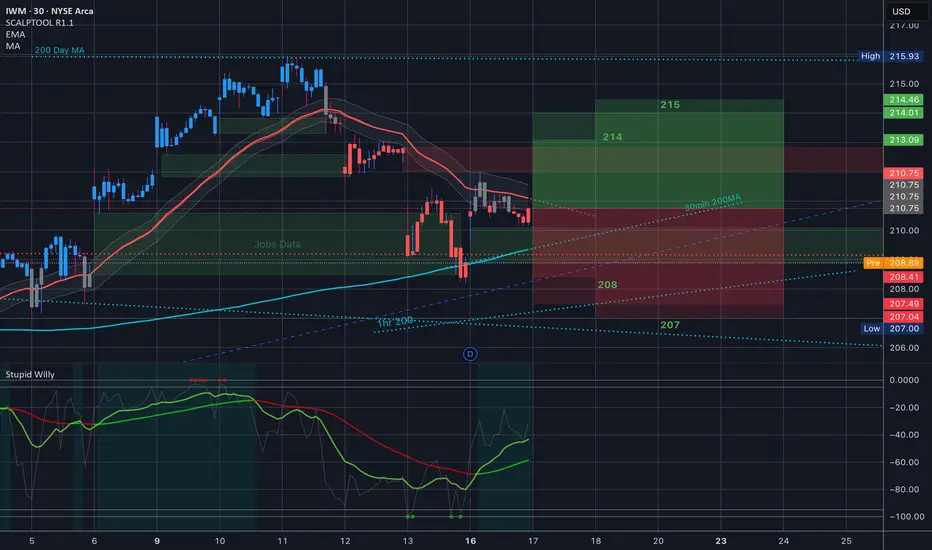
IwmInteresting spot here ...
Bulls see Inverted H&S
Bears see , rising wedge
I see an inflection point.
We are sitting at the bottom of a wedge.. depending on what happens the next 2 days
We either test 204 or 217
Below 208.00 and iwm goes straight to 204.00
Above 212.00 and 217 comes ...
209 is daily 200ema
216 is daily 200sma and weekly 50ma
So 209-216 is chop....
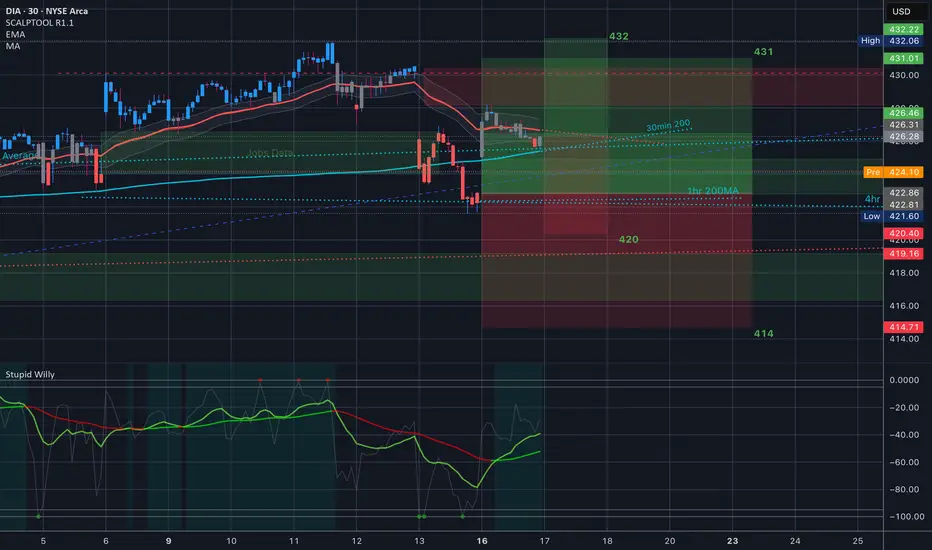
$DIA // June 17 2025 // CPI Analysis & Targets for Day TradersAMEX:DIA // June 17 2025 // CPI Analysis & Targets for Day Traders
$IWM // June 17 2025 // CPI Analysis & Targets for Day TradersAMEX:IWM // June 17 2025 // CPI Analysis & Targets for Day Traders
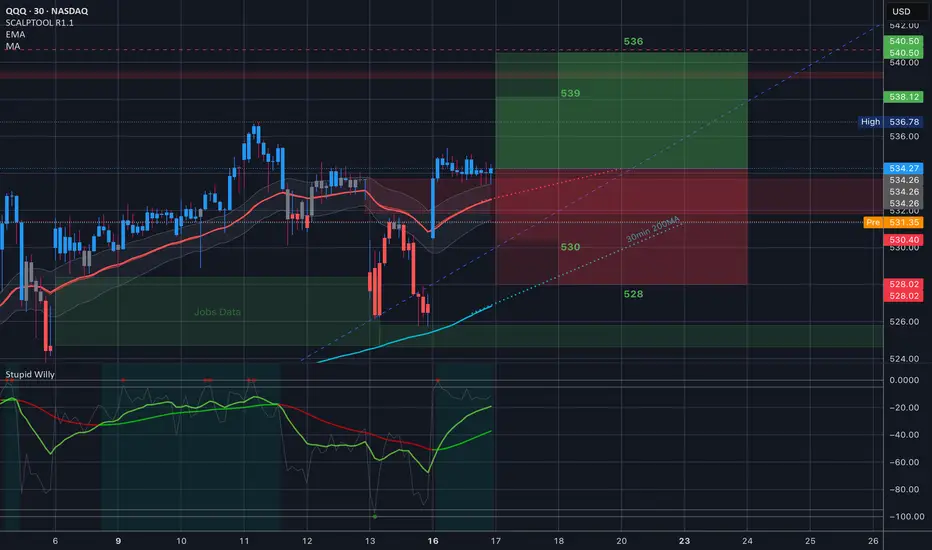
$QQQ // June 17 2025 // CPI Analysis & Targets for Day TradersNASDAQ:QQQ // June 17 2025 // CPI Analysis & Targets for Day Traders
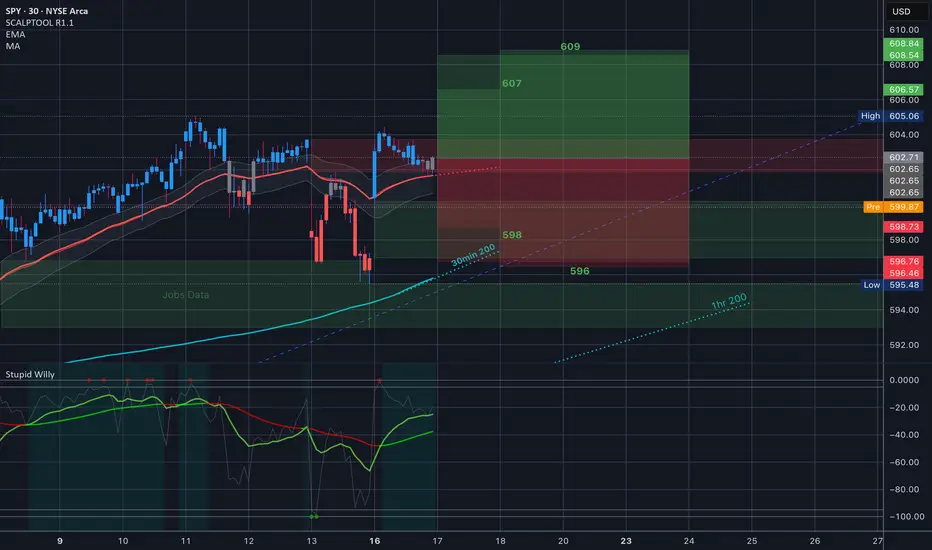
$SPY // June 17 2025 // CPI Analysis & Targets for Day TradersAMEX:SPY // June 17 2025 // CPI Analysis & Targets for Day Traders
SPY/QQQ Plan Your Trade for 6-17: Top Resistance PatternToday's pattern suggests the SPY/QQQ will move into a type of topping pattern, attempting to identify resistance, then roll away from that resistance level and trend downward.
I suggest the news related to the conflict between Israel & Iran may continue to drive market trends with traders moving away from uncertainty near these recent highs.
Silver makes a big move higher. Gold will likely follow later this week or early next week.
BTCUSD moves into a sideways FLAGGING pattern - possibly attempting a BIG BREAKDOWN event over the next few weeks.
Overall, the markets look like they are poised for a very big move - just waiting for the GREEN LINK (GO).
Stay safe. Protect capital and HEDGE.
Get some.
#trading #research #investing #tradingalgos #tradingsignals #cycles #fibonacci #elliotwave #modelingsystems #stocks #bitcoin #btcusd #cryptos #spy #gold #nq #investing #trading #spytrading #spymarket #tradingmarket #stockmarket #silver

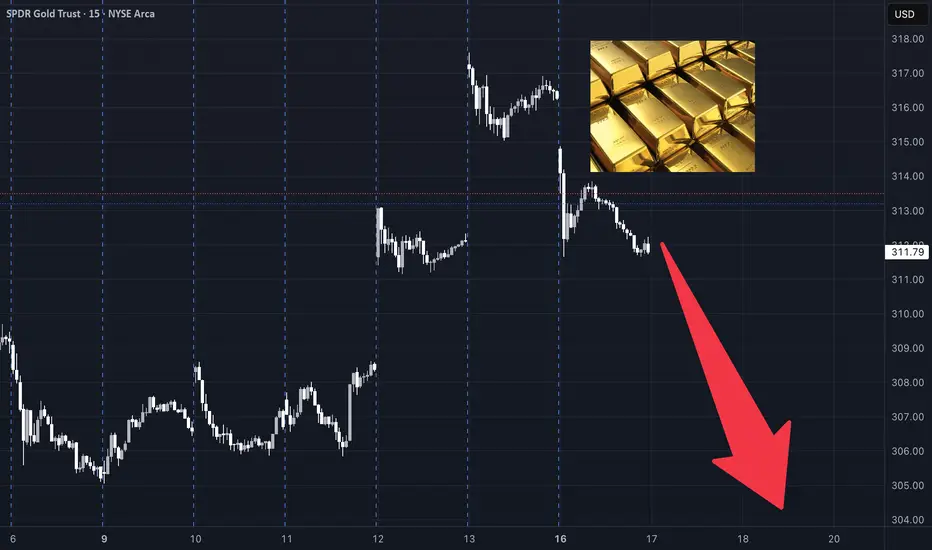
GLD Weekly Trade Setup — June 16, 2025🪙 GLD Weekly Trade Setup — June 16, 2025
🎯 Instrument: GLD (SPDR Gold Shares)
📉 Strategy: Short Bias via Puts
📅 Entry Timing: Market Open
📈 Confidence Level: 65%
🧠 Technical & Sentiment Snapshot
Current Price: $311.78
5-Min Chart: Below EMAs (10/50/200); RSI ≈ 34 → short-term oversold
Daily Chart: Above 10EMA ($309.94), RSI ≈ 56 → neutral-to-bullish
Bollinger Bands: Near lower band on M5 → volatility likely
Support/Resistance:
• Support: $311.68 / $307.28
• Resistance: $312.20 / $313.00
🗞️ Market Sentiment Overview
VIX: Elevated at 20.82 → high risk premium environment
Options Flow: Heavily put-weighted near $305–$310 strikes
Max Pain: $285 → bearish options bias into expiration
News: Geopolitical tensions increase flight-to-safety temporarily, but fading momentum fuels retrace setups
🔽 Recommended Trade: GLD PUT
Parameter Value
🎯 Strike $307.00
💵 Entry Price $0.84
🎯 Profit Target $1.25–$1.70
🛑 Stop Loss $0.50
📅 Expiry June 20, 2025
📏 Size 1 contract
⚖️ Confidence 65%
🧷 Trade Plan
📥 Entry: At market open
📈 PT Zone: $1.25 to $1.70 premium, based on drop to $306–307
🛑 Stop: If premium drops to $0.50 OR GLD breaks above $313
💰 Risk Mgmt: Keep exposure <2% of total account equity
⚠️ Key Considerations
Upside Risk: Sudden bullish shift or risk-off headlines can drive reversal
Time Decay: Premium erosion risk is higher if GLD consolidates
Volatility Drag: VIX dropping could suppress put premiums quickly
🧾 TRADE_DETAILS (JSON)
json
Copy
Edit
{
"instrument": "GLD",
"direction": "put",
"strike": 307.0,
"expiry": "2025-06-20",
"confidence": 0.65,
"profit_target": 1.25,
"stop_loss": 0.50,
"size": 1,
"entry_price": 0.84,
"entry_timing": "open",
"signal_publish_time": "2025-06-16 16:15:17 UTC-04:00"
}
💡 If GLD struggles to reclaim $312.20 at the open, the put setup becomes attractive. Breakout above $313? Exit quickly.
Nightly $SPY / $SPX Scenarios for June 17, 2025🔮 Nightly AMEX:SPY / SP:SPX Scenarios for June 17, 2025 🔮
🌍 Market-Moving News 🌍
📈 U.S. Retail Spending Holds Firm
May’s retail sales were flat month-over-month, defying expectations of a slowdown. Core retail sales (ex-autos) edged up +0.2%, signaling resilience in consumer purchases—an encouraging sign for economic momentum
🤖 Tesla’s Robotaxi Buzz Accelerates
Tesla stock surged after a weekend robotaxi video surfaced ahead of its planned Austin launch. A viral clip showed a Model Y “robotaxi” navigating traffic autonomously, sparking fresh investor enthusiasm despite safety debates
📊 BoJ Holds Rates; Dollar Edges Higher
Japan’s central bank left policy unchanged at 0.5%, maintaining its dovish bias. This lifted the dollar slightly versus the yen, drawing focus to global interest-rate divergence
📊 Key Data Releases 📊
📅 Tuesday, June 17:
8:30 AM ET – Retail Sales (May)
Consumer purchases are tracked, excluding autos. Monitor if activity stays steady despite inflation and rate pressures.
9:15 AM ET – Industrial Production & Capacity Utilization (May)
Provides insight into factory activity and plant usage—a gauge of economic health amid global slowdown concerns.
10:00 AM ET – Business Inventories (April)
Shows stock levels held by wholesalers and manufacturers. Higher inventories with weaker sales may signal slowing demand.
⚠️ Disclaimer:
This information is for educational and informational purposes only and should not be construed as financial advice. Always consult a licensed financial advisor before making investment decisions.
📌 #trading #stockmarket #economy #news #trendtao #charting #technicalanalysis
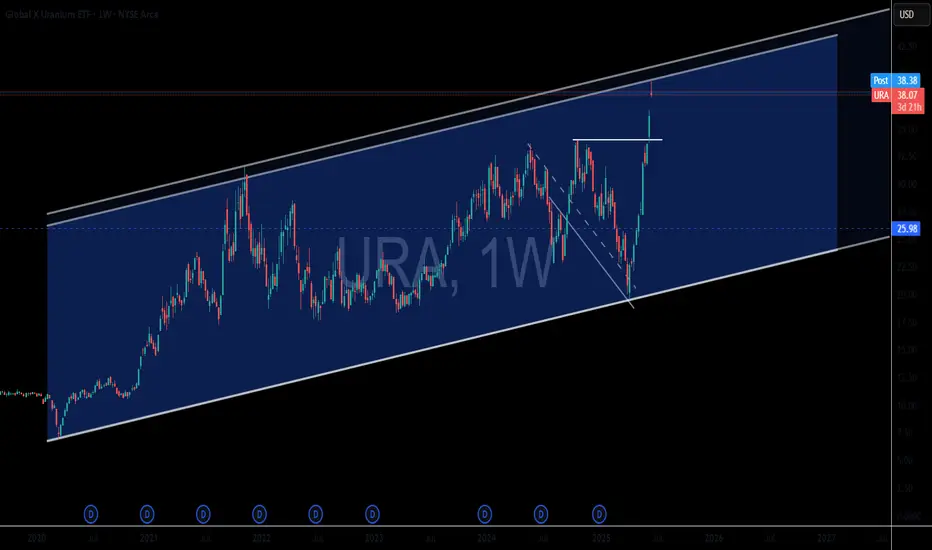
This Just Went Nuclear - Explosive Move!Uranium prices have surged due to several key factors:
- Increased demand for nuclear energy – Many countries are expanding nuclear power to meet clean energy goals.
- Geopolitical tensions – Supply disruptions from Russia and Niger have tightened the market.
- Underinvestment in uranium mining – Years of low prices led to reduced production, creating a supply deficit.
- Government policies – The U.S. and other nations are prioritizing domestic uranium production for energy security.
- Rising uranium prices – Spot prices have climbed significantly, boosting mining stocks.
We are near some major resistance and expect some profit taking to occur.
Names Like NYSE:OKLO NYSE:SMR AMEX:URNM AMEX:URA NASDAQ:CEG should be on watch for a strong selloff.
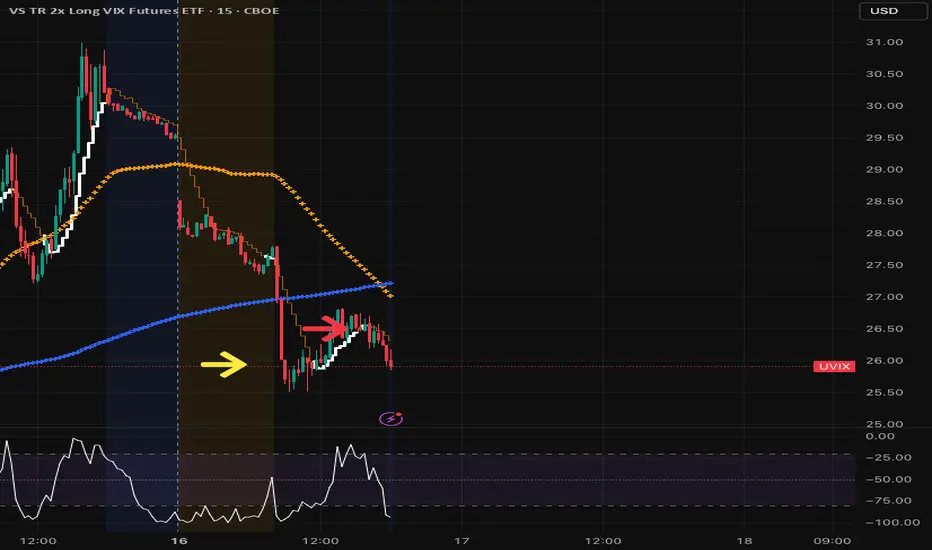
UVIX nice little chunk today!I picked up almost 3% today, and called it out as it happened! Always have Williams % and SMA9 on the 15min charts. When it crosses down or comes down (in the case of W%), just take your profit!
There will be another bounce real soon!