QQQ Stock Chart Fibonacci Analysis 090325Trading Idea
1) Find a FIBO slingshot
2) Check FIBO 61.80% level
3) Entry Point > 570/61.80%
Chart time frame:B
A) 15 min(1W-3M)
B) 1 hr(3M-6M)
C) 4 hr(6M-1year)
D) 1 day(1-3years)
Stock progress:B
A) Keep rising over 61.80% resistance
B) 61.80% resistance
C) 61.80% support
D) Hit the bottom
E) Hit the top
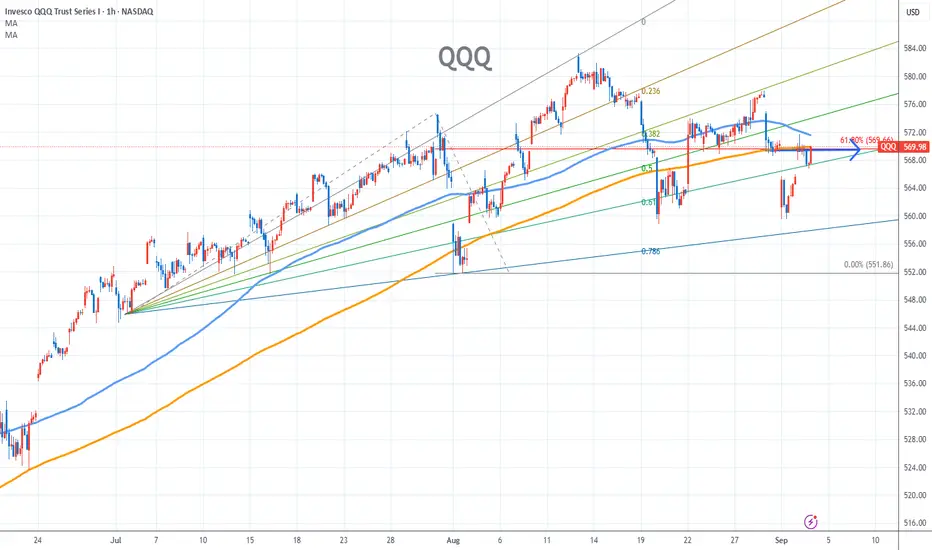
Stocks rise as they rise from support and fall from resistance. Our goal is to find a low support point and enter. It can be referred to as buying at the pullback point. The pullback point can be found with a Fibonacci extension of 61.80%. This is a step to find an entry-level position. 1) Find a triangle (Fibonacci Speed Fan Line) that connects the high (resistance) and low (support) points of the stock in progress, where it is continuously expressed as a Slingshot, 2) and create a Fibonacci extension level for the first rising wave from the start point of the slingshot pattern.
When the current price goes over the 61.80% level, that can be a good entry point, especially if the SMA 100 and 200 curves are gathered together at 61.80%, it is a very good entry point.
As a great help, TradingView provides these Fibonacci speed fan lines and extension levels with ease. So if you use the Fibonacci fan line, the extension level, and the SMA 100/200 curve well, you can find an entry point for the stock market. At least you have to enter at this low point to avoid trading failure, and if you are skilled at entering this low point, with the fibonacci6180 technique, your reading skill of to chart will be greatly improved.
If you want to do day trading, please set the time frame to 5 minutes or 15 minutes, and you will see many of the low points of rising stocks.
If you prefer long-term range trading, you can set the time frame to 1 hr or 1 day
ETF market
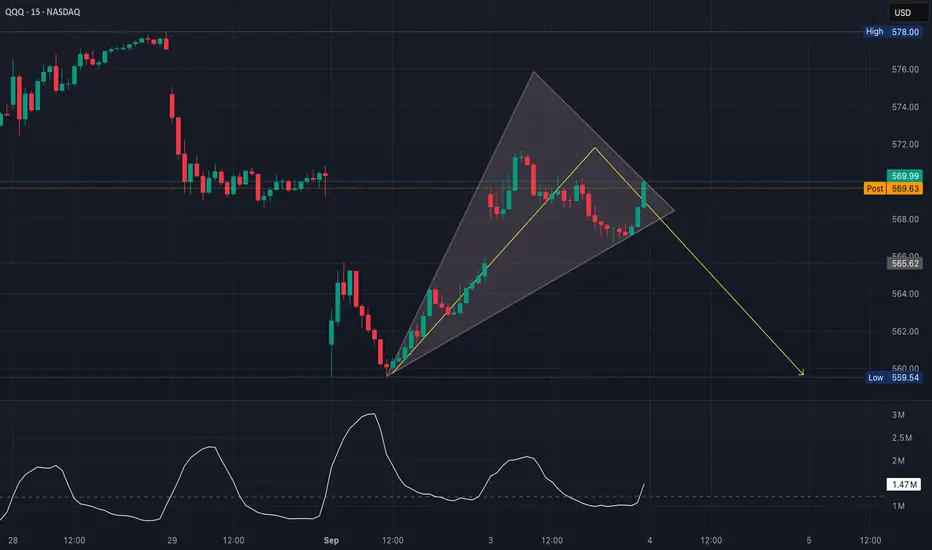
QQQ Potential Bearish ResolutionThe white volume line has been fading during the climb inside the wedge
That’s typical of an exhaustion rally inside an ascending broadening wedge where price pushes higher on weaker participation
The last push up showed a small bounce in volume, but not a breakout-level surge
For a wedge, this usually suggests the rally is running out of gas rather than building strength
Broadening wedges often end with a volume pickup on the breakdown, not on the way up
If we see that white line spike while price loses the wedge bottom, that would be a strong bearish confirmation
Conversely, if volume expands while breaking above $573–$574, it would invalidate the bearish read & confirm strength instead
So, right now volume is consistent with a potential bearish resolution
SILJ Technical Analysis OverviewHi,
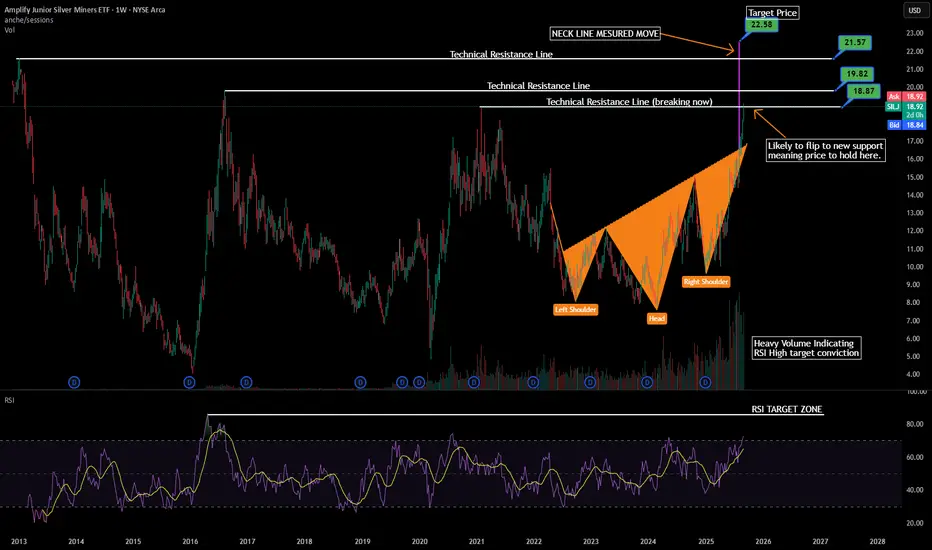
This is my second publication on SILJ. I’ve identified an ascending inverse head and shoulders pattern, which can also be interpreted as a stronger W-formation with higher lows. The measured move from this setup points to a breakout that would clear multiple historic resistance levels on SILJ.
One consideration is the timing of share issuance in earlier periods, which may align with this recent price action. However, silver miners are clearly playing the catch-up trade to gold, and I expect these resistance levels to be taken out, with SILJ potentially making a new all-time high.
The recent surge in volume supports this view, suggesting further upside in both RSI and price. Confirmation would come from daily or 4H closes above the first resistance, likely flipping it into support. In that case, dip buying off re-tests of key resistance levels becomes the higher-probability trade.
I also recommend monitoring spot silver, which is eyeing the $50/oz level. Remember that miners generally lag the silver price due to earnings cycles—their performance is tied to how much silver was actually produced, which is inherently variable.
SILJ offers diversified exposure by averaging across a basket of junior miners, giving potential for outsized upside capture. I also like SIL and will provide a technical breakdown on that ETF next.
Regards,
R.
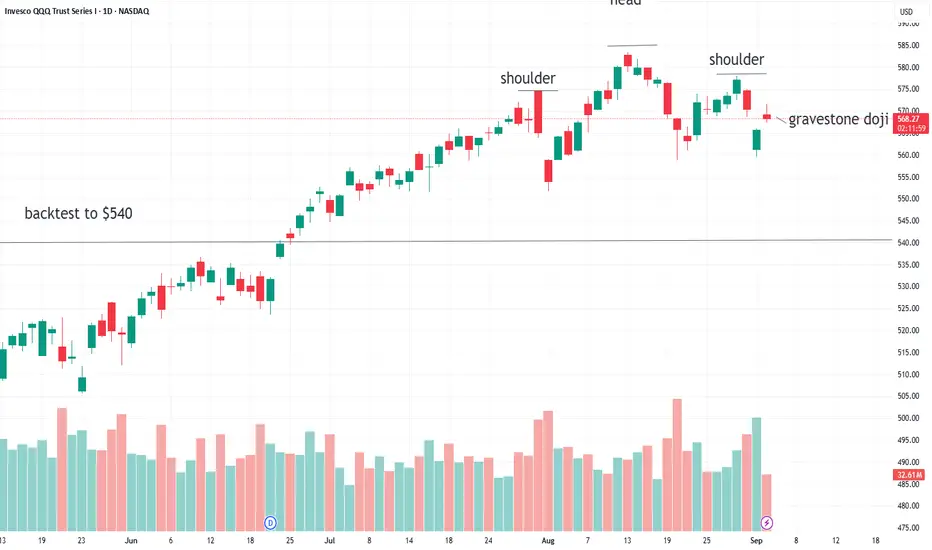
Head and shoulders pattern intact, rally failedGravestone doji formed by 1:30 PM EST, showing a failure of the ETF to rally. The short pattern is still in play.
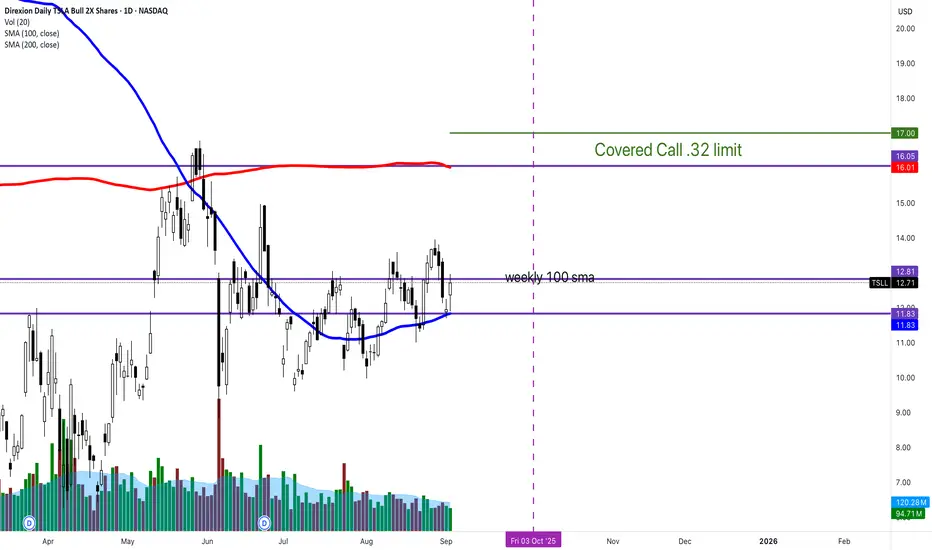
TSLL Covered callBuy low, sell high.
GORGEOUS bounce off of the 100 SMA on a daily. Surprise, surprise.
A BUNCH of traders had some $12 and $11 and $10 put sales expiring in September.
Those should be able to be closed for a profit
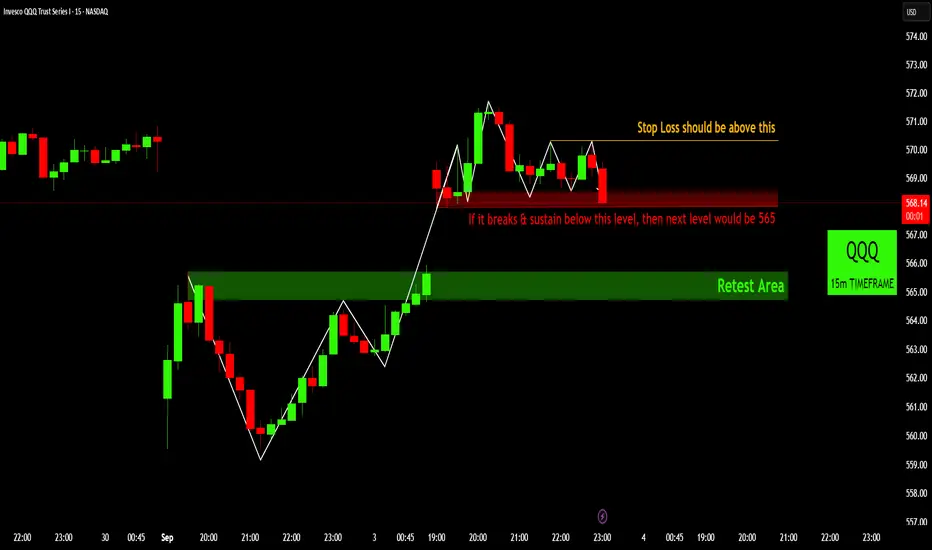
QQQ 15m: Critical Support - Breakdown Watch!QQQ 15m: Critical Support - Breakdown Watch!
The QQQ 15m chart shows price consolidating above a key support level. If it breaks and sustains below this level, a bearish move is likely. The next target in such a scenario would be the 565 retest area. For any bearish positioning, a stop loss should be placed above the recent swing high.
Disclaimer:
The information provided in this chart is for educational and informational purposes only and should not be considered as investment advice. Trading and investing involve substantial risk and are not suitable for every investor. You should carefully consider your financial situation and consult with a financial advisor before making any investment decisions. The creator of this chart does not guarantee any specific outcome or profit and is not responsible for any losses incurred as a result of using this information. Past performance is not indicative of future results. Use this information at your own risk. This chart has been created for my own improvement in Trading and Investment Analysis. Please do your own analysis before any investments.
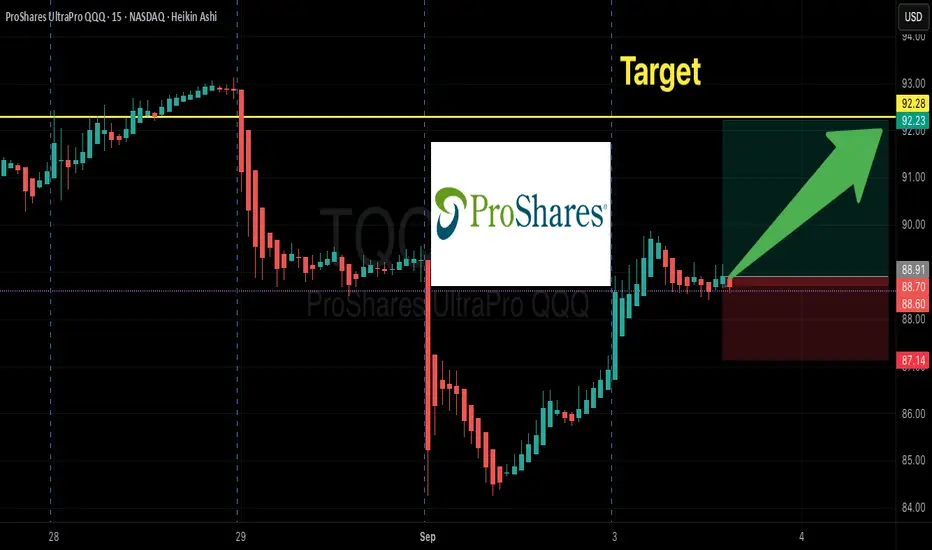
TQQQ Momentum Meets Options Flow | $92 Call YOLO?”
# 🚀 TQQQ Weekly Options Trade Idea (2025-09-03)
### 📊 Market Recap
* **Weekly RSI**: 🔥 70.9 (bullish)
* **Daily RSI**: 😐 49.7 (neutral)
* **Options Flow**: 💎 Strongly bullish (C/P = 1.78)
* **Volume**: 📉 0.9x (weak confirmation)
* **VIX**: ✅ Favorable (\~16–17)
👉 **Models Split:**
* 🐻 Gemini → **NO TRADE** (daily/weekly misaligned, weak volume).
* 🐂 Claude, Llama, DeepSeek → **BUY \$91.50–92.00 CALL** (tight stop, quick exit).
---
### ✅ Consensus Trade Setup
```json
{
"instrument": "TQQQ",
"direction": "call",
"strike": 92.0,
"expiry": "2025-09-05",
"entry_price": 0.65,
"profit_target": 1.15,
"stop_loss": 0.35,
"size": 1,
"confidence": 0.66,
"entry_timing": "open"
}
```
---
### 🎯 Trade Details
* 📌 **Strike**: \$92 CALL
* 💵 **Entry**: 0.65 (ask @ open)
* 🎯 **Target**: 1.15 (+77%)
* 🛑 **Stop**: 0.35 (–46%)
* 📅 **Expiry**: Sep 5 (2 DTE)
* 📈 **Confidence**: 66%
* ⏰ **Max Hold**: Exit by Thu EOD (⚠️ avoid Friday gamma)
---
⚠️ **Risks**
* Weak weekly volume = 🚨 reduced conviction
* Daily RSI neutral → rally may stall
* Theta burn + gamma whipsaws with 2 DTE ⚡
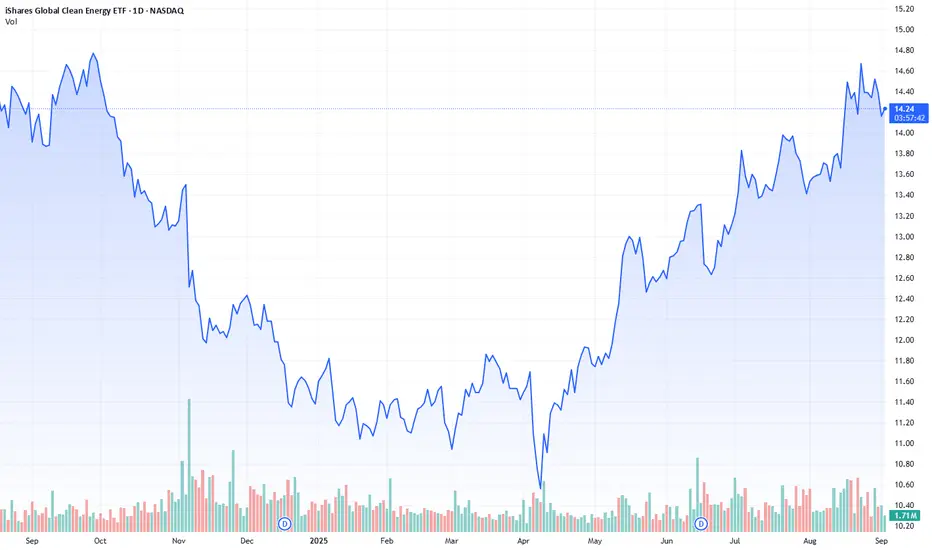
Green Hydrogen Surge: Tech Trends and ETF PicksFirst of all, let's note one thing - as the world enters the sixth technological revolution, one of its defining transformations is the intensifying competition between energy paradigms. From electrification and renewables to synthetic fuels and nuclear fusion, the race is no longer just about supply, it is about strategic dominance. Among these competitors, hydrogen stands out as a universal energy carrier and a symbol of industrial rebirth.
So, what is it about hydrogen that attracts attention? The answer is its versatility. It is used as a fuel for fuel cell vehicles, helps reduce carbon emissions in heavy industry, and stores renewable energy that can be unstable. The growing interest in hydrogen has sparked a wave of global research and development, with countries and companies pouring resources into hydrogen-fueled cars, prototype aircraft engines and other large-scale energy solutions. Despite such progress, however, the hydrogen economy is now at a tipping point, influenced by policy, infrastructure, and market readiness for its adoption. The clean hydrogen industry itself is poised for growth, which will be facilitated by innovations in logistics, the expansion of maritime transportation, and the introduction of industry.
Overall, the industry is on the rise, but there are some obstacles in the way that it needs to overcome – these are high costs and the current lack of demand for products. This is mainly due to the lack of properly tested and safety-approved products for end users.
By the way, Bosch is launching a series of hydrogen internal combustion engines specifically designed for trucks and construction equipment. Combining its century of experience in internal combustion engines, Bosch NSE:BOSCHLTD seems to be developing scalable, low-emission options for heavy-duty industrial applications. A great example is the Cummins X15H engine that was on display at the IAA Transport Show. This hydrogen-fueled engine boasts an impressive 530 horsepower and 2,600 Nm of torque, which is a pretty big leap in the long-haul and trucking industry.
Another example is Toyota $NYSE:TM. They recently launched a 1 MW stationary hydrogen generator developed in collaboration with their racing division. This device is often described as silent and odorless, and it plays a key role in a pilot project to create a renewable energy network at the NREL campus in Flatirons, where it combines solar, water, and electrolysis technologies.
When it comes to specific stocks whose agendas align with green hydrogen deals, I would mention Kimberly-Clark, which is investing in the UK, as well as Walmart, which is testing hydrogen-powered trucks and a green hydrogen logistics pilot project in Chile. And when it comes to specific favorites, I would highlight companies such as FuelCell Energy ( NASDAQ:FCEL ), a leader in hydrogen production for logistics and industry, and Bloom Energy ( NYSE:BE ). The British hydrogen production business model and the Net Zero Hydrogen Fund support these projects.
Although these stocks are among the best in my personal selection in the sector, I also like their role in hydrogen production or partnerships. However, to avoid disappointment in this rather risky environment, I prefer sector exposure, which can be obtained through renewable energy ETFs such as ICLN (iShares Global Clean Energy ETF).
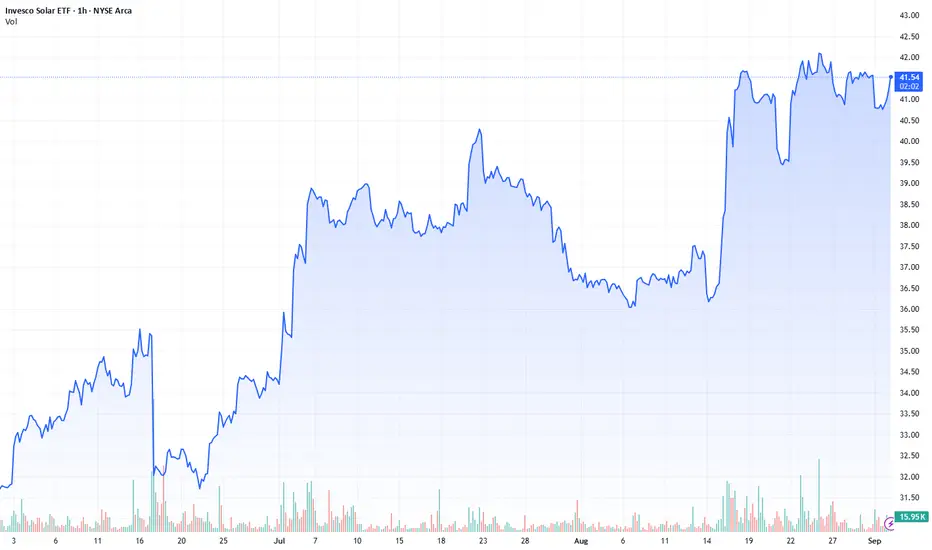
Energy ETFs: Policy, Solar, Gas, and NuclearEnergy ETFs serve as a strategic tool for capturing growth in specific sectors while reducing the risk associated with individual stocks. Let’s take ETFs in the alternative energy sector (solar, wind, nuclear). They dominate thanks to favorable policies and decarbonization trends. Natural gas ETFs, on the other hand, remain volatile but offer long-term protection against inflation. Yes, North America is a key driver of growth in solar and wind energy, but political instability and regulatory changes have reduced short-term returns.
If we touch on a broader selection of energy ETFs, AMEX:TAN (Invesco Solar ETF) and AMEX:NLR (VanEck Uranium and Nuclear ETF) are worth a look. The former also has broad exposure to subsectors (e.g., infrastructure, utilities). While U.S. solar and wind energy producers are leading the way, the respective ETFs are limited, and TAN is really the main one. In such a context, there is reason to believe that the SEC's decision on the XRP ETF and the impact of Trump's policies on nuclear power play a key role in the selection process. The SEC's approval of the natural redemption Bitcoin ETF and the impact of Trump's policies on the nuclear energy and oil markets are the most relevant here for this purpose.
To the question of the low returns of some energy ETFs, I tend to highlight those that are most affected by political instability. An example of a bad ETF that illustrates the low returns of energy ETFs is reverse ETFs. Indeed, there are many known problems with inverse leverage ETFs such as NRGD.P and DUG.P. These ETFs exhibit high volatility, in part precisely because of their inverse strategies, thereby amplifying market fluctuations and not keeping pace with decarbonization trends. These are some basic examples of bad choices, especially for long-term investors focused on growth sectors.
In addition, a comparison of one-year and three-year returns indicates that short-term volatility is higher, so diversified, low-cost ETFs with a good issuer reputation should be favored. Of course, political risks increase short-term volatility, but they also create long-term opportunities for nuclear and renewable energy ETFs.
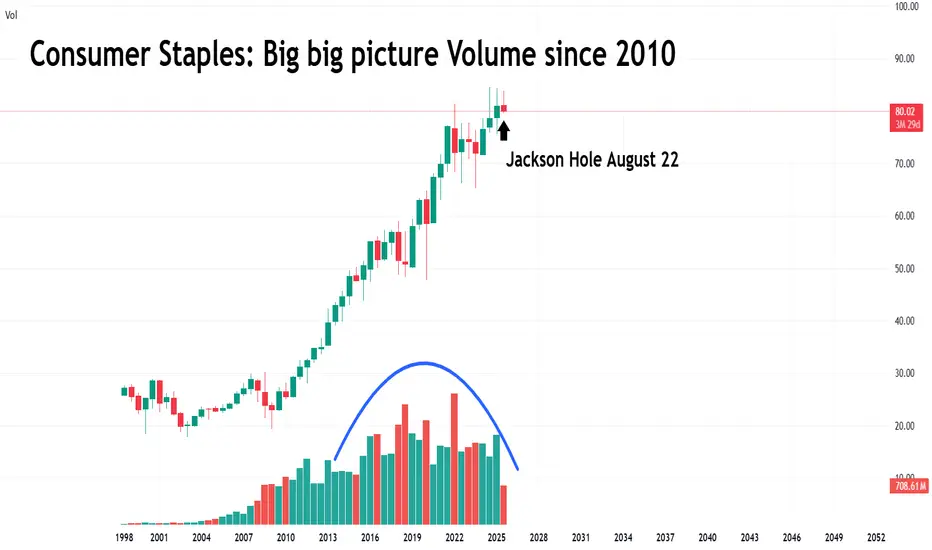
Consumer StaplesAfter Jackson Hole and the “announcement” of the upcoming rate cut, we saw a rotation into cyclical sectors at the expense of defensives. A rotation that came on declining volume. It caught our attention, so we went to look at the bigger picture of Staples. We found this trend confirmed by volume. We simply didn’t expect to see this chart. XLP over 6 months
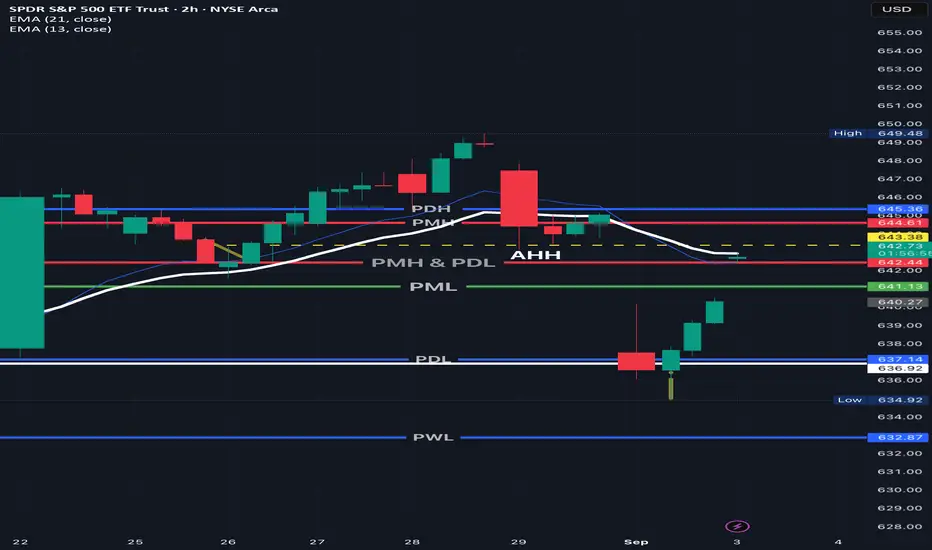
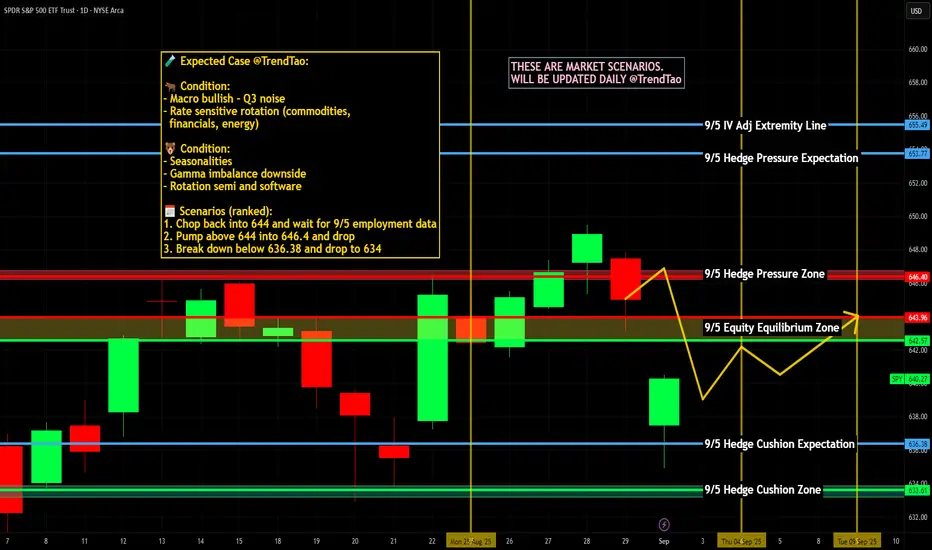
SPY daily LVL bulls or bears…September correction? 3 major levels to focus on today which are 640-647. Currently at 643 potentially waiting on 7am trend but watching these levels closely for market direction.
The market loves misdirection. Yesterday the market fell at open then held support. Today will the market gap then loose momentum to the upside? Let’s find out!
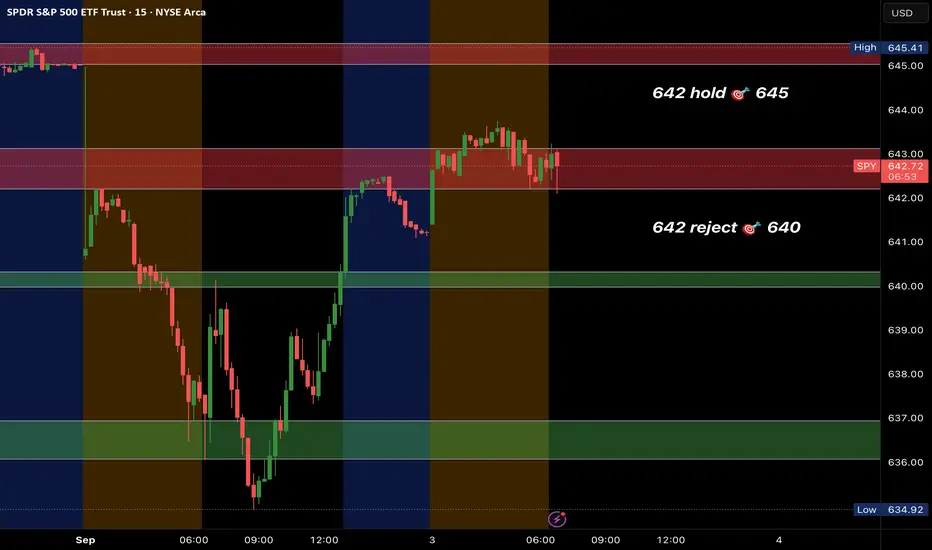
SPY SEP 3rd
3 scenarios. No guessing. Just react.
🟢 Bull Case
Trigger: Clears + holds 644 (PMH)
↳ Buyers show up, QQQ & NVDA strong, VIX chill.
Play:
• Long 644+
• Targets: 648 / 650
• Risk: <642
⚖️ Chop Zone
Trigger:Stuck 637–644
↳ No real push either way, just range + noise.
Play:
• Scalp 637 → 644
• Light size or sit out
• Avoid forcing
🔴 Bear Case
Trigger: Loses 637
↳ Volume picks up, VIX >17.5, macro weak.
Play:
• Short <637
• Targets: 634 / 630
• Risk: >639
🔍 Flow Clues
• DP walls: 643–648 = tough resistance
• Big puts stacked at 615/635
• Seasonality leans red ⚠️
📌 TL;DR
> 644+ = bulls push
> 637–644 = chop zone
> 637 = bears in charge
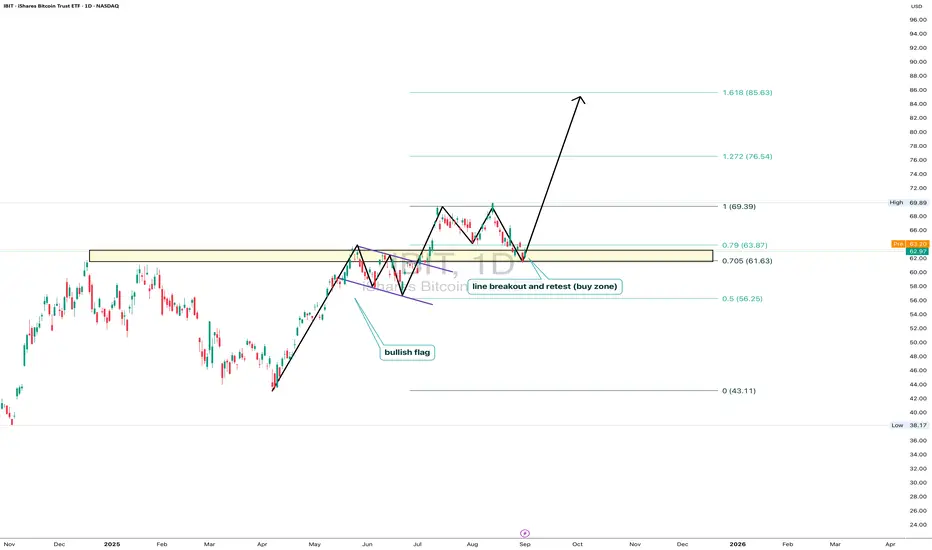
IBIT: ready for liftoffOn the daily chart, iShares Bitcoin Trust (IBIT) trades at $62.97, testing the key 0.705–0.79 Fibo zone ($61.63–63.87). This area marks a breakout and retest line, forming a clear buy zone. The technical structure remains bullish: after breaking out and pulling back, price holds potential to move toward $69.39, with Fibo extensions targeting $76.54 and $85.63. Volumes confirm buyer activity on dips, and the bullish flag pattern supports the continuation of the upward trend.
Fundamentally , the main driver is bitcoin itself, with institutional demand for BTC ETFs staying strong. Large funds continue accumulating positions, while expectations of a softer Fed tone add pressure on the dollar, fueling capital inflows into crypto. This strengthens the bullish case for IBIT.
Tactical plan: watch $61.6–63.8 as the key entry zone. Holding above opens the path toward $69.3, followed by $76.5 and $85.6. The scenario breaks only if price falls below $61.
And let’s be honest: IBIT isn’t just a ticker - it’s the “accelerate bitcoin” button for your portfolio.
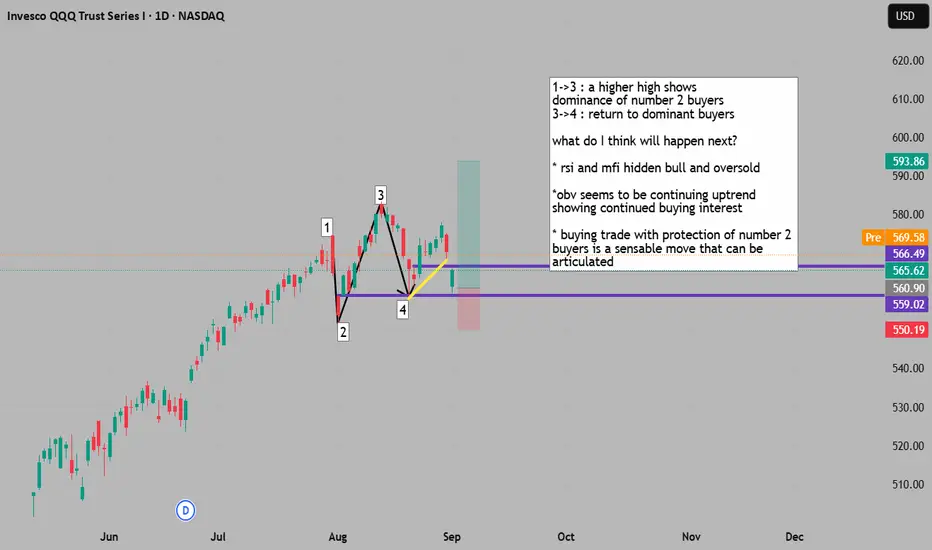
return to support provides uptrend continuation entry1->3 : a higher high shows
dominance of number 2 buyers
3->4 : return to dominant buyers
what do I think will happen next?
* rsi and mfi hidden bull and oversold
*obv seems to be continuing uptrend
showing continued buying interest
* buying trade with protection of number 2
buyers is a sensable move that can be
articulated
CI Canadian REIT ETF | Chart & Forecast SummaryKey Indicators On Trade Set Up In General
1. Push Set Up
2. Range Set Up
3. Break & Retest Set Up
Notes On Session
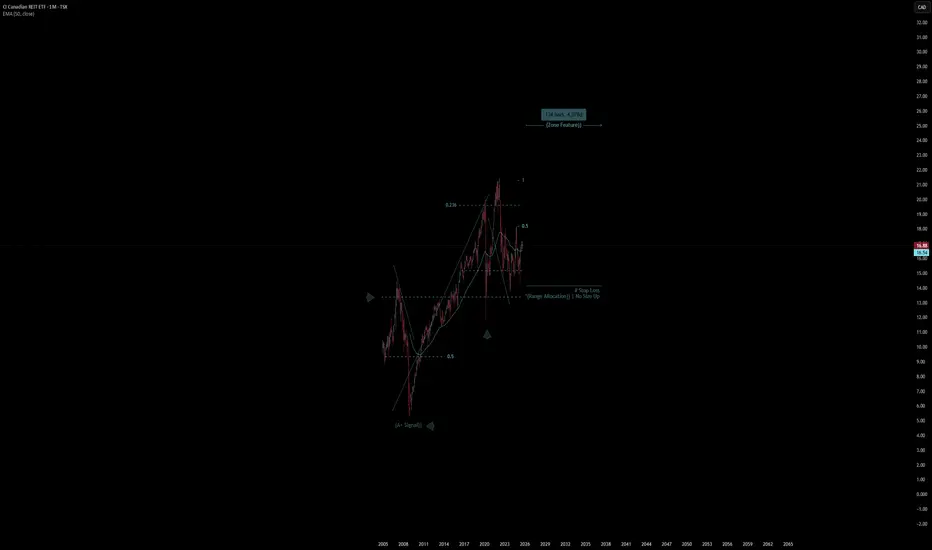
# CI Canadian REIT ETF
- Double Formation
* (A+ SIgnal)) - *50EMA - Long Entry | Subdivision 1
* (Range Allocation)) - *1.5RR | Completed Survey
* 134 bars, 4078d | Date Range Method - *Uptrend Argument))
- Triple Formation
* (P1)) / (P2)) & (P3)) | Subdivision 2
* Monthly Time Frame | Trend Settings Condition | Subdivision 3
- (Hypothesis On Entry Bias)) | Regular Settings
* Stop Loss Feature Varies Regarding To Main Entry And Can Occur Unevenly
- Position On A 1.5RR
* Stop Loss At 12.00 CAD
* Entry At 15.00 CAD
* Take Profit At 20.00 CAD
* (Uptrend Argument)) & No Pattern Confirmation
- Continuation Pattern | Not Valid
- Reversal Pattern | Not Valid
* Ongoing Entry & (Neutral Area))
Active Sessions On Relevant Range & Elemented Probabilities;
European-Session(Upwards) - East Coast-Session(Downwards) - Asian-Session(Ranging)
Conclusion | Trade Plan Execution & Risk Management On Demand;
Overall Consensus | Buy
Role of WTO in International TradeIntroduction
International trade is the backbone of the global economy. Countries depend on each other for raw materials, technology, consumer goods, and services. To ensure that this complex web of exchanges remains smooth, fair, and beneficial for all, there must be rules, institutions, and mechanisms for dispute resolution. The World Trade Organization (WTO) plays this central role.
Established in 1995, the WTO replaced the General Agreement on Tariffs and Trade (GATT), which had guided world trade since 1948. Today, it is the only global international organization dealing with the rules of trade between nations. Its primary goal is to help producers of goods and services, exporters, and importers conduct business with as little friction as possible.
The WTO functions as both a forum for trade negotiations and a dispute settlement body. Its agreements, signed by the majority of trading nations, cover not just goods but also services and intellectual property rights. With 164 member countries (as of 2025), representing more than 98% of global trade, the WTO is a critical pillar of globalization.
This essay explores in detail the role of the WTO in international trade, covering its objectives, functions, agreements, dispute settlement system, impact on developed and developing nations, criticisms, and the challenges it faces in the 21st century.
Historical Background
From GATT to WTO
1947: The General Agreement on Tariffs and Trade (GATT) was established after World War II to encourage trade liberalization and economic recovery.
Focus: GATT dealt primarily with trade in goods and sought to reduce tariffs and quotas.
Limitations: GATT was a provisional arrangement and lacked strong enforcement mechanisms. It struggled to handle new trade areas like services, intellectual property, and agriculture.
Creation of the WTO
Uruguay Round (1986–1994): After years of negotiations, member countries agreed to create a stronger institution.
1995: The WTO officially replaced GATT. Unlike GATT, the WTO had a permanent institutional framework, a wider scope, and stronger dispute settlement powers.
Objectives of the WTO
The WTO’s objectives are enshrined in its founding agreements. Some of the key goals include:
Promote Free and Fair Trade
Reduce trade barriers (tariffs, quotas, subsidies).
Ensure equal opportunities for all trading partners.
Establish a Rules-Based System
Provide a transparent, predictable framework for international trade.
Encourage Economic Growth and Employment
Facilitate trade flows that contribute to global economic expansion.
Protect and Preserve the Environment
Ensure trade rules align with sustainable development.
Integrate Developing and Least Developed Countries (LDCs)
Provide special provisions to help them benefit from global trade.
Functions of the WTO
The WTO carries out several critical functions that shape the global trading system:
1. Administering Trade Agreements
The WTO oversees a vast set of agreements that cover goods, services, and intellectual property rights.
Examples: GATT 1994, General Agreement on Trade in Services (GATS), Trade-Related Aspects of Intellectual Property Rights (TRIPS).
2. Acting as a Forum for Trade Negotiations
Members negotiate trade liberalization, new agreements, and reforms.
Example: The ongoing Doha Development Round focused on agricultural subsidies and development issues.
3. Handling Trade Disputes
The WTO provides a structured dispute settlement mechanism.
Example: The US-EU dispute over subsidies to Boeing and Airbus was handled by WTO panels.
4. Monitoring National Trade Policies
Through the Trade Policy Review Mechanism (TPRM), WTO evaluates members’ trade policies to ensure transparency.
5. Technical Assistance and Training
WTO supports developing and least-developed countries by offering training, capacity-building, and special provisions.
6. Cooperation with Other International Institutions
Works with IMF, World Bank, and UN to coordinate trade and financial stability.
WTO Agreements and Coverage
The WTO’s framework is built on a comprehensive set of agreements covering multiple areas of trade.
1. Trade in Goods (GATT 1994)
Rules governing tariffs, quotas, subsidies, anti-dumping measures.
Special agreements on agriculture, textiles, and sanitary measures.
2. Trade in Services (GATS)
Covers sectors like banking, telecommunications, transport, education, and healthcare.
Promotes liberalization of service industries across borders.
3. Intellectual Property Rights (TRIPS)
Protects patents, trademarks, copyrights, and trade secrets.
Ensures innovation while balancing access, especially for medicines.
4. Dispute Settlement Understanding (DSU)
Provides legally binding dispute resolution through panels and an appellate body.
Ensures compliance with rulings.
5. Plurilateral Agreements
Not binding on all members, but important in niche areas.
Example: Agreement on Government Procurement (GPA).
Role of WTO in Promoting International Trade
1. Trade Liberalization
WTO promotes lowering of tariffs and non-tariff barriers.
Example: The Information Technology Agreement (ITA) eliminated tariffs on IT products.
2. Ensuring Fair Competition
Prevents unfair practices like dumping and excessive subsidies.
Allows safeguard measures when domestic industries are threatened.
3. Dispute Resolution
Provides a neutral, rules-based process for settling trade conflicts.
Avoids trade wars and unilateral retaliations.
4. Encouraging Transparency
Members must notify trade measures and policies.
Enhances predictability for businesses.
5. Helping Developing Countries
Special and Differential Treatment (SDT) provisions allow flexibility.
Example: Longer time frames for implementing commitments.
Case Studies of WTO’s Role
1. US–China Trade Disputes
Numerous disputes over intellectual property rights, tariffs, and subsidies.
WTO acted as a mediator, though recent tensions have tested its authority.
2. Bananas Dispute (EU vs. Latin American Countries)
EU’s banana import regime discriminated against Latin American exporters.
WTO panels ruled in favor of Latin American countries.
3. India’s Solar Panels Case
US challenged India’s domestic content requirements for solar power.
WTO ruled against India, showing the clash between trade rules and environmental goals.
Role for Developing and Least Developed Countries
The WTO plays a crucial role in integrating developing nations into global trade.
Market Access: WTO commitments open markets for exports.
Capacity Building: Technical assistance and training programs.
Flexibility: Longer transition periods for reforms.
Special Safeguards: Protection for vulnerable sectors like agriculture.
Example: African nations benefit from WTO’s Aid for Trade initiative.
Criticisms of the WTO
Despite its role, the WTO faces significant criticism:
Favoring Developed Nations
Rules on intellectual property and subsidies often benefit wealthy countries.
Stalled Negotiations
The Doha Round has been largely unsuccessful due to disagreements.
Dispute Settlement Crisis
Since 2019, the Appellate Body has been paralyzed because the US blocked appointments.
Environmental Concerns
Critics argue WTO prioritizes trade over climate change and sustainability.
Limited Inclusiveness
Small economies struggle to influence negotiations dominated by large economies.
Challenges for WTO in the 21st Century
Rise of Protectionism
Trade wars (e.g., US-China) undermine WTO rules.
Digital Trade and E-commerce
WTO lacks comprehensive rules for cross-border digital trade.
Climate Change and Sustainability
Balancing environmental protection with trade liberalization.
Geopolitical Tensions
Rivalries between major economies weaken global consensus.
Reform of Dispute Settlement
Restoring credibility by fixing the Appellate Body crisis.
Future Role of WTO
The WTO must evolve to remain relevant:
Revive Multilateralism: Rebuild trust in global trade rules.
Strengthen Dispute Resolution: Restore a fully functioning appellate system.
Adapt to Digital Trade: Frame rules for e-commerce, data flows, and digital taxation.
Promote Inclusive Growth: Ensure benefits reach developing and least-developed countries.
Support Green Trade: Align trade rules with climate commitments.
Conclusion
The World Trade Organization remains a cornerstone of international trade. Since 1995, it has provided a rules-based system that promotes predictability, reduces trade barriers, and offers a platform for resolving disputes. It has played a vital role in integrating developing nations into the global economy.
However, its credibility has been challenged by stalled negotiations, the crisis in dispute settlement, and rising protectionism. The future of the WTO depends on its ability to reform, embrace digital trade, support sustainability, and balance the interests of both developed and developing nations.
In an interconnected world, no country can afford to isolate itself from global trade. The WTO, despite its shortcomings, is indispensable in ensuring that trade remains a force for prosperity, cooperation, and peace.
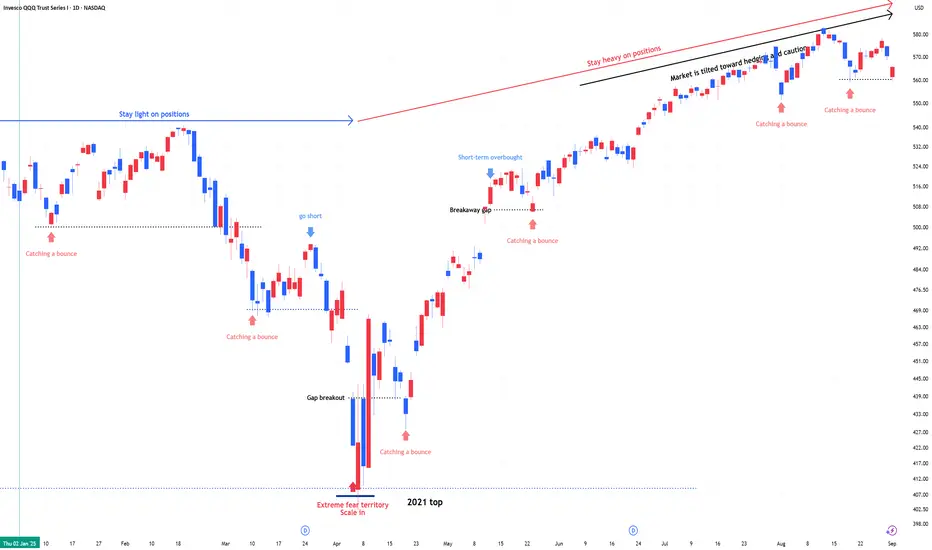
QQQ : Stay heavy on positionsQQQ : Stay heavy on positions (QLD, TQQQ)
In stay light on positions zones, I hold QQQ and reduce exposure.
In stay heavy on positions zones, I increase allocation using a mix of QLD and TQQQ.
** This analysis is based solely on the quantification of crowd psychology.
It does not incorporate price action, trading volume, or macroeconomic indicators.
$SPY / $SPX Scenarios — Wednesday, Sept 3, 2025🔮 AMEX:SPY / SP:SPX Scenarios — Wednesday, Sept 3, 2025 🔮
🌍 Market-Moving Headlines
🏦 Traders bracing for a labor + Fed double header — ADP jobs and the Beige Book will steer rate-cut odds into Friday’s NFP.
📉 Stocks drifted Tuesday post-JOLTS miss — markets looking for confirmation of labor cooling.
💻 Tech earnings rotation continues — volatility in AMEX:XLK spilling into broader tape.
📊 Key Data & Events (ET)
⏰ 7:00 AM — MBA Mortgage Applications
⏰ 🚩 8:15 AM — ADP Employment Report (Aug)
⏰ 10:00 AM — ISM Services PMI (Aug)
⏰ 🚩 2:00 PM — Fed Beige Book
⚠️ Disclaimer: Educational/informational only — not financial advice.
📌 #trading #stockmarket #SPY #SPX #ADP #BeigeBook #Fed #labor #ISM #bonds #economy
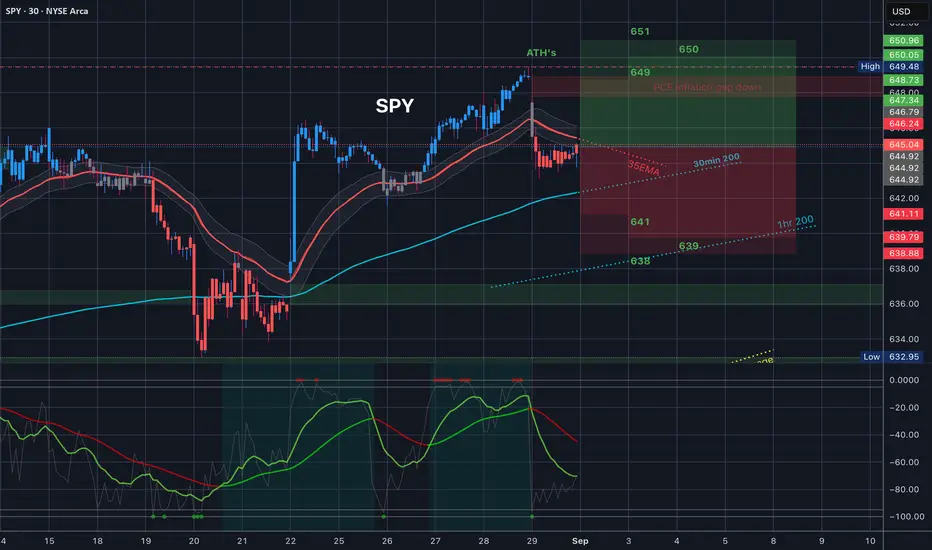
$SPY Trading Range for 9.2.25
Tomorrow’s Trading range looks fun. All of Friday’s candle’s were red, and we have the 35EMA as resistance. Under that we have the 30min 200MA so definitely keep an eye out for that, it is still facing up so it should offer some support - even if just for a technical bounce.
At the top of the trading range we have a bear gap just under ATH’s.
Let me know how you plan to trade this. Let’s make some money.
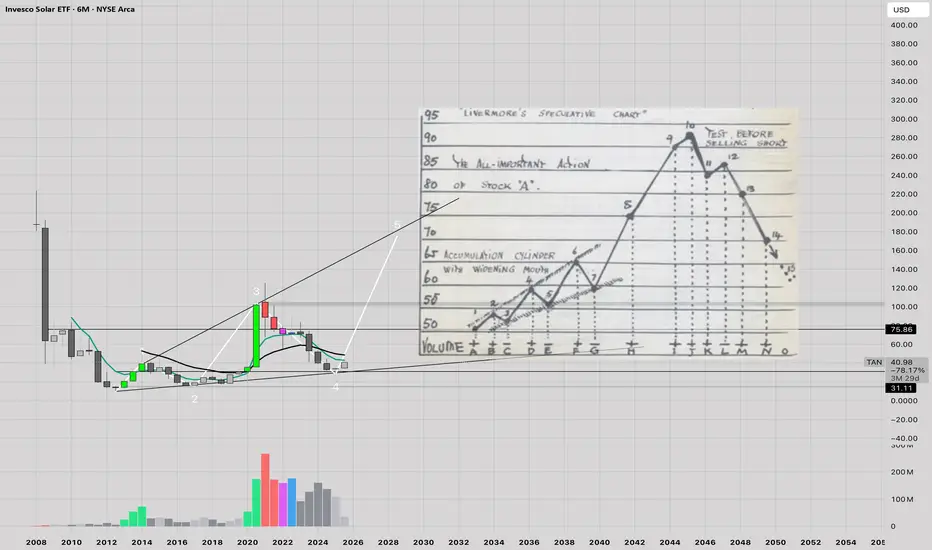
Starlight is the future ?"As we progress along the Kardashev Scale, energy harnessed on Earth will increase a hundredfold and will mostly be solar aka fusion aka starlight.
Then energy harnessed will increase perhaps a billionfold if we make it to Kardashev II, with space solar power, and another billionfold if we harness the energy of our galaxy. " - Elon Musk
If solar energy was really the future wouldn't this get accumulated? I guess we are about to find out .
Targets: higher, stoploss: 0
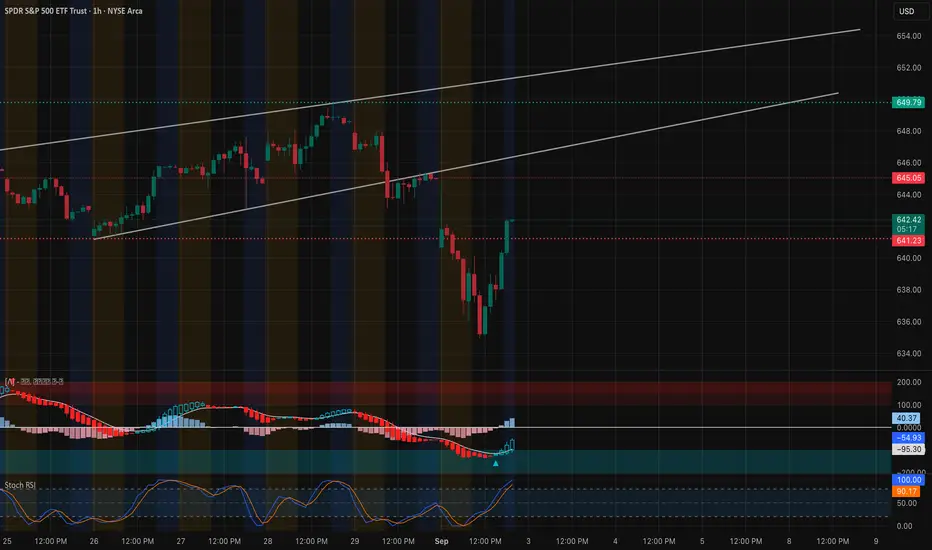
SPY Technical Analysis-September 3SPY is rebounding strongly off the 633–634 demand zone, reclaiming ground after the recent selloff. Price is now pressing into the middle of the broader ascending channel, with momentum shifting back toward the bulls.
* Resistance: The key zone sits at 644–647, where prior supply converges with the midline of the channel. This is also where sellers previously capped rallies.
* Support: Immediate support lies at 640–641, the pivot level that bulls must defend. If this breaks, downside flows reopen toward 639 → 637 → 634.
* Indicators: MACD has flipped bullish with rising histogram, showing positive momentum. Stoch RSI is overbought, suggesting some near-term exhaustion risk unless price pushes through resistance quickly.
🔍 Options / GEX Confirmation
* Resistance:
* 644–647 matches a heavy call wall cluster, confirming overhead resistance.
* Dealers are short calls here, creating a ceiling unless broken with volume.
* Support:
* 641 aligns with the 3rd put wall and heavy negative gamma → if this level fails, hedging accelerates downside.
* 637–634 confirmed as the next strong support band.
This confirms the chart view: 641–647 is the critical battleground.
🎯 Trade Scenarios
* Bullish: Hold above 641 and break through 647 with strong volume → upside opens toward 650–652.
* Bearish: Failure at 644–647 or breakdown under 641 → downside targets 639 → 634.
🧠 Final Take
SPY’s rebound has momentum, but the 644–647 zone is the make-or-break level. Clearing it would shift the bias back to the upside, targeting 650+. Failure to do so likely triggers a rejection and renewed selling pressure back toward 634.
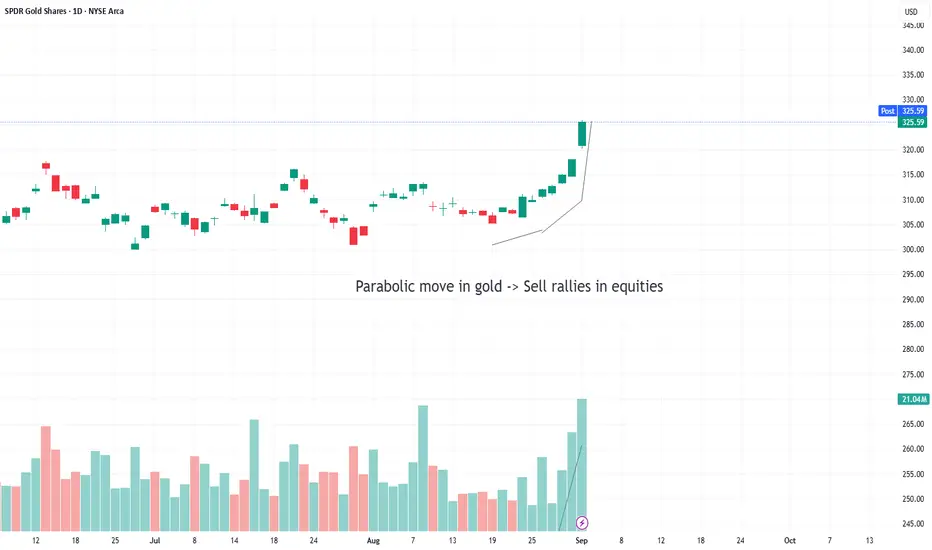
Gold's parabolic move represents fear Until the parabolic Gold rally dies, you must sell any rallies in equities, QQQ or SPY, etc.