Nightly $SPY / $SPX Scenarios for June 12, 2025🔮 Nightly AMEX:SPY / SP:SPX Scenarios for June 12, 2025 🔮
🌍 Market-Moving News 🌍
💱 Dollar Slides on Trade Truce Hopes & Fed Outlook
The U.S. dollar dropped 0.4%—its lowest level since April 22—after President Trump signaled flexibility on a July 8 trade deadline and U.S.–China talks showed renewed progress, boosting expectations for Fed rate cuts
📊 S&P Shiller CAPE Hints at Overvaluation Risk
Stocks and bonds rallied following rebound, but valuation metrics flash caution: the S&P 500 now sits in the 94th percentile of Shiller CAPE, and equity risk premium has dropped to zero. Analysts warn these levels often precede corrections
🛢️ Oil Holds at Seven-Week Highs
Oil prices remain near seven-week highs (~$66–67/barrel), supported by gradual OPEC+ output increases and hopes that easing trade tensions will aid demand
📈 CPI Cools Again, Bonds Climb
U.S. consumer inflation rose just 0.1% in May (2.4% YoY), easing expectations for tighter Fed policy. Consequently, Treasury yields softened and bond markets outperformed equities
📊 Key Data Releases 📊
📅 Thursday, June 12:
8:30 AM ET – Producer Price Index (May)
An early gauge of inflation at the wholesale level—may reinforce the cooling trend seen in CPI.
8:30 AM ET – Initial & Continuing Jobless Claims
Weekly updates on unemployment filings. Key to monitor for labor-market tightening or softening.
⚠️ Disclaimer:
This report is for educational and informational purposes only—it does not constitute financial advice. Always consult a licensed financial advisor before making investment decisions.
📌 #trading #stockmarket #economy #news #trendtao #charting #technicalanalysis
ETF market
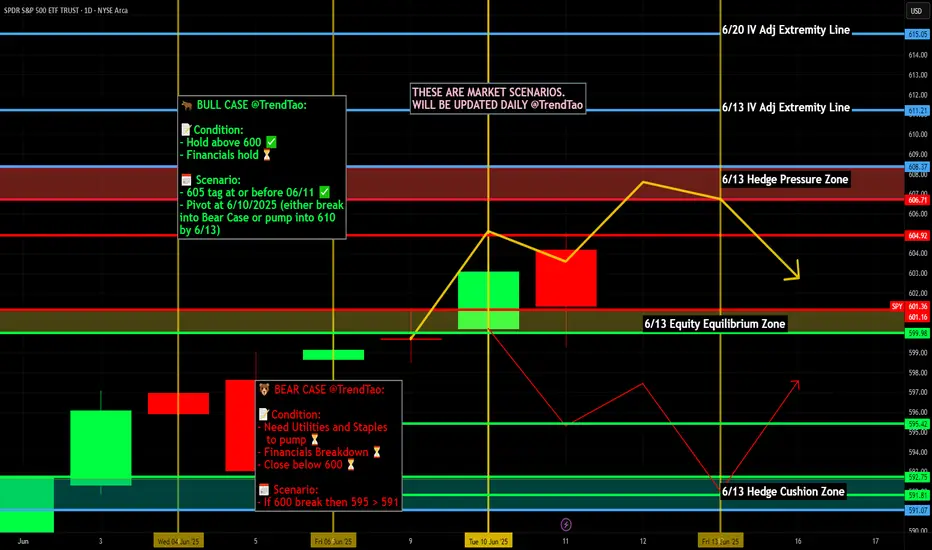
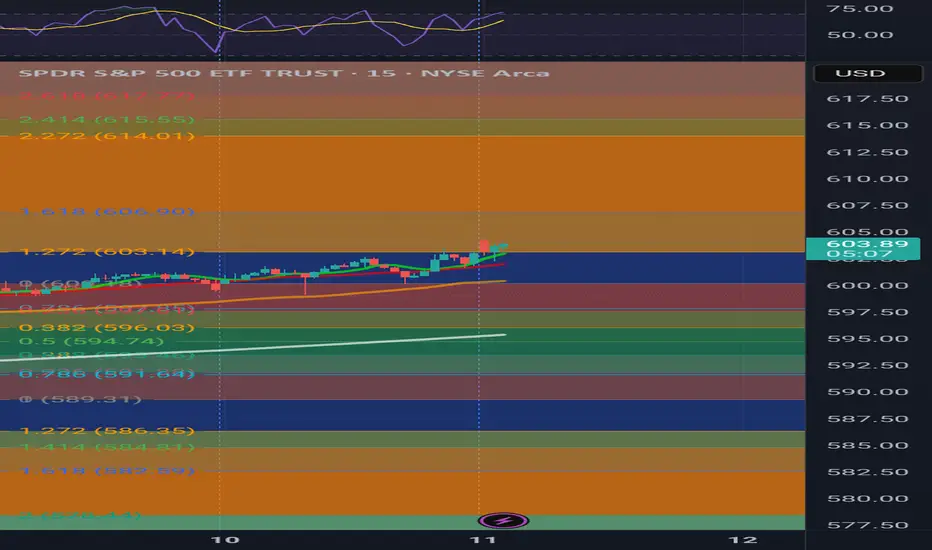
SPY SHORT FROM RESISTANCE|
✅SPY went up to retest
A horizontal resistance of 610$
Which is also an All-Time-High
So its a very strong level
Which makes me locally bearish biased
And I think that we will see a pullback
And a move down from the level
Towards the target below at 596.43$
SHORT🔥
✅Like and subscribe to never miss a new idea!✅
Disclosure: I am part of Trade Nation's Influencer program and receive a monthly fee for using their TradingView charts in my analysis.

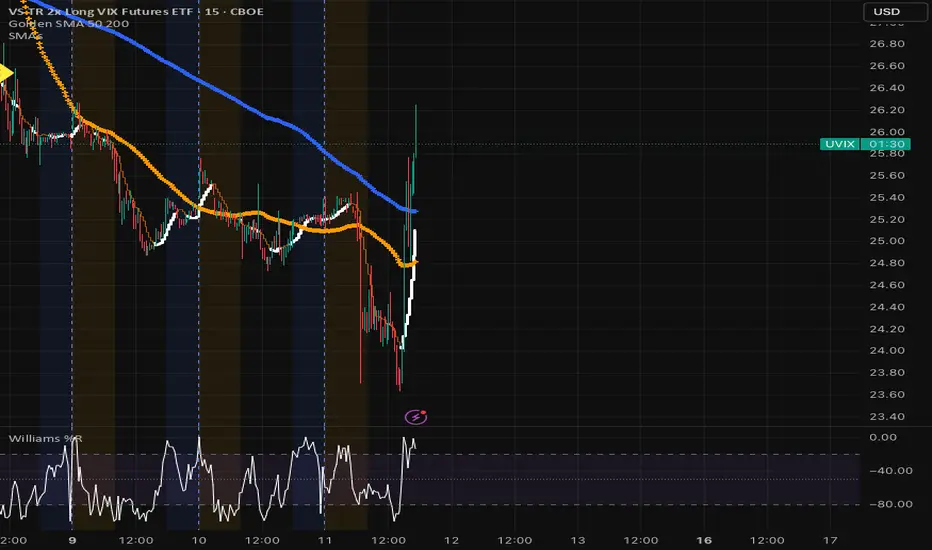
UVIX is your BEST insurance policy against the market!I've said this many times before, UVIX is an absolute gem if you know how to trade it. It's one of the only ETFs that has a mean reversal. The market is over heated and there's really nothing behind it except hot air, no major fundamentals. The economy is cooling, and you should be ready. Learn how to trade UVIX, monthly spikes that over compensate the lulls.
Best of luck and always do your own DD, I did!
$QQQ WARNING! 6-7% Downside Possible🚨 NASDAQ:QQQ WARNING! 🚨
Holding steady... for now.
But if we break down out of the Daily WCB and through this wedge, it’s game over—GAP FILL incoming!
💥 MM: $493.31 MT: 16 July 💥
If that happens, I’m cutting all swings FAST. Stay sharp!
Afternoon UpdateOn spy and sp500 we have a potential breakdown, but nothing is confirmed as of now. Gold may rally above it's resistance. OIl looks like it will fill it's gap at 71 dollars. BTC is coming down but it's still hard to read it. Natural Gas is at support but I believe it goes lower.

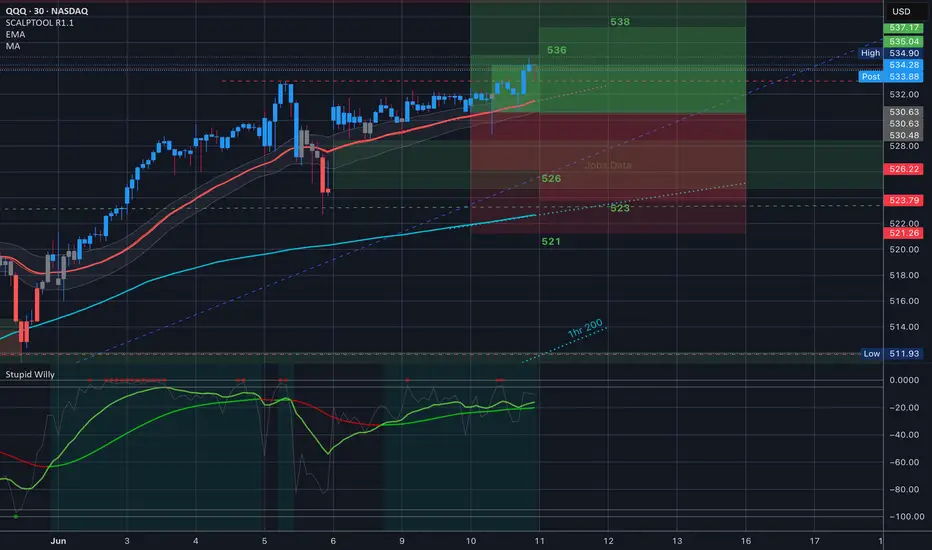
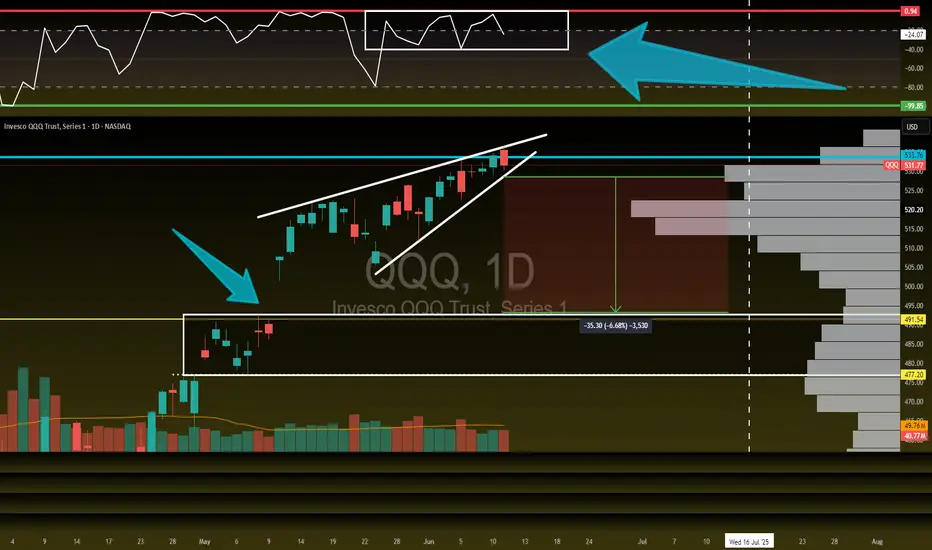
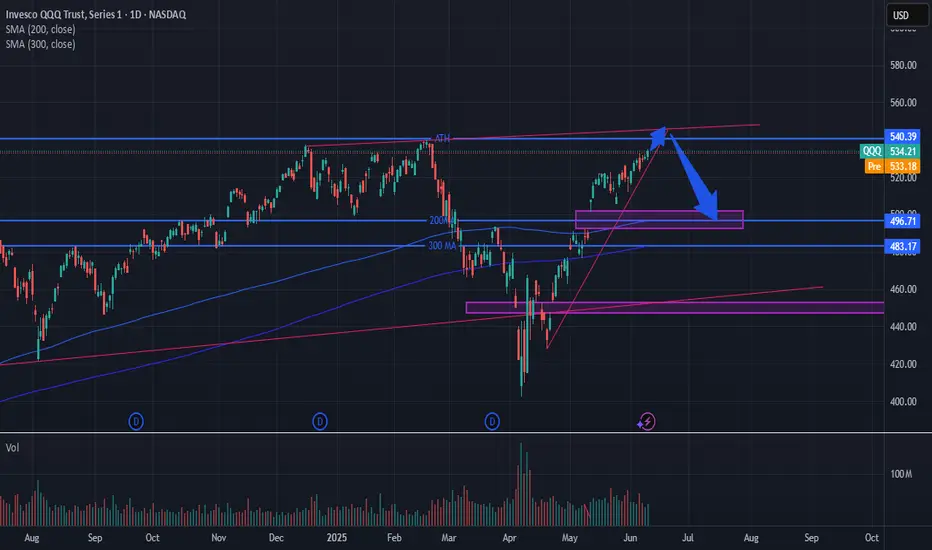
$QQQ — Bearish Setup Forming Near Highs📉 NASDAQ:QQQ — Bearish Setup Forming Near Highs
Technical Confluence:
Rising wedge structure into prior highs
RSI bearish divergence (momentum fading)
Volume steadily drying up on this recent move
Price stalling under key resistance zone (Feb–April supply)
Execution Plan:
I’ve tightened stops across swing positions
Trailing a AMEX:PSQ buy order in case of wedge breakdown
Watching for a move below ~$530 for confirmation
If triggered, downside targets:
T1: $518 (20 EMA)
T2: $496 (200 SMA)
T3: $470 (gap + structural support)
Risk View:
I’m not predicting — I’m preparing. Structure is extended, internals weakening. Staying nimble, ready for reversal or breakout invalidation.
📊 Feedback welcome
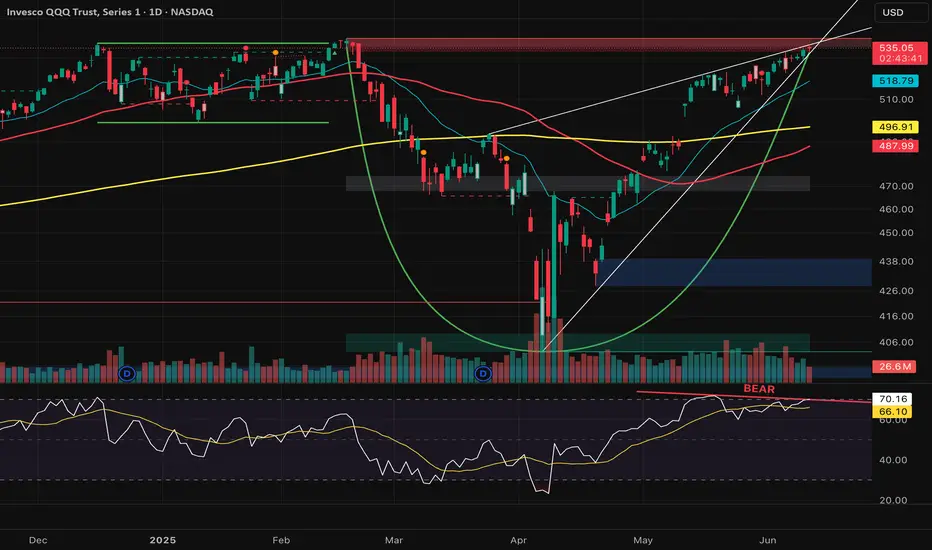
QQQ: RetraceWith the rising wedge pattern forming on QQQ, I think we see a retrace to the MAs and the previous resistance at 493 to fill the gap. We have seen a huge bounce and I think we'll see some profit taking up here near the highs. The RSI has also become overbought as well, so I expect a retrace in the next couple of months.

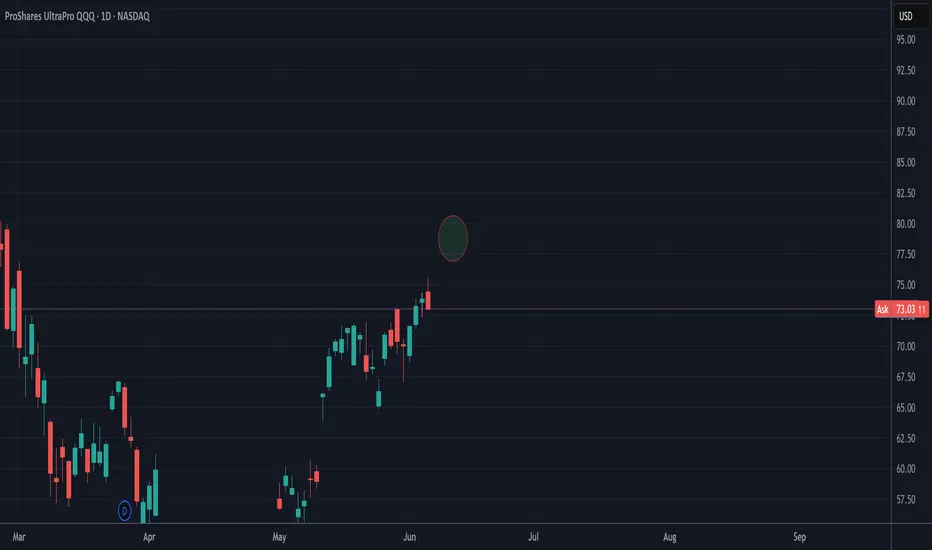
$TQQQ - $78 ishHey guys, the AI helped me ride the wayve from 68 all the way to 76. With a small pullback the AI says we'll see something around the range of 77.5 ish, closer to 78 quite soon.
Would buy all opporutnites below the 75 range. Anything below 72.5 is a crazy buy and anything below $70 for the moment means one asks their relatives for a small loan of 1 billion dollars for a quick investment.
Will be sharing the AI with the public once it's ready for public consumption.
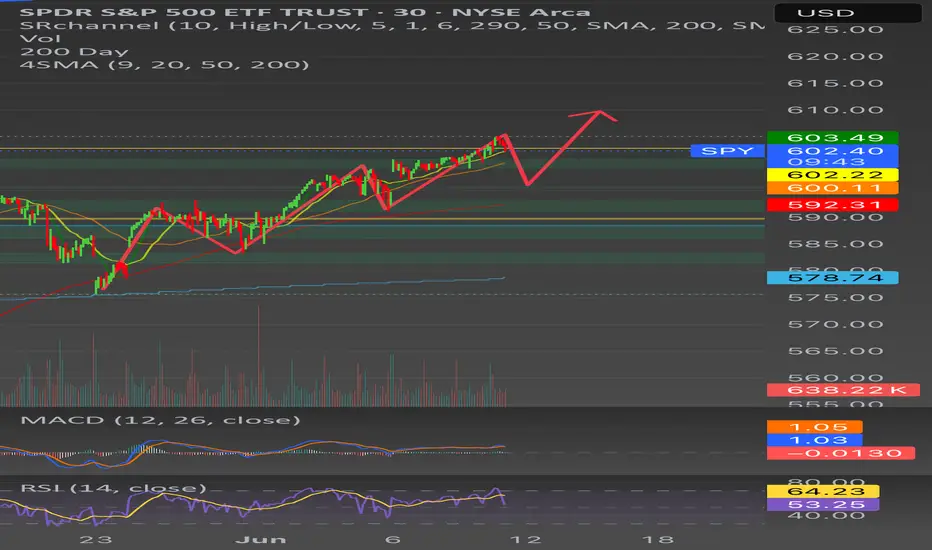
607 EOD Non uclidean Mathematics Dual Band Fibbonaci📍 SPY is now accelerating through the 1.272–1.618 active band.
📍 607 is the next harmonic projection level on the mirrored Non-Euclidean spectrum.
📍 No rejection at Passive ⇒ continuation through Active ⇒ magnet to 607.
SPY/QQQ Plan Your Trade For 6-11: Bottom-Base Rally Counter TrndToday's counter-trend Bottom-Base Rally pattern suggests the markets may attempt to find a peak and roll over into a downtrend.
The normal Bottom-Base Rally pattern is similar to the start of a moderate price base/bottom, then moving into a moderate rally phase.
In counter-trend mode this pattern would be inverted - forming a Top and then moving into a downward price trend.
I've been warning of the potential of a rollover top type of pattern in the SPY over the past few weeks - but it never really setup/confirmed.
I'll be curious to see if this counter-trend pattern, today, sets up some type of big top formation in the SPY/QQQ. It might be related to news as well.
Gold and Silver have a Gap-Stall-Revert-FLUSH pattern. This is always an interesting pattern because is suggests price is going to attempt to either gap and trend or stall and revert. My guess is we are looking at more trending in metals today.
Platinum is RIPPING higher (PL1!). Because of this, I believe Silver and Gold will attempt to follow Platinum and move to the upside today.
BTCUSD is stalling a bit. We'll see if we get any big price move in Bitcoin today. After the big rally over the past few days, it will be interesting to see if BTCUSD reverts downward or continues higher.
Overall, today's patterns suggest the markets are seeking direction. Get ready for an exciting day in the markets.
Get some.
#trading #research #investing #tradingalgos #tradingsignals #cycles #fibonacci #elliotwave #modelingsystems #stocks #bitcoin #btcusd #cryptos #spy #gold #nq #investing #trading #spytrading #spymarket #tradingmarket #stockmarket #silver

QQQ to tap ATH then fill the May 12th gapQQQ to tap ATH or just above based on the trend line then retrace to fill the May 12th gap.
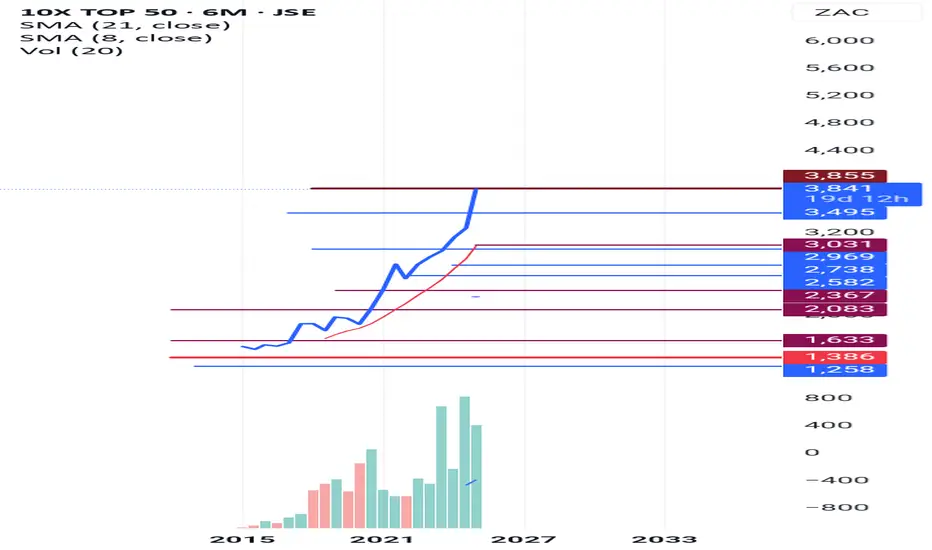
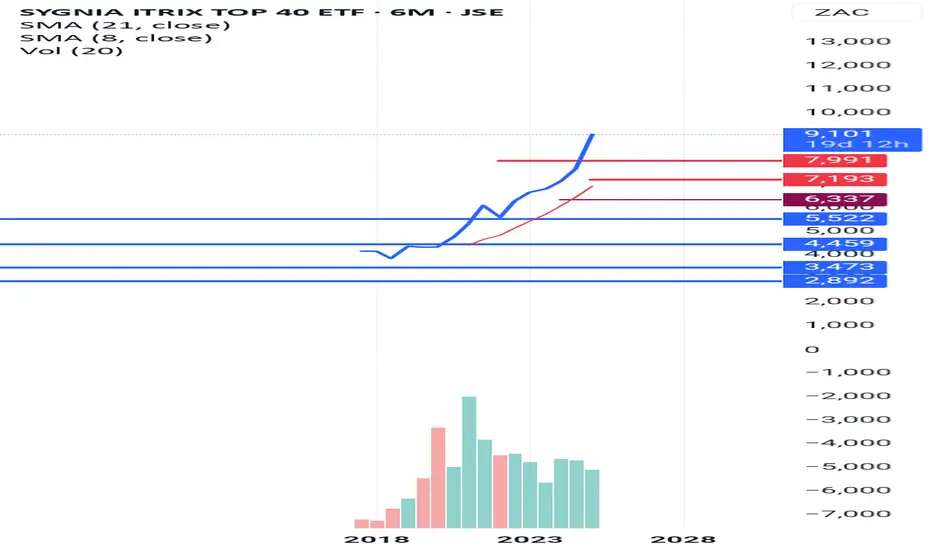
TOP50 JSE INDEX FUND Is this INDEX FUND track top50 companies in the JSE,invest in this index fund ETF using RAND-COST AVERAGING TO avoid gambling 🎰
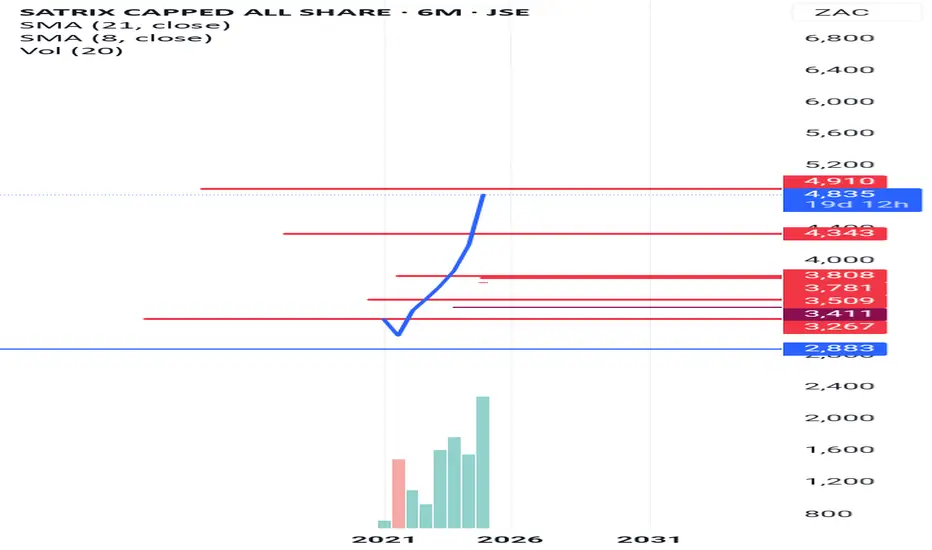
CAPPED ALL SHARES JSE INDEX ETF Is the index fund that capped all shares that are traded in JSE, use RAND-COST AVERAGING to invest in this ETF
TOP4O JSE ETFInvest in this ETF using rand-cost averaging, that a better way to avoid gambling in the investment is not simply to pick the stocks, that will dominant the market
Nightly $SPY / $SPX Scenarios for June 11, 2025🔮 Nightly AMEX:SPY / SP:SPX Scenarios for June 11, 2025 🔮
🌍 Market-Moving News 🌍
🤝 Cautious Optimism on U.S.–China Trade Progress
Markets responded positively to fresh developments in ongoing U.S.–China trade talks, with S&P 500 and Nasdaq closing ~0.6% higher — the third straight day of gains — on hopes of easing trade barriers
📉 Treasury Yields Climb as Auction Approaches
Bond investors grew cautious ahead of a key Treasury debt auction and incoming U.S. inflation data. The 10-year yield stayed elevated, weighing modestly on equities .
💹 Global Markets Showing Resilience
Asian and European markets tracked U.S. gains midweek, driven by trade-talk optimism, despite lingering concerns over slower global growth and debt levels .
📊 Key Data Releases 📊
📅 Wednesday, June 11:
(No major U.S. releases — focus remains on market reactions to trade talks and Treasury auctions.)
⚠️ Disclaimer:
This information is for educational and informational purposes only and should not be construed as financial advice. Always consult a licensed financial advisor before making investment decisions.
📌 #trading #stockmarket #economy #news #trendtao #charting #technicalanalysis

XLV Stock Chart Fibonacci Analysis 061025Trading Idea
1) Find a FIBO slingshot
2) Check FIBO 61.80% level
3) Entry Point > 136/61.80%
Chart time frame:D
A) 15 min(1W-3M)
B) 1 hr(3M-6M)
C) 4 hr(6M-1year)
D) 1 day(1-3years)
Stock progress:B
A) Keep rising over 61.80% resistance
B) 61.80% resistance
C) 61.80% support
D) Hit the bottom
E) Hit the top
Stocks rise as they rise from support and fall from resistance. Our goal is to find a low support point and enter. It can be referred to as buying at the pullback point. The pullback point can be found with a Fibonacci extension of 61.80%. This is a step to find entry level. 1) Find a triangle (Fibonacci Speed Fan Line) that connects the high (resistance) and low (support) points of the stock in progress, where it is continuously expressed as a Slingshot, 2) and create a Fibonacci extension level for the first rising wave from the start point of slingshot pattern.
When the current price goes over 61.80% level , that can be a good entry point, especially if the SMA 100 and 200 curves are gathered together at 61.80%, it is a very good entry point.
As a great help, tradingview provides these Fibonacci speed fan lines and extension levels with ease. So if you use the Fibonacci fan line, the extension level, and the SMA 100/200 curve well, you can find an entry point for the stock market. At least you have to enter at this low point to avoid trading failure, and if you are skilled at entering this low point, with fibonacci6180 technique, your reading skill to chart will be greatly improved.
If you want to do day trading, please set the time frame to 5 minutes or 15 minutes, and you will see many of the low point of rising stocks.
If want to prefer long term range trading, you can set the time frame to 1 hr or 1 day.


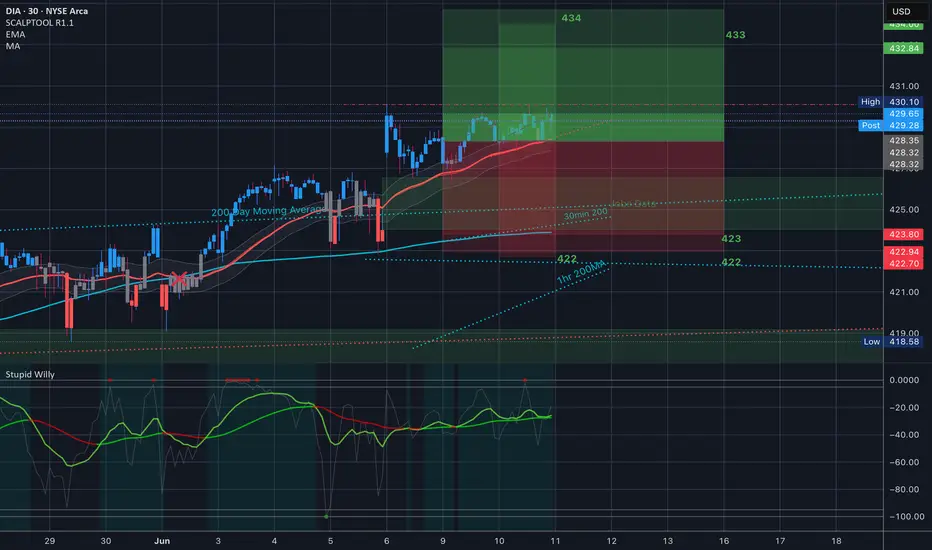
$DIA // June 10 2025 // Analysis & Targets for Day Traders
DIA sticking to that resistance from last Thursday here ahead of Inflation Data!!
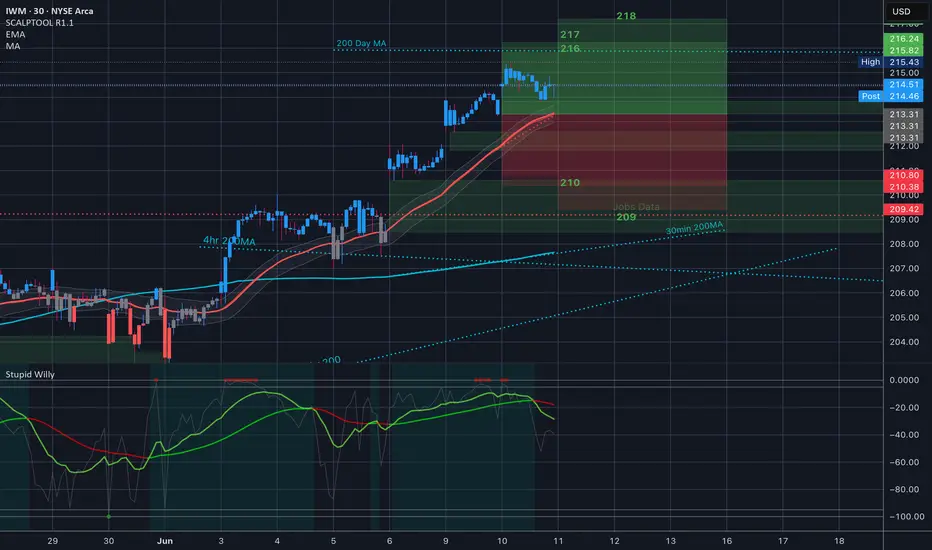
$IWM // June 10 2025 // Analysis & Targets for Day Traders
IWM gapped up for the third trading session in a row. That 200Day Moving average is clearly the target.
$QQQ // June 10 2025 // Analysis & Targets for Day Traders
QQQ really made use of today’s setup. Green signal line, above the 35EMA - making a run to the top of the implied move to close within it!!