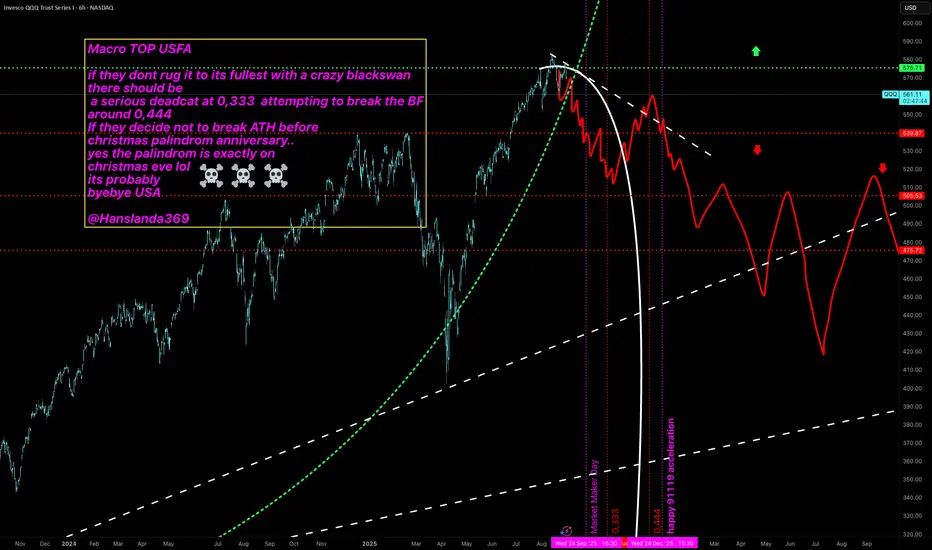
USFA lights out Macro TOP USFA
if they dont rug it to its fullest with a crazy blackswan
there should be
a serious deadcat at 0,333 attempting to break the BF
around 0,444
If they decide not to break ATH before
christmas palindrom anniversary..
yes the palindrom is exactly on
christmas eve lol
its probably
byebye USA
@Hanslanda369
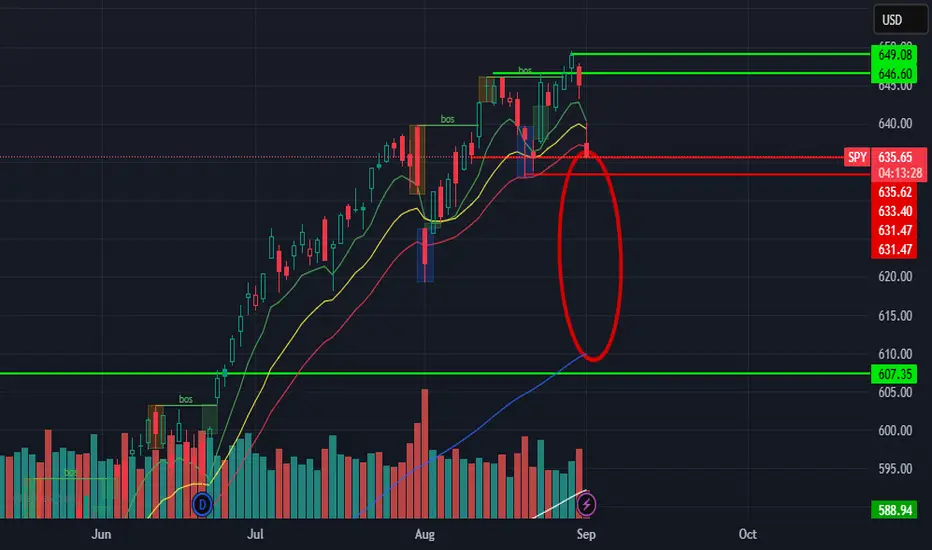
ETF market
short scenarioWhen The moving averages are spaced out there is a correction coming. and with the amount of space in this gap the anticipated correction could be major!!! what news is going to come out. But this level is completely obliterated
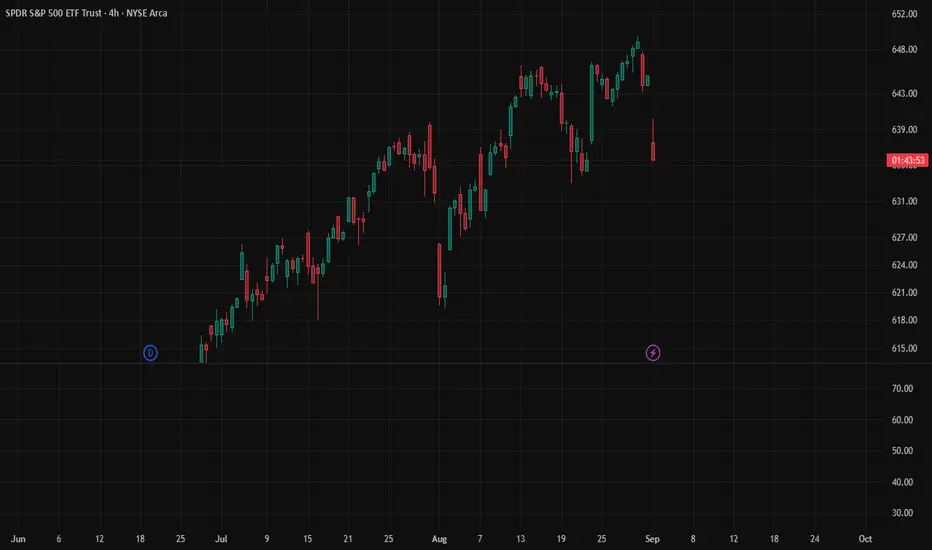
“From Mountain to Collapse: SPY Faces 630 Test”📖 Crown Point Research
1️⃣ Date & Time
Date: 2nd September 2025
Time: Pre-Market | 09:15 PM IST
2️⃣ Fundamental News
No major Fed statements or policy updates overnight.
This move is purely structural: technical rejection at higher chambers + pre-payroll caution across markets.
3️⃣ Public Sentiment & Human Behaviour
Retail psychology: Traders treated $640–645 as breakout continuation zones, rushing in.
Institutional behaviour: Institutions sold into resistance, distributing supply near 645–650.
Social Signal: Headlines still project bullish “market strength,” but structure = pullback, not extension.
4️⃣ Current Structure
Macro
Resistance: 645–650
Support: 630–628
Stage: Macro = Mountain Maturity → Exhaustion.
Micro
Resistance: 640–642
Support: 630 → 628 zone.
Behaviour: Controlled pullbacks, failed rescues, collapse candles on intraday.
5️⃣ Projection
Primary Path (65%): Continuation lower to $630–628 support.
Alternate Path (25%): Bounce if $640 reclaimed, capped at $645.
Low Path (10%): Breakout above $650 only with rescue event (policy or global shock).
6️⃣ Pullback Levels
Shallow: $640–642
Medium: $635
Deep: $628 (critical Sea anchor zone).
7️⃣ Final View
Bias: Bearish short-term → Path remains toward $630 unless $645+
8️⃣ Essence (Philosophy Line)
“Macro still near the Mountain, but microframes are in Collapse. Pullbacks are rebalances, not rescues. Until gates reopen, bearish flow dominates.”
9️⃣ Disclaimer
⚠️ This analysis is shared for educational and research purposes only. It is not financial advice, trading advice, or investment recommendation. Market decisions are entirely your own responsibility.
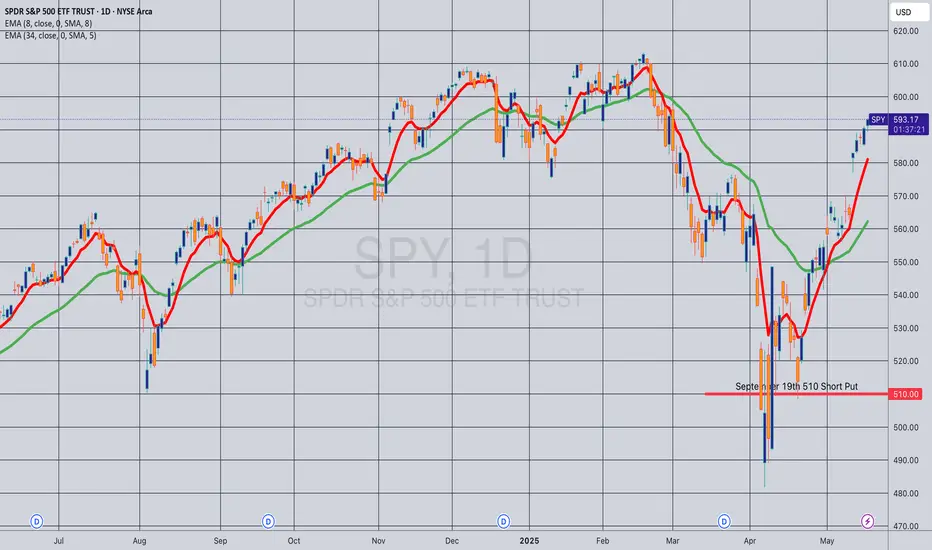
Opening (IRA): SPY September 19th 510 Short Put... for a 5.21 credit.
Comments: Laddering out, targeting the <16 delta strike paying around 1% of the strike price in credit.
Still looking to add in shorter intervals at strikes better than what I have on, but we've been in a grind-up ... .
Spy big pictureSPY: Big picture. The latest rally in SPY is a surge, but it isn’t confirmed by volume.

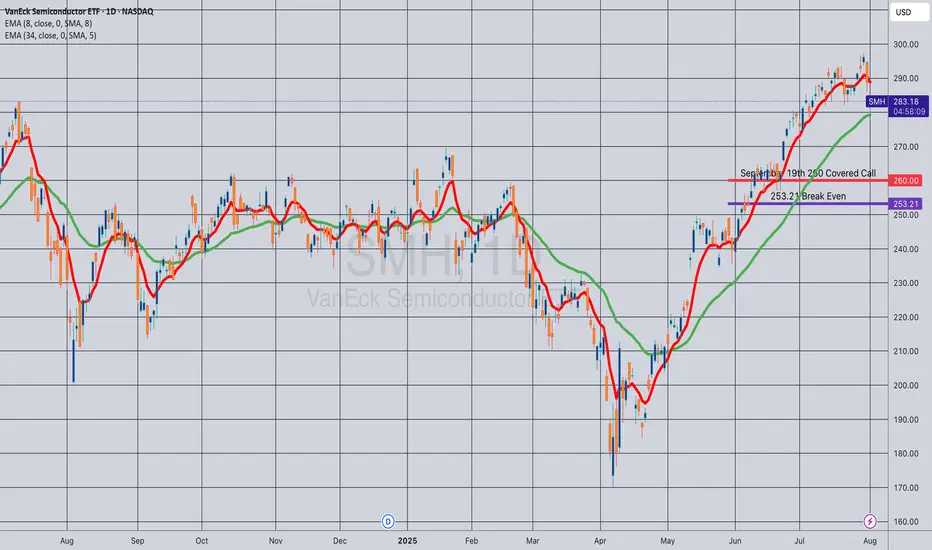
Opening (IRA): SMH September 19th 260 Covered Call... for a 253.21 debit.
Comments: One of the higher IV ETF's at the top of my board. Selling the -75 delta call against shares to emulate the delta metrics of a 25 delta short put, but with the built-in defense of the short call.
Metrics:
Break Even/Buying Power Effect: 253.21
Max Profit: 6.79 ($679)
ROC at Max: 2.68%
50% Max: 3.39 ($339)
ROC at 50% Max: 1.34%
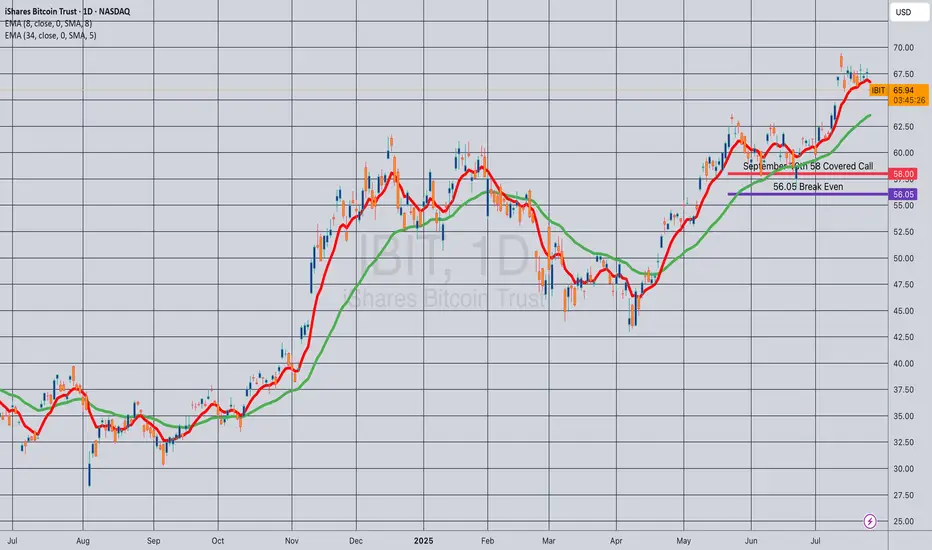
Opening (IRA): IBIT Sept 19th 58 Covered Call... for a 56.05 debit.
Comments: Selling the -75 delta call against shares to emulate the delta metrics of a +25 delta short put to take advantage of higher IV on the call side and the built-in defense of the short call.
Metrics:
Buying Power Effect/Break Even: 56.05
Max Profit: 1.95
ROC at Max: 3.48%
50% Max: .98
ROC at 50% Max: 1.74%
Will generally look to take profit at 50% max, add at intervals assuming I can get in at break evens better than what I have on.
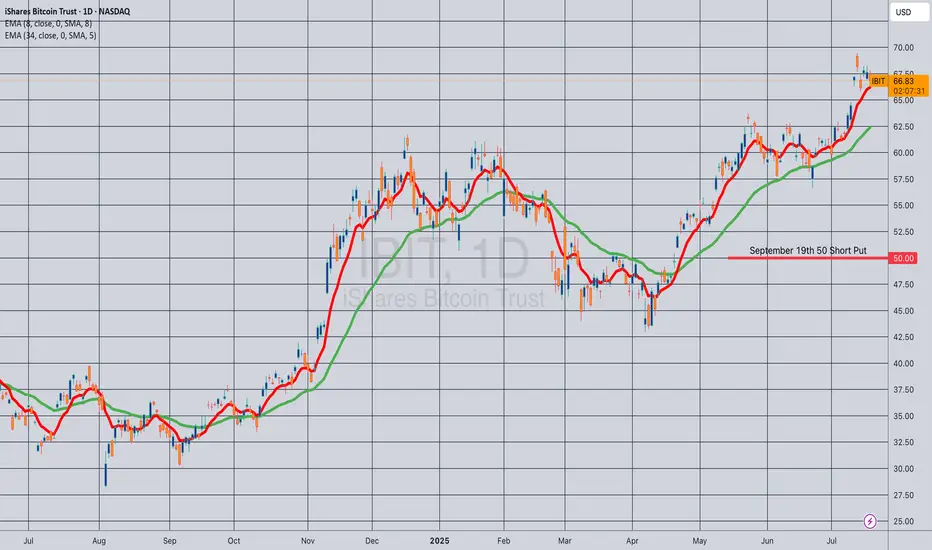
Opening (IRA): IBIT September 19th 50 Short Put... for a .52 credit.
Comments: Laddering out/adding at strikes better than what I currently have on, targeting the strike paying around 1% of the strike price in credit.
Will generally look to roll up at 50% max at > 45 DTE (Days 'Til Expiration).
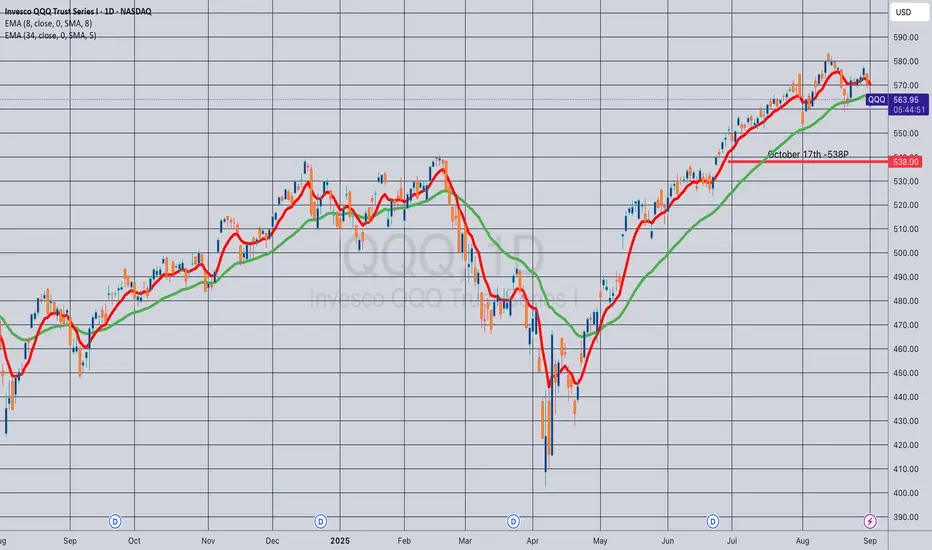
Opening (IRA): QQQ Oct 17th -538P... for a 6.85 credit.
Comments: Selling the 25 delta strike here on weakness.
Metrics:
Buying Power Effect: 531.15
Max Profit: 6.85 ($685)
ROC at Max: 1.29%
50% Max: 3.43 ($343)
ROC at 50% Max: .65%
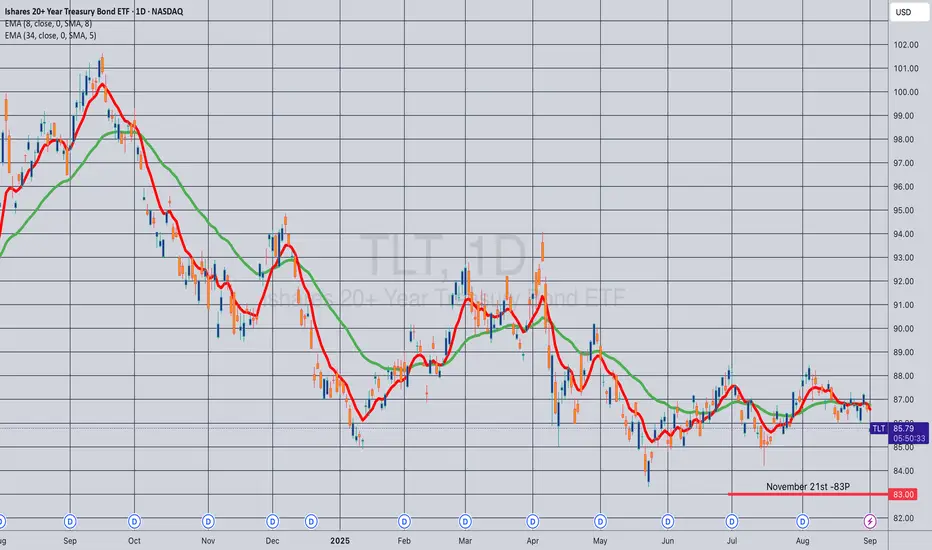
Opening (IRA): TLT November 21st -83P... for a 1.02 credit.
Comments: Looking to pick up additional shares at 83 or below. Targeting the strike and duration that pays around 1% of the strike price in credit.
Globalization & Its Impact on World TradeIntroduction
Globalization is one of the most powerful forces shaping our modern world. It refers to the increasing interconnectedness of economies, cultures, societies, and political systems across borders. Over the past few decades, globalization has accelerated, driven by technological progress, liberalization of trade policies, advances in transportation, and the digital revolution.
When we talk about world trade, globalization is at its heart. Trade is no longer limited to neighboring countries or regional exchanges. Today, goods, services, investments, information, and even people move across continents in seconds. From a smartphone assembled in China with parts sourced from South Korea, Japan, and the U.S., to online freelancing platforms connecting Indian programmers with European firms—globalization has made the world a single marketplace.
But globalization is not a one-way street. While it has created unprecedented opportunities for economic growth, innovation, and cultural exchange, it has also raised challenges like inequality, loss of local industries, environmental pressures, and geopolitical tensions. In this essay, we will explore globalization in detail, analyze its impact on world trade, examine its benefits and drawbacks, and discuss its future.
Understanding Globalization
At its core, globalization means the integration of national economies into the international economy. This integration takes place through trade in goods and services, cross-border investment, capital flows, migration, and the spread of technology.
Globalization can be studied under four major dimensions:
Economic Globalization – Expansion of international trade, multinational corporations, global supply chains, and investment flows.
Cultural Globalization – Exchange of ideas, lifestyles, media, fashion, music, and cultural practices.
Political Globalization – Formation of international institutions like the United Nations, WTO, IMF, and global treaties.
Technological Globalization – Spread of innovations such as the internet, AI, e-commerce, and faster transportation systems.
While all four matter, economic globalization—especially in terms of trade—is the most direct and visible form.
Historical Background of Globalization in Trade
Globalization is not entirely new. History shows earlier waves of globalization that transformed trade:
The Silk Road (200 BC – 1400s): Ancient trade routes connected China, India, the Middle East, and Europe, allowing silk, spices, and precious metals to move across continents.
The Age of Exploration (15th – 18th Century): European powers like Spain, Portugal, Britain, and the Netherlands expanded global trade through colonization and sea routes, integrating Asia, Africa, and the Americas into global commerce.
The Industrial Revolution (18th – 19th Century): Mass production, railways, and steamships expanded international markets. Colonies became suppliers of raw materials and consumers of finished goods.
Post-World War II Globalization (1945 onwards): Creation of institutions like the IMF, World Bank, and GATT (later WTO) encouraged trade liberalization. Multinational corporations and free-trade agreements accelerated integration.
21st Century Digital Globalization: E-commerce, fintech, blockchain, and digital platforms (like Amazon, Alibaba, and Zoom) allow even small businesses and individuals to participate in global trade.
Drivers of Globalization in Trade
Several factors have fueled globalization and its direct impact on trade:
Technological Advancements:
Container shipping reduced logistics costs.
Internet and digital payment systems enabled e-commerce.
Artificial Intelligence (AI) and automation optimize supply chains.
Trade Liberalization:
Reduction of tariffs and quotas through agreements like WTO and regional FTAs (NAFTA, EU, RCEP).
Countries opening their economies for foreign investments.
Rise of Multinational Corporations (MNCs):
Companies like Apple, Toyota, Nestlé, and Samsung operate globally, sourcing materials and selling products worldwide.
Global Supply Chains:
Products are no longer made in one country but are assembled from components sourced across borders.
Financial Integration:
Cross-border investments and global stock markets attract capital flows worldwide.
Labor Migration:
Workers moving to different countries bring remittances and contribute to global services trade.
Positive Impacts of Globalization on World Trade
Globalization has transformed world trade in many positive ways:
1. Increased Volume of Trade
International trade has grown exponentially. According to WTO data, world merchandise trade was around $62 billion in 1950, but by 2022 it exceeded $25 trillion.
2. Access to Larger Markets
Businesses can sell goods and services worldwide, reaching millions of consumers instead of being limited to local demand.
3. Specialization & Comparative Advantage
Countries focus on producing what they are best at (comparative advantage). For example:
India excels in IT and services.
China in manufacturing.
Middle East in oil exports.
This leads to efficiency and cheaper prices for consumers.
4. Job Creation
Global trade has generated millions of jobs worldwide, from factory workers in Asia to software developers in Eastern Europe.
5. Cheaper Consumer Goods
Global competition and supply chains lower production costs, making products like smartphones, clothes, and electronics affordable.
6. Technology Transfer
Developing nations benefit from foreign direct investment (FDI) and the transfer of advanced technology from developed countries.
7. Cultural Exchange
Along with goods, globalization spreads culture, tourism, and international collaboration.
Negative Impacts of Globalization on World Trade
While globalization has benefits, it also has serious downsides:
1. Unequal Benefits
Developed countries often gain more than developing nations.
Rich corporations dominate markets, while small local industries struggle.
2. Loss of Domestic Industries
Cheap imports hurt local producers. For instance, small textile industries in some African nations declined due to mass imports from Asia.
3. Job Displacement
Outsourcing and automation reduce job opportunities in certain sectors, especially in developed countries.
4. Environmental Damage
Global shipping and industrial activity increase carbon emissions.
Deforestation and overuse of resources to meet global demand cause ecological harm.
5. Exploitation of Labor
Low-cost manufacturing in developing countries often involves poor working conditions and low wages.
6. Economic Dependence
Countries relying too much on global markets face risks during global recessions or supply chain disruptions (e.g., COVID-19 pandemic).
7. Cultural Homogenization
Local traditions, foods, and industries are often overshadowed by global brands like McDonald’s, Coca-Cola, or Netflix.
Case Studies: Globalization in Action
1. China – The World’s Factory
China’s economic rise since the 1980s is the clearest example of globalization-driven trade success. Its manufacturing power and export-led growth turned it into the world’s second-largest economy.
2. India – IT & Services Hub
India benefited from globalization through its IT outsourcing and services sector. Companies like Infosys, Wipro, and TCS provide software services to global clients.
3. European Union – Regional Globalization
The EU demonstrates how regional economic integration boosts trade. Free movement of goods, services, capital, and labor creates a single market.
4. COVID-19 Pandemic – Fragile Globalization
The pandemic disrupted supply chains, revealing over-dependence on certain regions. For example, shortages of medical equipment and semiconductors exposed vulnerabilities in global trade.
The Role of International Institutions
Global trade under globalization is supported by several institutions:
World Trade Organization (WTO): Regulates trade rules and resolves disputes.
International Monetary Fund (IMF): Provides financial stability and emergency funding.
World Bank: Funds development projects.
Regional Trade Agreements: NAFTA/USMCA, European Union, ASEAN, RCEP encourage trade cooperation.
Future of Globalization & World Trade
Globalization is evolving, not ending. Key future trends include:
Digital Globalization: E-commerce, fintech, AI, blockchain, and digital currencies will dominate trade.
Green Trade: Shift towards renewable energy, electric vehicles, and carbon-neutral policies.
Regionalization: Countries are diversifying supply chains, moving towards regional hubs (e.g., “China+1” strategy).
Geopolitical Tensions: U.S.-China rivalry, Russia-Ukraine war, and sanctions may reshape trade flows.
Inclusive Globalization: Focus on reducing inequality and ensuring fair trade practices.
Conclusion
Globalization has profoundly impacted world trade, reshaping how nations, businesses, and individuals interact economically. It has created opportunities for unprecedented growth, innovation, and cultural exchange, but it also poses challenges of inequality, environmental damage, and vulnerability to crises.
The key lies in balancing globalization’s benefits with responsible policies. Sustainable globalization should focus on inclusive growth, fair trade, environmental protection, and technological innovation.
In essence, globalization has made the world more connected than ever before, and while its impact on trade is both positive and negative, it will continue to shape the future of economies and societies in profound ways.
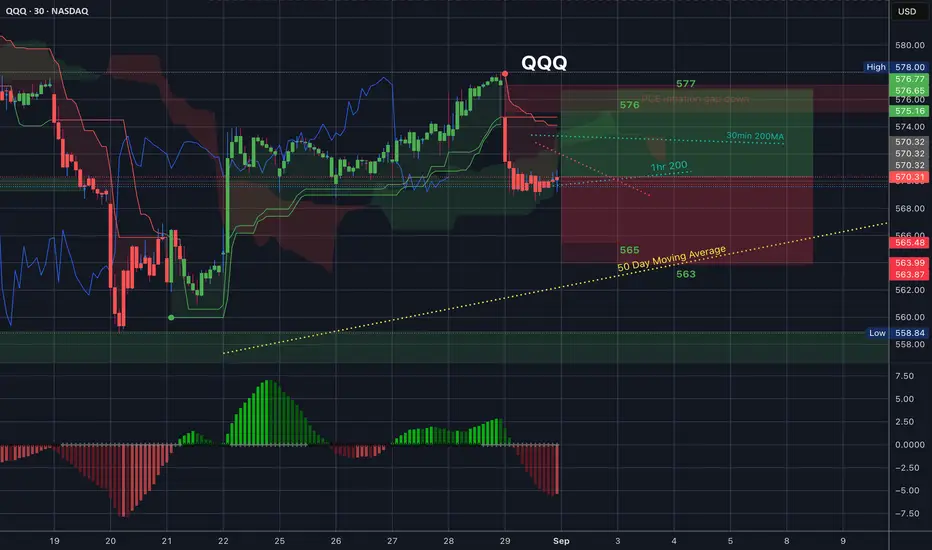
$QQQ Trading Range for 9.2.25
Ok, so we are heading into tomorrow after the three day weekend a little bearish. Friday every candle printed red and the 35EMA is above us facing down so definitely look to that as resistance.
The 30min 200MA is also facing down and above that we have even more resistance.
I am not in a hurry to go long here until we print a green candle OR hit the bottom of the implied move at 565, which ever comes first
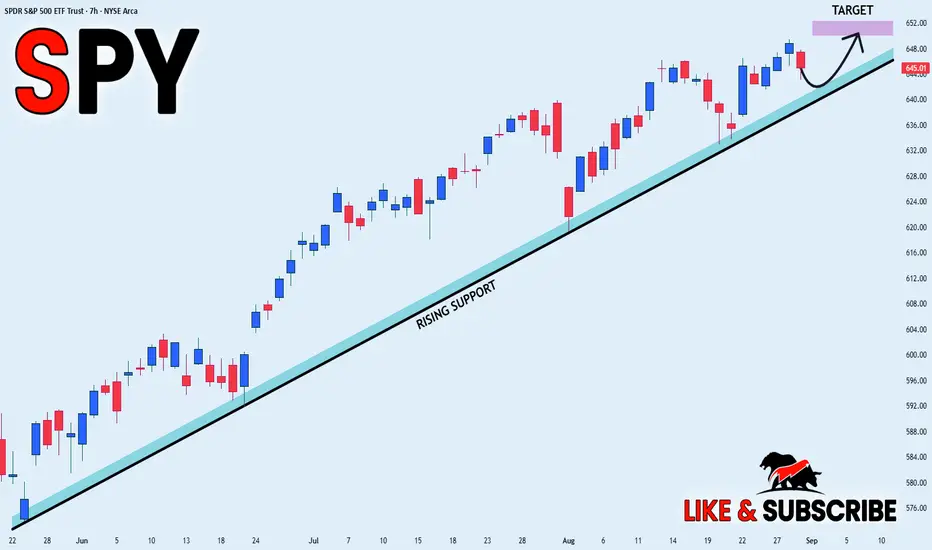
SPY LONG FROM RISING SUPPORT|
✅SPY is trading in an uptrend
Along the rising support line
Which makes me bullish biased
And the index is about to retest the rising support
Thus, a rebound and a move up is expected
With the target of retesting the level above at 650$
LONG🚀
✅Like and subscribe to never miss a new idea!✅
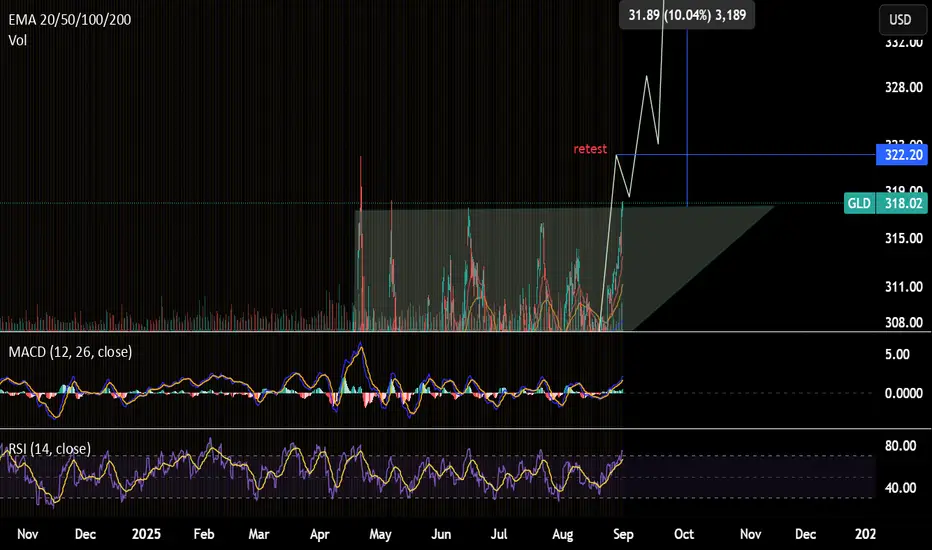
GLD - CALL4hr chart pattern: ascending triangle
Resistance: 321.99 -> need to break & close above 322.2 to confirm bullish breakout. A retest to the equal high at $317 ish might happen after reaching this resistance. Still a good call play from 318 to 321.9
Ultimate price target : $349.2
Stoploss: $304.9
*** Stoploss (for option): Just in case if it is still consolidating in the triangle, stop loss at $313, monitor price movement and re-entry when it reacts at $305.2
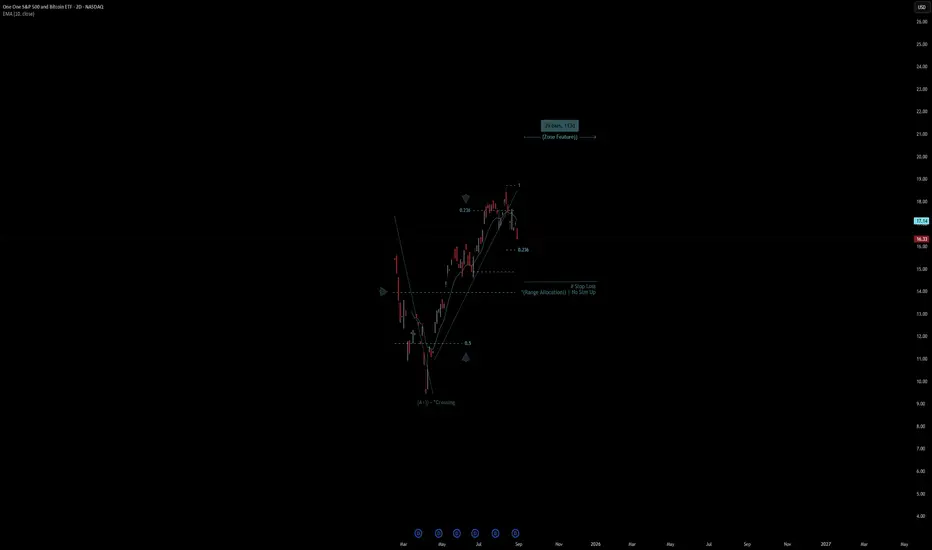
One One S&P 500 and Bitcoin ETF | Chart & Forecast SummaryKey Indicators On Trade Set Up In General
1. Push Set Up
2. Range Set Up
3. Break & Retest Set Up
Notes On Session
# One One S&P 500 and Bitcoin ETF
- Double Formation
* (A+)) - *Crossing - *10EMA - Long Entry | Subdivision 1
* (Range Allocation)) | No Size Up - *1.5RR | Completed Survey
* 39 bars, 113d | Date Range Method - *Uptrend Argument))
- Triple Formation
* (P1)) / (P2)) & (P3)) | Subdivision 2
* 2 Daily Time Frame | Trend Settings Condition | Subdivision 3
- (Hypothesis On Entry Bias)) | Regular Settings
* Stop Loss Feature Varies Regarding To Main Entry And Can Occur Unevenly
- Position On A 1.5RR
* Stop Loss At 13.00 USD
* Entry At 15.00 USD
* Take Profit At 18.00 USD
* (Uptrend Argument)) & No Pattern Confirmation
- Continuation Pattern | Not Valid
- Reversal Pattern | Not Valid
* Ongoing Entry & (Neutral Area))
Active Sessions On Relevant Range & Elemented Probabilities;
European-Session(Upwards) - East Coast-Session(Downwards) - Asian-Session(Ranging)
Conclusion | Trade Plan Execution & Risk Management On Demand;
Overall Consensus | Buy
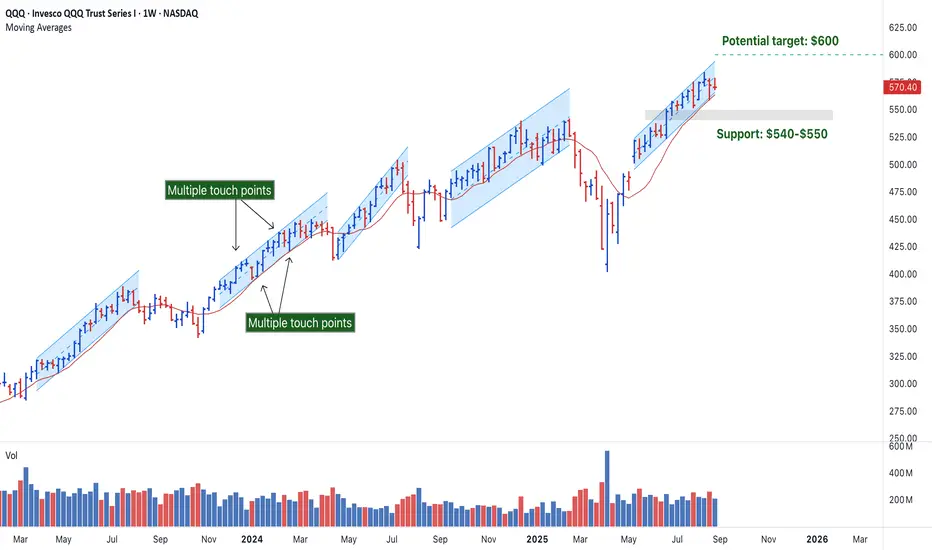
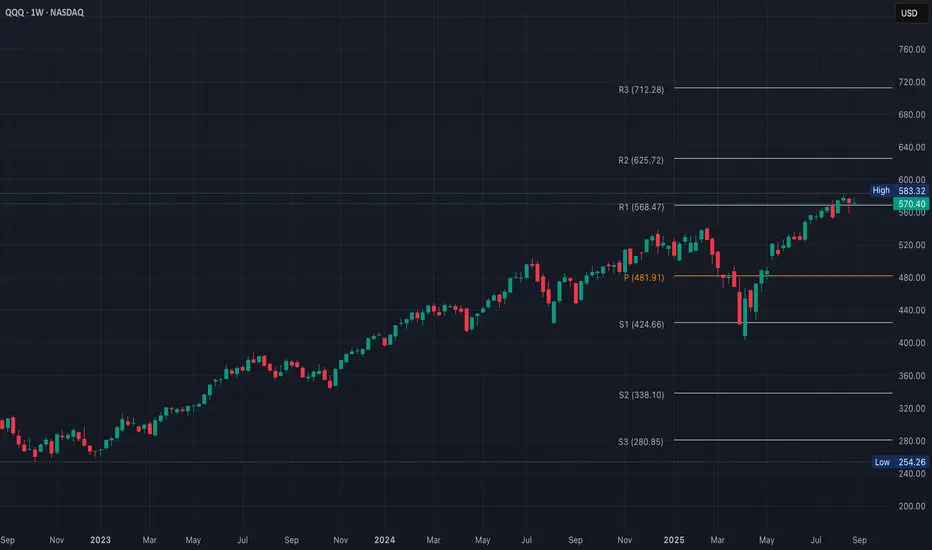
QQQ – Another Channel in Play: Breakout or Breakdown?QQQ has been respecting a series of parallel channels since March of 2023, forming a classic stair-step bullish pattern. Each channel ended with a break below the 10-week SMA.
🔸 Strong Trend Structure
▪ The chart shows five clear ascending parallel channels, each followed by a corrective/downward or sideways phase.
▪ This stair-step structure is characteristic of bullish price action, followed by consolidations, which often signals a healthy uptrend.
🔸 Channel Integrity
▪ Each channel respects its upper and lower bounds well, showing consistent buying pressure and trend continuation.
▪ There are multiple touch points for each upper and lower band, showing price support and resistance levels.
▪ The last channel is slightly narrower than the previous ones, which could imply momentum compression before either:
• A breakout (continuation upward).
• A breakdown (channel failure and pullback).
🔸 Risk Zone
▪ If QQQ breaks below the channel support and the 10-week moving average, the next likely support zone is around $540–$550.
🔸 Key Levels
▪ Upside Target: If QQQ breaks above the channel, we could see $600+ based on the measured move of prior legs.
▪ Watch volume for confirmation on any breakout attempt.
▪ Support Zone: If the channel fails, $540–$550 is the first major demand area aligned with prior consolidation.
🔸 Trade Ideas
▪ Bullish Bias: Breakout with strong volume, stop below channel support.
▪ Bearish Bias: Breakdown on confirmed move below channel and moving average.
Note: This is not investment advice. Do your own research before making any trade decisions. Always conduct your own due diligence before investing.
💡 What do you think – continuation or correction? Drop your thoughts in the comments!
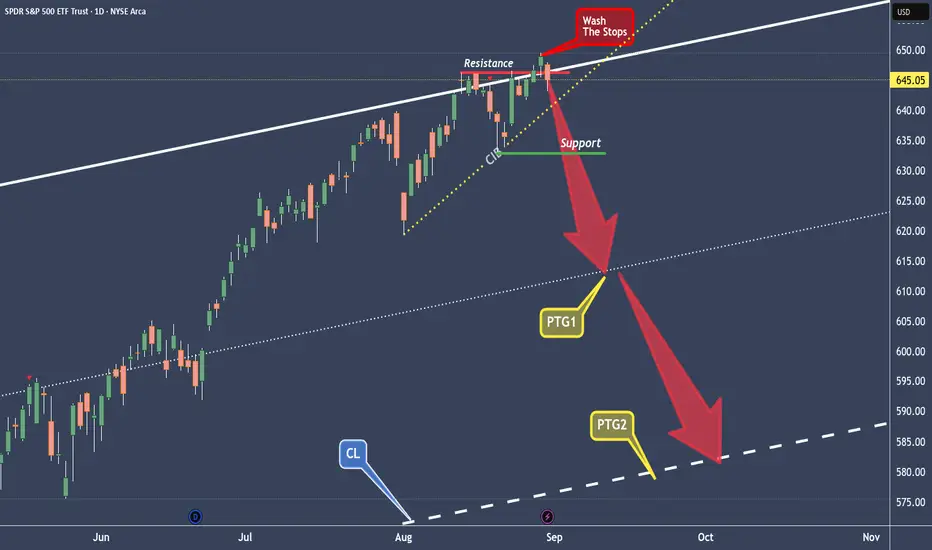
SPY washed away the Stops, and now rinse supportAt the U-MLH the air is very, very thin now.
SPY is experience this and it looks like this market shows it's hand.
It's the second time where the breakout failed.
A classical Double-Top.
Today SPY will open back into the Fork, which is a very bad sign for climbing markets. And if SPY can't close outside the Fork today, it would be a clear short to me.
So, after the Wash of the Stops at the Top, what follows is the "Rinse" of the support level and then way down to the PTG1, the 1/4 line, and further to the PTG2 at the Center-Line.
Derivatives & Hedging Strategies1. Introduction
Financial markets are dynamic and uncertain. Prices of stocks, commodities, currencies, and interest rates fluctuate every second, influenced by factors such as economic policies, geopolitical tensions, supply-demand imbalances, and investor sentiment. For businesses, investors, and financial institutions, these uncertainties pose risks to profits, cash flows, and overall stability.
To deal with this uncertainty, financial tools known as derivatives have been developed. Derivatives are contracts whose value is derived from an underlying asset such as equity, bond, commodity, or currency. They allow participants to hedge against risks, speculate on price movements, and enhance portfolio efficiency.
One of the most important uses of derivatives is hedging, which helps protect businesses and investors from unfavorable price movements. Hedging strategies are used by airlines to stabilize fuel costs, exporters to protect against currency risks, and farmers to lock in crop prices before harvest.
This write-up explores derivatives in detail and explains how hedging strategies work in practice.
2. Understanding Derivatives
2.1 Definition
A derivative is a financial contract whose value depends on the performance of an underlying asset, index, or rate. The underlying can be:
Equities (e.g., Reliance shares, S&P 500 Index)
Commodities (e.g., gold, crude oil, wheat)
Currencies (e.g., USD/INR, EUR/USD)
Interest rates (e.g., LIBOR, SOFR)
Bonds or other securities
The derivative itself has no independent value; it exists as a contract between two or more parties.
2.2 Key Features
Underlying asset linkage – Derivatives derive value from an underlying asset.
Leverage – Small margin deposits control large exposures.
Standardization – Exchange-traded derivatives (like futures and options) are standardized contracts.
Flexibility – Over-the-counter (OTC) derivatives like swaps are customizable.
Risk transfer – They allow hedging, speculation, or arbitrage.
3. Types of Derivatives
3.1 Forwards
A forward contract is an agreement between two parties to buy or sell an asset at a future date at a predetermined price.
These are customized, OTC contracts, not traded on exchanges.
Example: A wheat farmer enters a forward contract with a miller to sell 100 tons of wheat at ₹25,000 per ton after 3 months.
Uses: Primarily for hedging commodity, currency, or interest rate risks.
Risks: Counterparty default (credit risk), illiquidity.
3.2 Futures
A futures contract is similar to a forward but standardized and traded on exchanges.
Futures require margin deposits and are marked-to-market daily.
Example: An investor buys Nifty Futures at 20,000. If the index rises to 20,500, the investor earns profit.
Uses: Hedging and speculation in commodities, equities, currencies, and interest rates.
Risks: High leverage can magnify losses.
3.3 Options
An option gives the buyer the right (but not the obligation) to buy or sell an asset at a specified price (strike price) before or on a specified date.
Types:
Call Option – Right to buy.
Put Option – Right to sell.
Example: An investor buys a call option on Reliance at ₹2,500 with a premium of ₹50. If Reliance rises to ₹2,700, profit = (2,700 – 2,500 – 50) = ₹150 per share.
Uses: Hedging against unfavorable moves, insurance-like protection, or speculation.
Risks: Buyers lose only the premium; sellers face unlimited losses.
3.4 Swaps
A swap is an agreement between two parties to exchange cash flows based on different financial instruments.
Common types:
Interest Rate Swaps – Exchange fixed interest for floating interest payments.
Currency Swaps – Exchange payments in different currencies.
Commodity Swaps – Exchange commodity-linked cash flows.
Example: A company with floating-rate debt swaps its payments with another company paying fixed rates to reduce exposure to interest rate volatility.
Uses: Managing long-term risks in interest rates and currencies.
4. The Role of Derivatives in Financial Markets
Risk Management – Companies use derivatives to protect against unfavorable price, currency, or interest rate movements.
Price Discovery – Futures and options markets help discover fair prices of commodities and securities.
Liquidity & Market Efficiency – They attract participants, increasing depth and stability.
Speculation – Traders use derivatives to take positions and profit from price movements.
Arbitrage – Exploiting price differences between markets.
5. Introduction to Hedging
5.1 What is Hedging?
Hedging is a risk management strategy that involves taking an offsetting position in a related security or derivative to protect against potential losses.
It’s like buying insurance – you pay a small cost (premium or margin) to reduce the risk of larger losses.
5.2 Why Hedge?
To protect cash flows and profits.
To manage exposure to currency, commodity, equity, or interest rate risks.
To reduce volatility in business operations.
6. Hedging Strategies Using Derivatives
6.1 Hedging with Futures
Example: An airline expects to consume 1 million gallons of jet fuel in 6 months. To hedge rising oil prices, it buys crude oil futures. If oil prices rise, futures profit offsets higher fuel costs.
Strategy Types:
Short Hedge – Selling futures to protect against falling prices of an asset you hold.
Long Hedge – Buying futures to protect against rising prices of an asset you plan to buy.
6.2 Hedging with Options
Options provide more flexibility compared to futures.
Common Strategies:
Protective Put – Buying a put option to protect against a fall in asset prices.
Example: An investor holding Infosys stock at ₹1,500 buys a put option at ₹1,450. Even if prices crash, losses are limited.
Covered Call – Selling a call option on an asset you own to earn premium income.
Collar Strategy – Buying a protective put and simultaneously selling a call option to reduce the cost of hedging.
6.3 Hedging with Swaps
Interest Rate Hedging: A company with floating-rate debt enters into a swap to pay fixed and receive floating, reducing uncertainty.
Currency Hedging: An exporter receiving USD revenue swaps USD cash flows for INR to avoid exchange rate risk.
6.4 Hedging in Commodities
Farmers, mining companies, and manufacturers use futures and options to hedge commodity risks.
Farmer sells futures to lock in crop prices.
Gold jewelry makers buy gold futures to hedge against rising raw material costs.
6.5 Currency Hedging
Exporters/importers use forwards, options, and swaps to manage forex risks.
Example: An Indian company importing from the US hedges by buying USD-INR forwards to avoid rupee depreciation risk.
6.6 Equity Hedging
Investors hedge stock portfolios using index futures or protective puts.
Example: If an investor fears a market downturn, they short Nifty futures or buy put options to protect portfolio value.
7. Risks and Limitations of Hedging
Cost of Hedging – Options premiums and transaction fees reduce profits.
Imperfect Hedge – Correlation between hedge instrument and underlying may not be perfect.
Liquidity Risk – Some derivatives may be illiquid, especially in emerging markets.
Counterparty Risk – Especially in OTC derivatives like forwards and swaps.
Over-Hedging – Excessive hedging can reduce potential gains.
8. Real-World Examples of Hedging
Airlines – Southwest Airlines successfully used fuel hedging strategies to protect against rising oil prices in the 2000s.
Indian IT Companies – Infosys, TCS, and Wipro use currency hedging to protect against USD-INR fluctuations.
Agriculture – Farmers worldwide hedge wheat, corn, and soybean prices using futures contracts.
9. Regulatory Framework
In India, derivatives are regulated by SEBI (Securities and Exchange Board of India).
Globally, regulators like CFTC (Commodity Futures Trading Commission – US) and ESMA (European Securities and Markets Authority) oversee derivatives.
Regulations ensure transparency, reduce systemic risks, and protect investors.
10. The Future of Derivatives & Hedging
Algorithmic & AI-driven hedging strategies are becoming more common.
Cryptocurrency derivatives (Bitcoin futures, Ethereum options) are gaining popularity.
Green finance derivatives – carbon credit futures and renewable energy hedging.
Greater retail participation through online trading platforms.
11. Conclusion
Derivatives are powerful financial instruments that serve multiple purposes – hedging, speculation, and arbitrage. Among these, hedging is one of the most crucial applications, helping businesses and investors manage risks in an uncertain world.
Futures, options, forwards, and swaps provide structured ways to offset risks related to prices, currencies, interest rates, and commodities. While hedging comes with costs and limitations, it is indispensable for financial stability, especially for corporations with global exposures.
In modern markets, effective hedging strategies separate stable, resilient businesses from those vulnerable to unpredictable shocks. Whether it is an airline stabilizing fuel costs, an IT firm hedging currency risks, or an investor protecting stock portfolios, derivatives play a vital role in ensuring financial security.
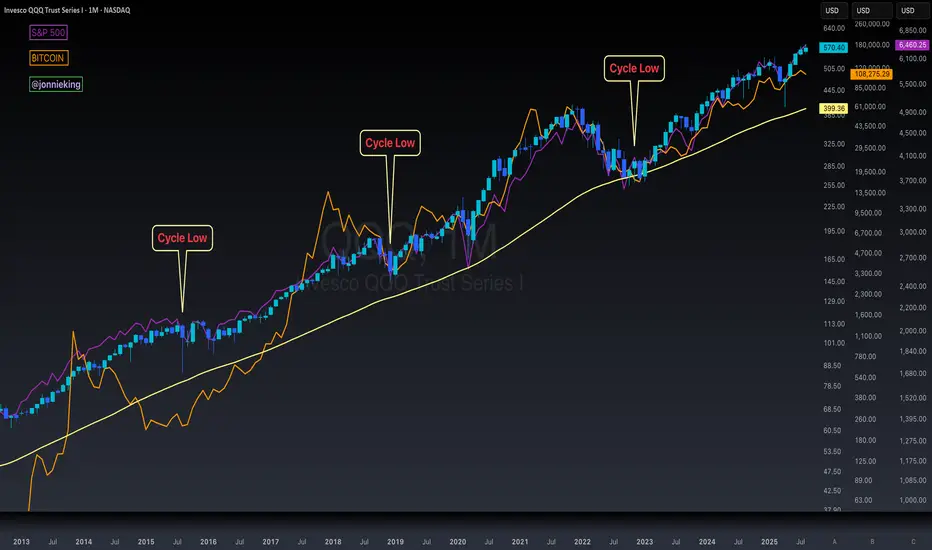
$BTC 4-Year Cycle Is NOT Dead According to $QQQ $SPXIt’s really weird cause everyone keeps telling me the ₿itcoin 4-year cycle is dead yet Nasdaq and S&P 500 follow nearly the exact same pattern with cycle lows 🤓
It’s almost as-if monetary and fiscal policy creates this boom and bust cycle every 4-years 🤔
Question for the “this time is different people”….
Will NASDAQ:QQQ and SP:SPX not have similar bear markets as we’ve seen in the past along with CRYPTOCAP:BTC ?
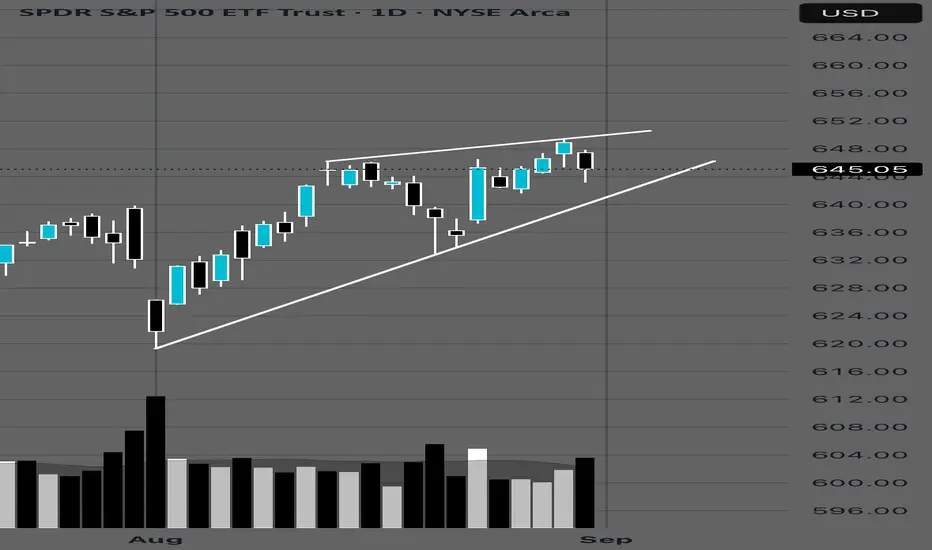
BEARS LOVE THIS!!! $SPY Break below this daily trend-line is not looking good for the bulls and everything for the bears 🐻. Price closing below would confirm the break of this daily trend. Rising wedge formed at all time highs 👀 is not a good sign.
Best of luck to everyone out there.
Not financial advice
🙂🫡
QQQ Breakout, Continuation, or CorrectionSupport levels are far below current price, but they anchor downside risk if a true bear phase begins
Clear $585 with an upside target $600–$625 (aligns with R2)
Hold between $568–$585, market consolidates until macro data (jobs, CPI, Fed)
Weekly close back below R1 ($568) opens a slide to $540 & maybe toward $482 if selling accelerates
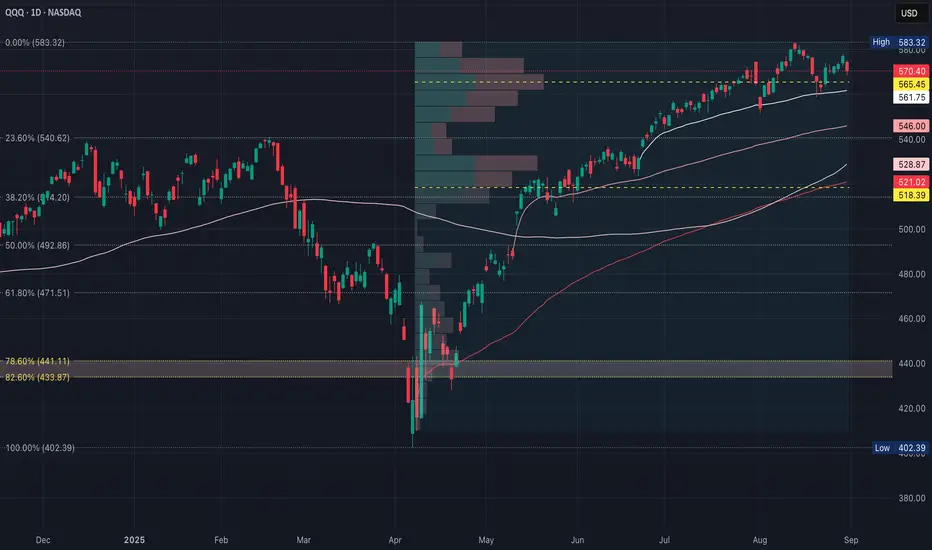
QQQ Battlefield Map1. Immediate Support Holds (~55%)
QQQ consolidates above current levels
A push above $583.32 (recent high) would confirm bullish continuation
$589–$590 or retest of envelope top/channel resistance
$600 is a round-number magnet & could trigger breakout momentum
Extension to $607–$610, based on measured move from the last swing
Biggest shelf (high-volume node) is $565–$575
This matches where QQQ has been consolidating with lots of buyers & sellers
2. Break Below $560s (~35%)
Signals loss of short-term momentum
Eyes turn toward $540 (23.6% Fib) - first real downside test
Major support in the area of $529–$540
100d SMA ($529) + Fib ($540) is a critical test
Bounces & dip-buyers defend trend
Failure & trend weakens significantly
Secondary shelf at $520–$530 perfectly lines up with Fib 38.2% ($514) & 100d SMA
Low-volume gap at $545–$555
If QQQ breaks under $565, it can slide fast into this pocket before stabilizing at $540/$530
3. Deeper Downside (~10% - unless macro shock)
$493 (50% Fib) is midpoint retrace, strong demand area (if market turns risk-off, this is the magnet )
$472 (61.8% Fib) is the golden ratio area of support
If this breaks, trend structure flips bearish with risk toward $440–$433
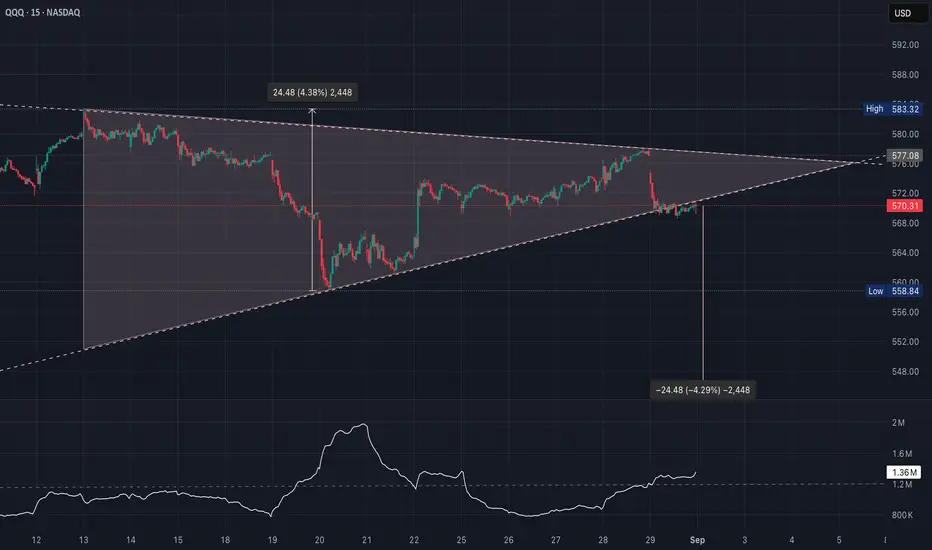
QQQ Potential Inflection PointSymmetrical triangle = compression where buyers keep stepping in higher, but sellers cap at lower levels
Often a continuation pattern, but it can break either way depending on volume + macro drivers
MACD just had a bearish cross earlier, but it’s trying to curl back up which suggests indecision & matches the triangle
RSI is holding mid-zone (~45) - not oversold, not overbought, again, neutral compression
In a proper symmetrical triangle, volume should decline as the pattern compresses
This shows traders waiting, fewer willing to commit inside the chop
That looks normal here (quieter trading into late August)
Volume must expand; otherwise it’s just a fake-out; ideally, RSI also breaks under ~40 & MACD diverges down
If price falls back inside the triangle on weak volume, it’s a false move
If price reclaims the ascending line quickly, it’s a bear trap
If the breakout candle volume is ≥150% of average, that’s confirmation
If price moves but volume stays weak, expect a possible reversal
Watch the first 15–30 min of volume after the break
If it’s a strong surge, odds favor continuation
If volume fades and price chops back inside the triangle, it’s likely a fake-out
Price broke down through the ascending support trendline around ~$572, currently testing $570
Volume expanded on the breakdown candle which adds credibility to the move
If follow-through comes with continued above-average volume, it confirms the downside break
Triangle height is ~24 points (from ~$583 high to ~$559 low), so $570 – $24 = ~$546 (aligns with prior support from mid-August)
If volume continues to stay above 1.3M baseline & Tuesday closes weak, expect sellers to aim for ~$558 first (previous swing low) & then the measured move (~$546)
Direction = which line breaks (up/down)
Strength = whether volume surges beyond normal
Bulls need a fast reclaim of $572–$573 on strong volume; otherwise, bears keep control