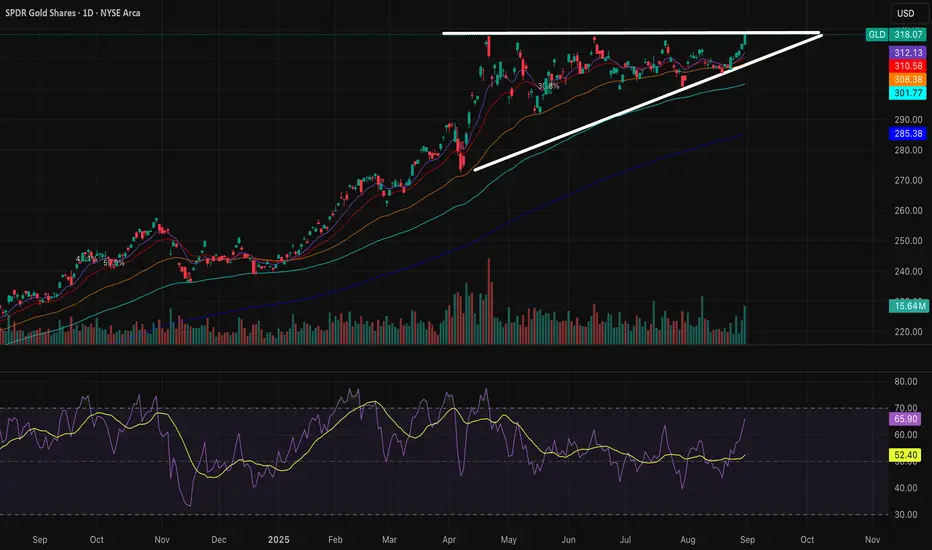
GOLD going Strong the gold STAR of year 2025I don't even know when did I entered the trade....
but look back was in the Bottom, Thanks for Mr. Trump who is volatile
this gives GOLD a good strong trending opportunity
Keep up the Good work President Trump!
MAs 1-/20/60/200 are in line with his Tariff policy.
ETF market

Is September For the Bears?QQQ CME_MINI:NQ1! CME_MINI:ES1! stock market Forecast
Nvidia Stock NASDAQ:NVDA Forecast
Apple Stock NASDAQ:AAPL Forecast
Microsoft Stock MSFT Forecast
Google Stock GOOGL Forecast
Amazon Stock AMZN Forecast
Meta Forecast Technical Analysis
Tesla Stock TSLA Forecast
Magnificent 7 stocks forecast

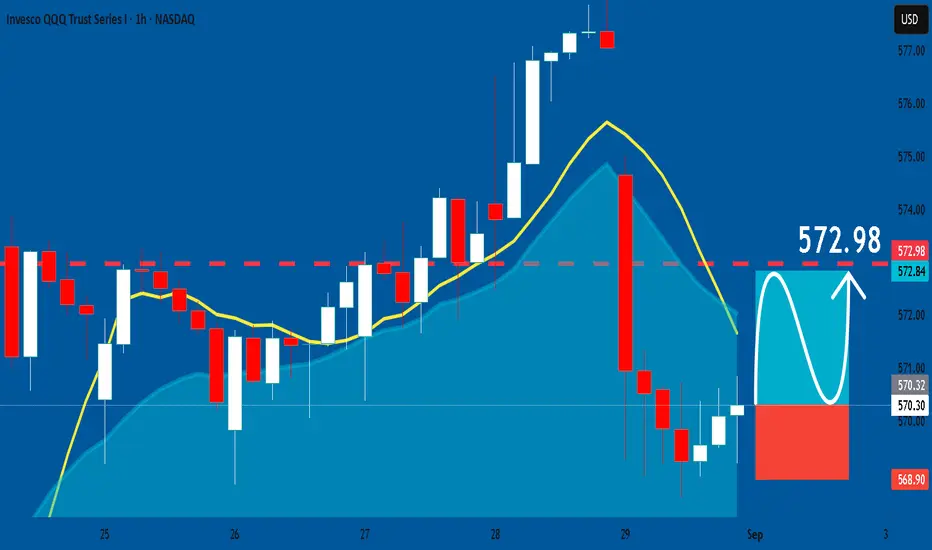
QQQ: Long Signal Explained
QQQ
- Classic bullish formation
- Our team expects pullback
SUGGESTED TRADE:
Swing Trade
Long QQQ
Entry - 570.32
Sl - 568.90
Tp - 572.98
Our Risk - 1%
Start protection of your profits from lower levels
Disclosure: I am part of Trade Nation's Influencer program and receive a monthly fee for using their TradingView charts in my analysis.
❤️ Please, support our work with like & comment! ❤️
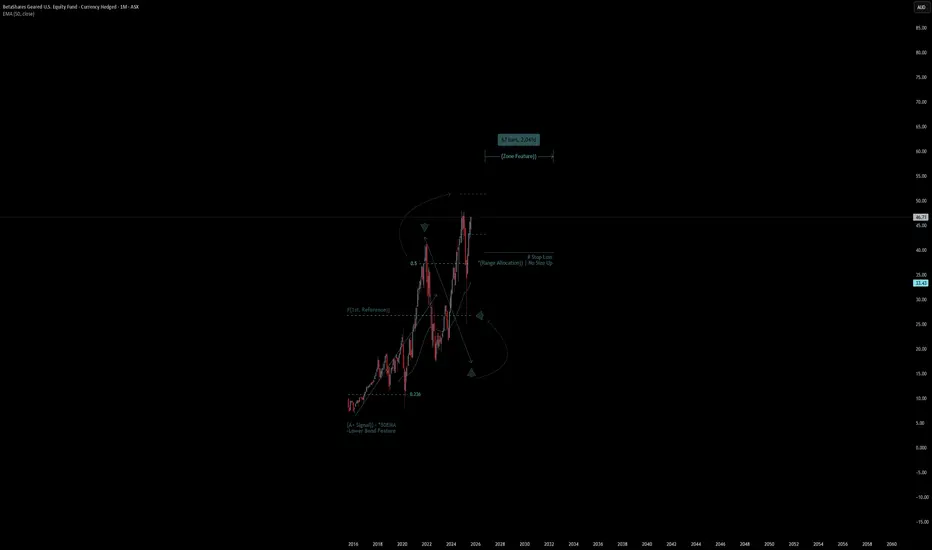
BetaShares Geared U.S. Equity Fund | Chart & Forecast SummaryKey Indicators On Trade Set Up In General
1. Push Set Up
2. Range Set Up
3. Break & Retest Set Up
Notes On Session
# BetaShares Geared U.S. Equity Fund
- Double Formation
* (A+ SIgnal)) - *50EMA - Long Entry - *50EMA | Subdivision 1
* (Range Allocation)) | No Size Up - *1.5RR | Completed Survey
* 67 bars, 2041d | Date Range Method - *Uptrend Argument))
- Triple Formation
* (P1)) / (P2)) & (P3)) | Subdivision 2
* Monthly Time Frame | Trend Settings Condition | Subdivision 3
- (Hypothesis On Entry Bias)) | Regular Settings
* Stop Loss Feature Varies Regarding To Main Entry And Can Occur Unevenly
- Position On A 1.5RR
* Stop Loss At 32.00 AUD
* Entry At 40.00 AUD
* Take Profit At 53.00 AUD
* (Uptrend Argument)) & No Pattern Confirmation
- Continuation Pattern | Not Valid
- Reversal Pattern | Not Valid
* Ongoing Entry & (Neutral Area))
Active Sessions On Relevant Range & Elemented Probabilities;
European-Session(Upwards) - East Coast-Session(Downwards) - Asian-Session(Ranging)
Conclusion | Trade Plan Execution & Risk Management On Demand;
Overall Consensus | Buy
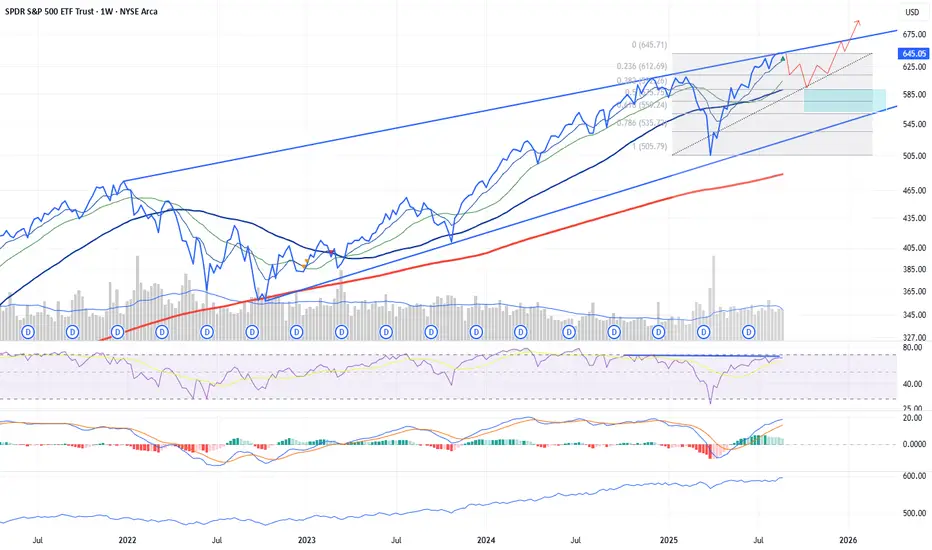
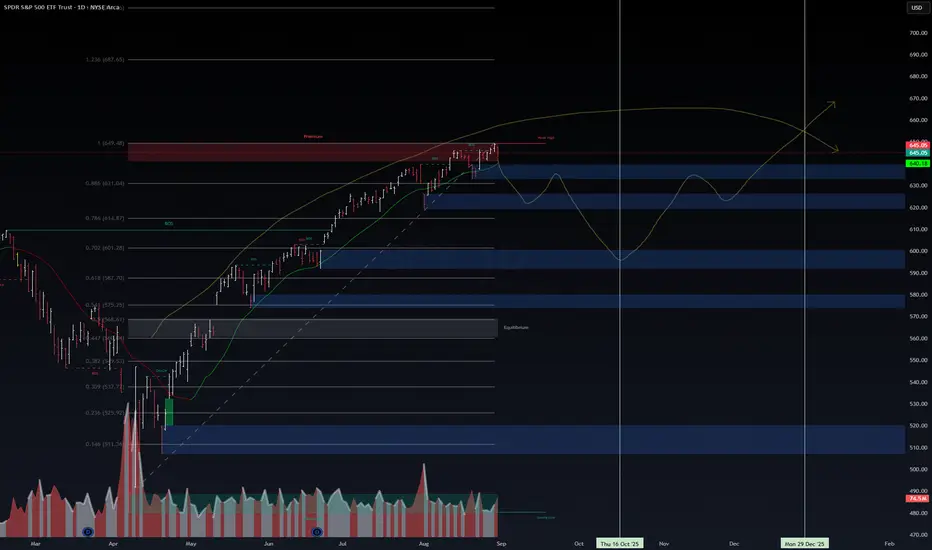
Consolidation and pullback before a new wave highSPY is at a 3-year-old upper resistance line at ATH.
RSI and MACD have negative divergences, which indicate possible weakness and a potential cooling with an expected drop of the index.
Possible cooling down to the 0.5 FIB retracement of the last wave, which would be very desirable and healthy for a further stronger rise of the stock market and the index.
Advance decline line is at ATH, which is very bullish because it shows the strength of the index and indicates that there is still room for growth.
Overall bullish, but cooling is needed, which I estimate with 80% certainty due to the above-mentioned factors
SPY: RISK MODELING...📊 SPY Macro Risk Map | Positioning for Global Capital Flows
The S&P 500 ( AMEX:SPY ) is testing premium levels near the 1.0 Fibonacci extension (649). My risk model highlights a potential liquidity sweep before deeper retracements toward the 0.786–0.702 zones (631–601). These levels represent equilibrium realignments where high-probability institutional accumulation often re-emerges.
🌍 Global Macro Alignment
US Macro: Sticky inflation, Fed policy uncertainty, and fiscal imbalances may cap upside in the near term. Liquidity stress will likely fuel tactical drawdowns.
UAE Positioning: Sovereign wealth capital (ADIA, Mubadala, ICD) is actively rotating into AI-driven infrastructure, global equity overlays, and commodity hedges. Their deep liquidity seeks asymmetric risk-adjusted returns while maintaining exposure to dollar assets.
Capital Intelligence Play: By framing SPY drawdowns as structured entry opportunities, we align with UAE’s appetite for risk-managed US exposure—bridging tactical market volatility with long-term sovereign allocation needs.
⚖️ Risk Pathway
Short-term rejection at premium zones → corrective wave toward 600–620 liquidity pockets.
Potential macro catalyst alignment around October (IMF/WB meetings, Fed forward guidance).
Re-accumulation phase into year-end, targeting 670+ if global liquidity stabilizes.
📌 Financial Intelligence Insight
This is less about chasing trend tops and more about positioning in volatility as an entry vehicle. For UAE-based allocators, the current SPY setup is a live case study in tactical liquidity provision—risk is not avoided but engineered.
💡 Key takeaway: SPY is not just a chart—it’s a capital flow model. Anticipating global sovereign rotation allows us to build strategies that resonate with investors sitting on deep pools of capital.
GLD Ascending TriangleGLD has clear resistance in the 318 area but has been trading tighter and tighter up towards it over the last couple months. September is generally the month for a market pullback if you look at seasonality trends, and GLD often (but not always ofc) inverses the rest of the market, and after today's strong close, I think its worth watching as the market may pullback even more in September. Additionally I saw about 28 million in 320 9/19 calls for GLD, so the flow is leaning bullish. NFA
QQQ Read on the CandlesToday’s long red candle shows strong rejection, high conviction selling
Today’s 4H bounce at the center band looks more like technical support hold, not yet bullish reversal
So short-term the market is testing balance at $570
If it loses $570, downside continuation is favored
If it recaptures $576 quickly, squeeze potential kicks in
Trigger to watch is a daily close under $568, or weakness that can’t reclaim $570
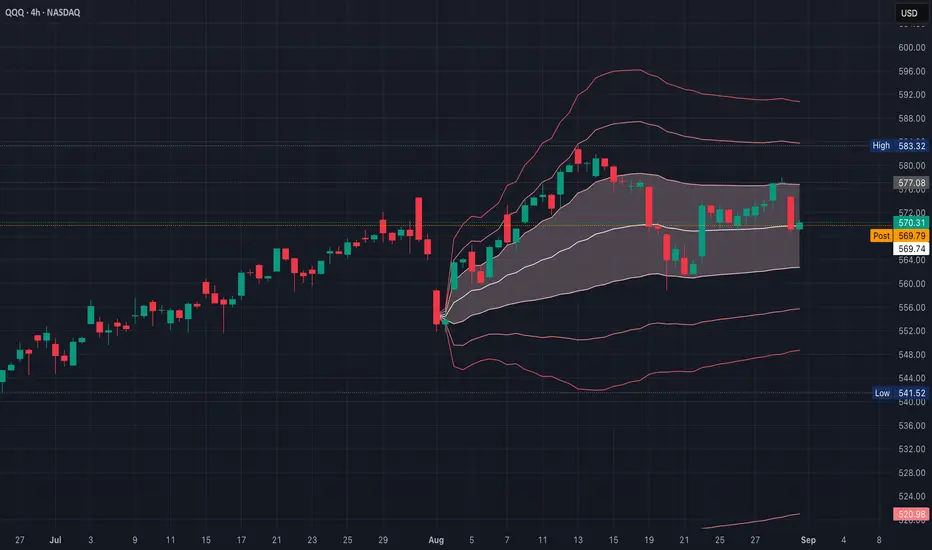
QQQ (29 August)A strong red bar, almost full body, closing near its low - that’s a bearish marubozu-type candle (pattern signals a powerful downward price movement & suggests the continuation of a downtrend or a strong potential reversal from an uptrend), which means sellers in control
Prior small-bodied candles with upper wicks around $576–$578 look like stalling candles/spinning tops or indecision near resistance
Earlier in the bounce (21-27 August), a string of green candles climbing steadily - that’s a rising three method-style move (short-term bullish continuation/essentially a "bull flag" formation), but it has now broken with that big red bar
This looks like a bearish engulfing setup where the latest red candle completely wipes out several of the prior green candles’ progress, so it suggests buyers lost control at ~$576–$578 & momentum has shifted back to sellers
Signals 1–2 more red days unless quickly negated
The strong close near the lows suggests sellers want to press further right away (no bounce intraday)
If Tuesday continues below $570, that confirms the short-term breakdown
Near-term = bearish pressure (engulfing + strong close at lows)
Swing = risk of a retest of $564 to $558, unless buyers immediately step back in & reclaim $576
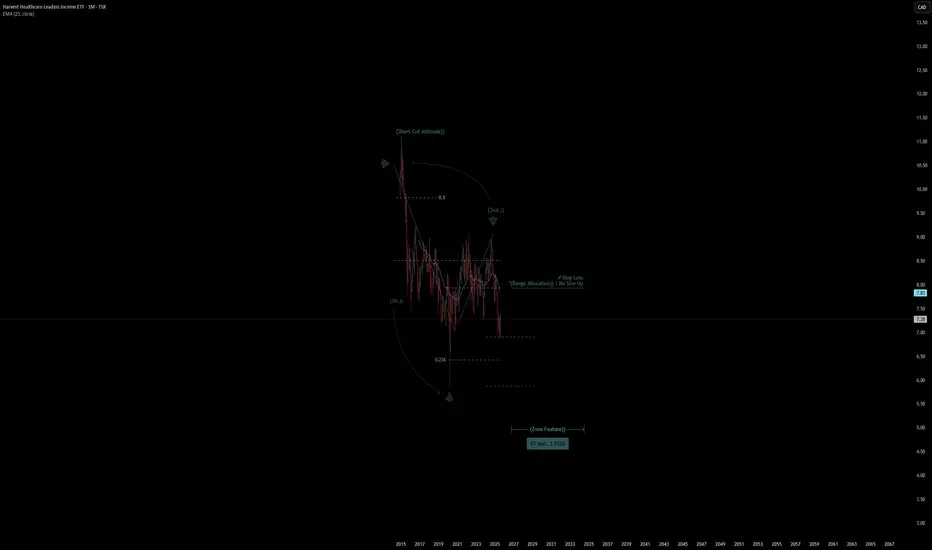
Harvest Healthcare | Chart & Forecast SummaryKey Indicators On Trade Set Up In General
1. Push Set Up
2. Range Set Up
3. Break & Retest Set Up
Notes On Session
# Harvest Healthcare
- Double Formation
* (Short Cut Attitude)) - Short Entry - *25EMA | Subdivision 1
* (Range Allocation)) | No Size Up - *1.5RR | Completed Survey
* 93 bars, 2832d | Date Range Method - *Downtrend Argument))
- Triple Formation
* (P1)) / (P2)) & (P3)) | Subdivision 2
* Monthly Time Frame | Trend Settings Condition | Subdivision 3
- (Hypothesis On Entry Bias)) | Regular Settings
* Stop Loss Feature Varies Regarding To Main Entry And Can Occur Unevenly
- Position On A 1.5RR
* Stop Loss At 8.60 CAD
* Entry At 7.70 CAD
* Take Profit At 6.30 CAD
* (Downtrend Argument)) & No Pattern Confirmation
- Continuation Pattern | Not Valid
- Reversal Pattern | Not Valid
* Ongoing Entry & (Neutral Area))
Active Sessions On Relevant Range & Elemented Probabilities;
European-Session(Upwards) - East Coast-Session(Downwards) - Asian-Session(Ranging)
Conclusion | Trade Plan Execution & Risk Management On Demand;
Overall Consensus | Sell
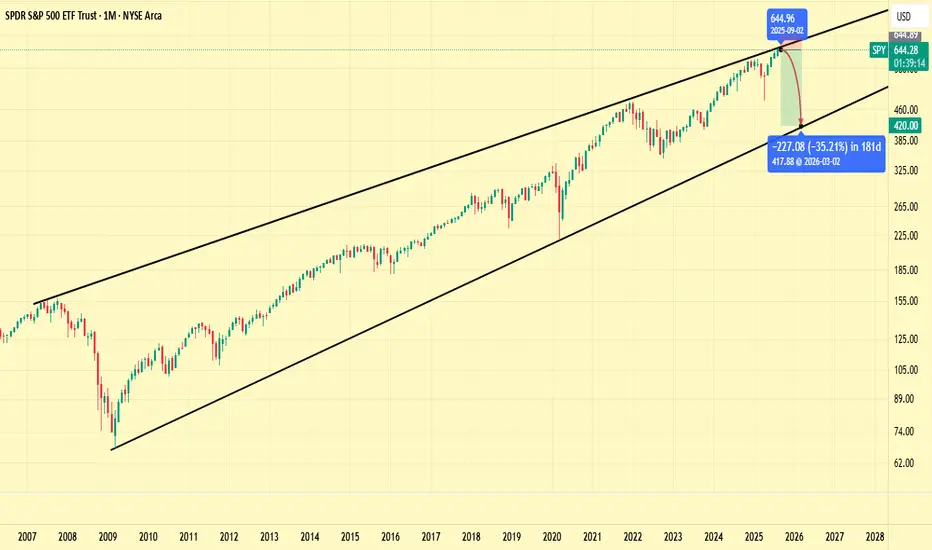
SPY Retesting An 18 Year Long CeilingPrice has remained in this channel since the 2008 Recession, and we have finally reached the upper channel once again. Ask yourself, with all things considered, is the current state of the American economy truly well enough off that we could see a strong breakout, and then witness a parabolic rally upwards? My opinion is a resounding NO.
This bullish rebound rally that this market has shown in the past 5 months since the March/April crash won't be sustainable for the long run, and the fact that it's been a melt upwards with such low volume is a telling sign.
I am expecting a 30%-40% drop within the next 6-7 months-as early as Q4 this before year's end, or no later than the end of Q1 next year.
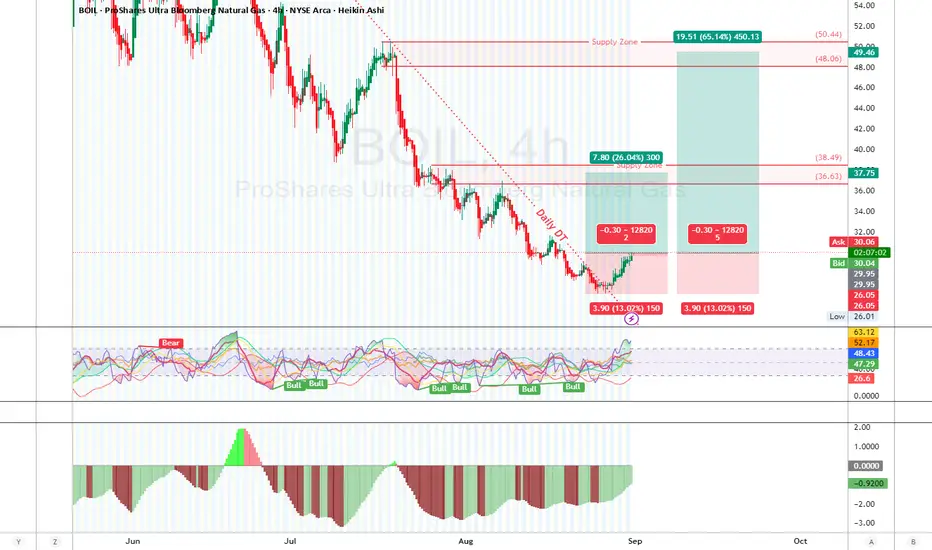
BOIL 2H Long Setup – Trend Reversal in Play
BOIL has been in a steady downtrend, capped by a clean descending trendline since mid-July. Price recently double-tapped a demand zone near the $26.00 level and printed a potential higher low. Bullish momentum is starting to creep in with volume picking up and Heikin Ashi candles showing smaller wicks to the downside—classic signs of selling exhaustion.
Supply: $36.50–$38.00 (TP zone1 near resistance )
Supply: $50.44–$48.06 (TP zone2 near resistance )
RSI Divergence
Bullish divergence spotted on RSI/Stochastic: Price made a lower low while the oscillator made a higher low.
Momentum histogram also printing green and rising — early confirmation of shift.
Trade Setup
Entry: $29.00 (Current bid/ask range)
Stop Loss: $26.20 (Below double bottom demand)
Take Profit 1 (TP1): $34.50 1:3RR
Take Profit 2 (TP2): $49.46 1:5RR
Risk Management
Max risk = 1–3% of your trading capital.
Example: $10,000 account → Risk $100–$300 max on this setup.
Trade Management
Consider moving Stop Loss to Break Even (BE) once price hits $31.80 (1:1 RR).
Scale out 50% at TP1 to secure gains, let the rest ride to TP2 with a trailing stop.
“Be fearful when others are greedy and greedy when others are fearful.”
— Warren Buffett
⚠️ Disclaimer
This analysis is for educational purposes only. Trading involves substantial risk. Always perform your own due diligence before entering any trade.
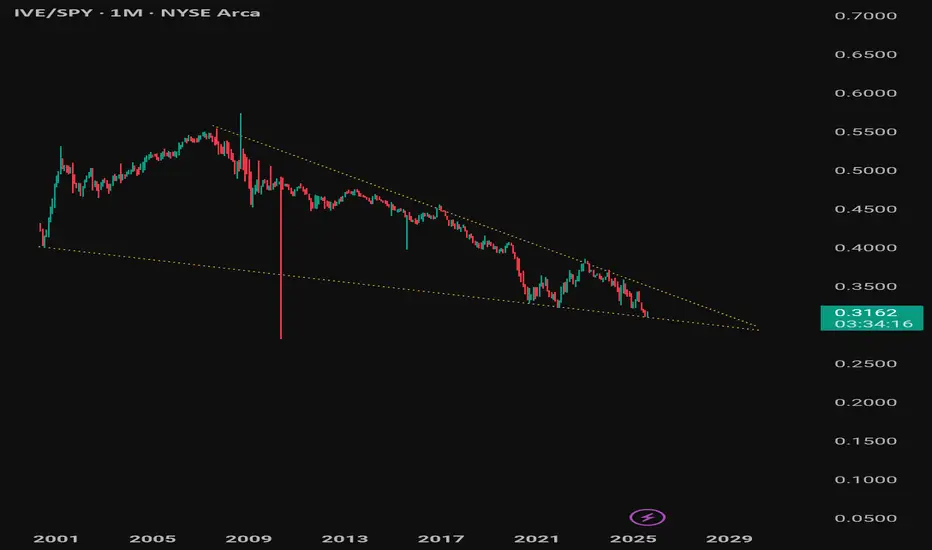
The Value vs. SPY chart shows a massive pattern you can't miss! I think all contrarians noted that something changed. The portfolio has been on the rise — the rotation started back then on April 2nd.
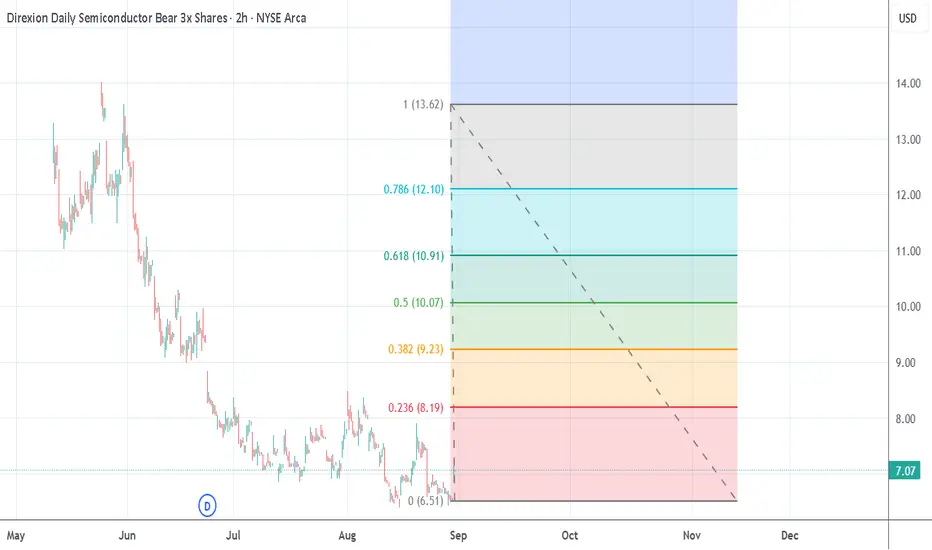
SOXS target 8.19SOXS is forming a CUP right now after a big downtrend. I expect a quick move to 8.19 from there full retrace by next year and then it goes parabolic.
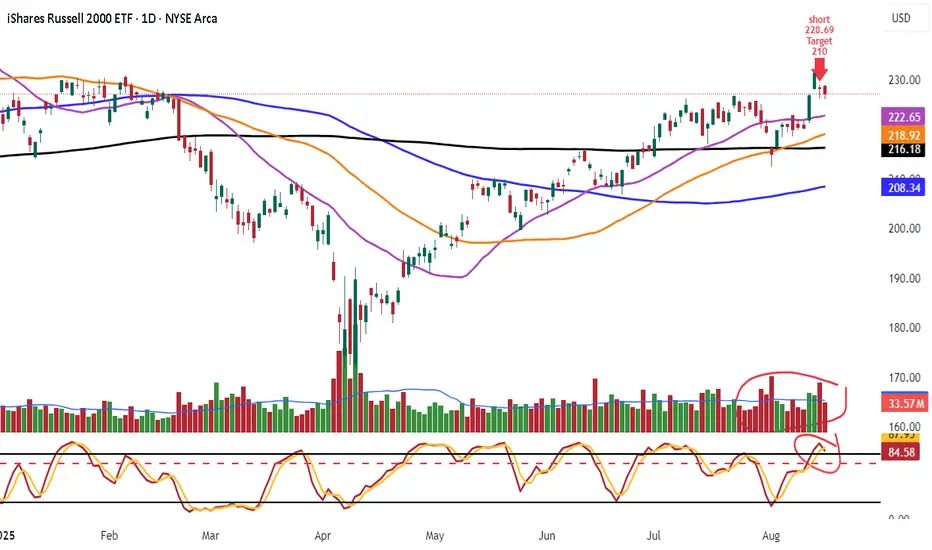
Shorted IWM 228.69 Target 210Look daily chart lower high stoch rolling over
look vol more selling buying
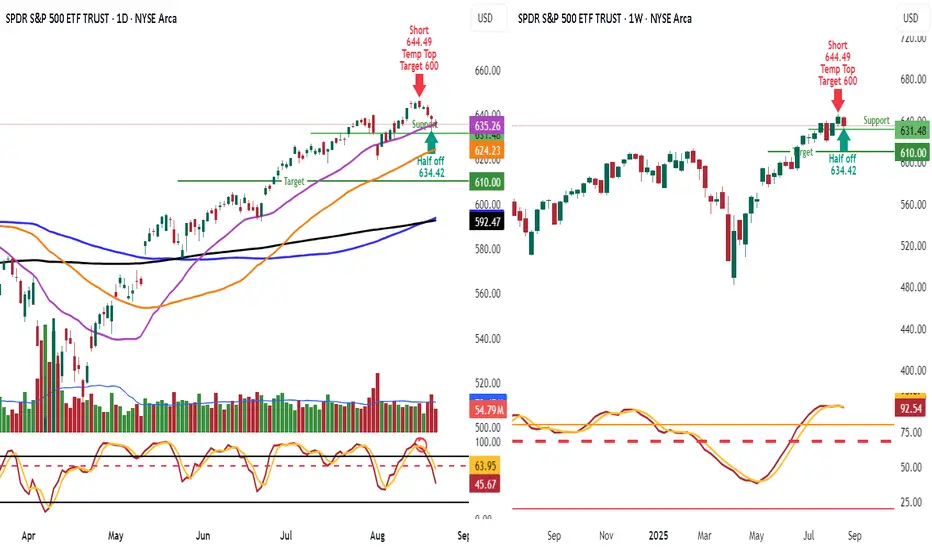
SPY why its a short in a bull marketGuys look daily chart on left
lower highs look selling vol more selling buying
look stoch heading down support 631.46
good short off daily only
Look weekly look stoch
still in uptrend very much even going 600 be healthy
if we get their also think about this can we make it to the high and break out after pull back
hmmmmmmmmmmm
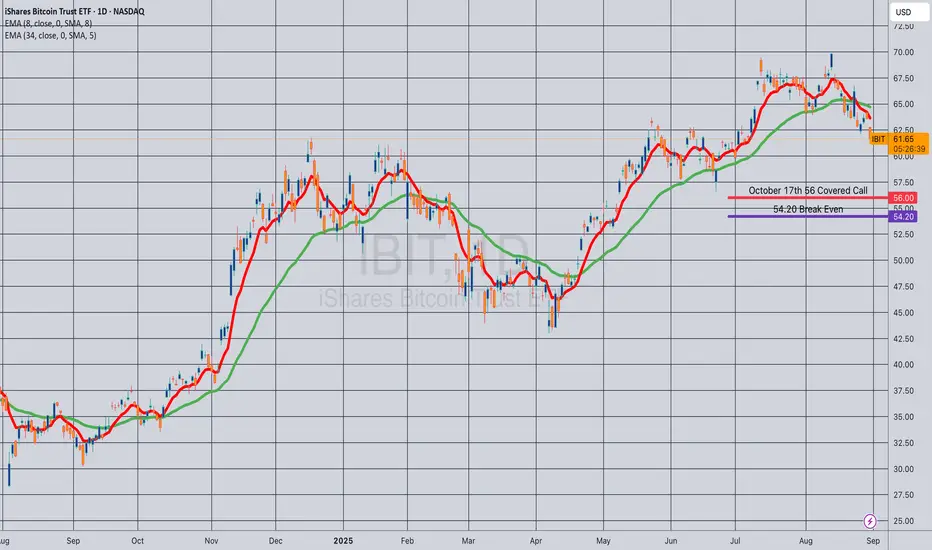
Opening (IRA): IBIT October 19th 56 Covered Call... for a 54.20 debit.
Comments: Selling the -75 call against shares to emulate the delta metrics of a +25 delta short put, but with the built-in defense of the short call and to take advantage of higher IV on the call side than on the put.
Metrics:
Buying Power Effect/Break Even: 54.20/share
Max Profit: 1.80
ROC at Max: 3.32%
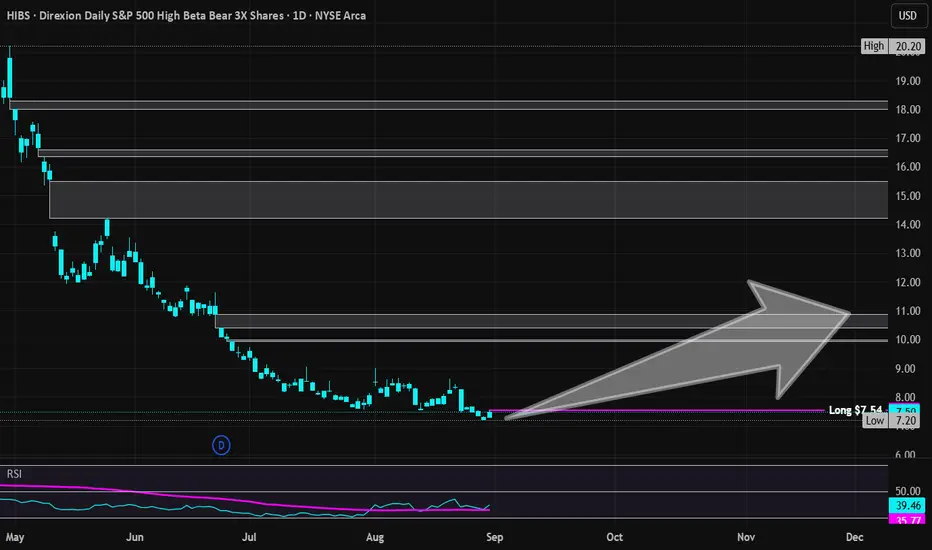
High Beta Bear | HIBS | Long at $7.54 (Primarily September)Historically, September is one of the worst performing months in the stock market. A hedge against my bets for this month is to buy shares of Direxion Daily S&P 500 High Beta Bear 3X AMEX:HIBS as a volatility play. The index provider selects 100 securities from the S&P 500 Index that have exhibited the highest sensitivity to market movements, or “beta,” over the past 12 months based on the securities’ daily price changes.
This isn't "buy and hold" play, whatsoever - you'll lose. It's a short duration hedge using seasonality odds that *may* be in my favor.
Targets:
$8.50 (+12.7%)
$9.50 (+26.0%)
$10.50 (+39.3%, if a market scare...)
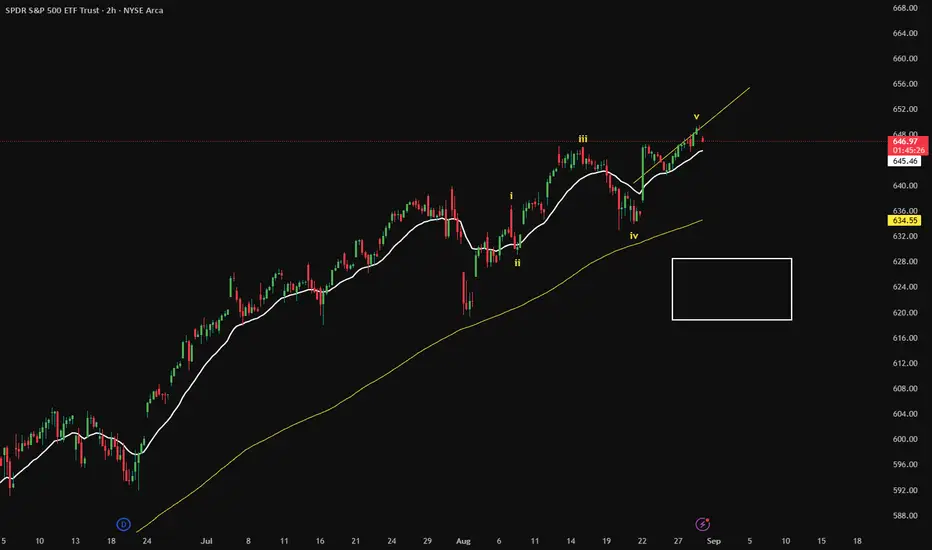
SPY Ending Diagonal in 5th wave called an ending diagonal, they occur in 5th waves and are terminating wave structures, 628 minimum target
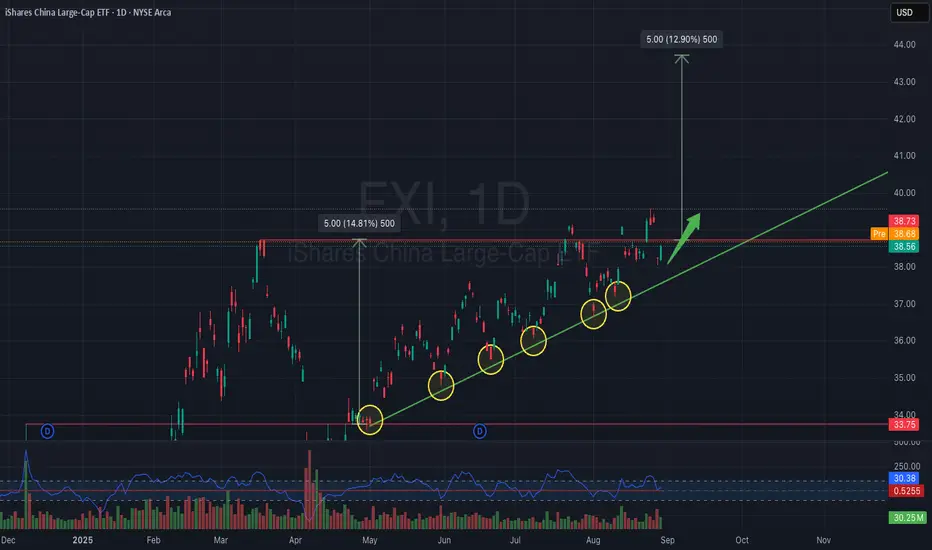
FXI – Ascending Trendline Support with Breakout PotentialThe chart of iShares China Large-Cap ETF (FXI) shows a strong ascending trendline, tested multiple times (yellow circles), confirming bullish support.
Currently, FXI is consolidating just below resistance at $39, and a breakout above this level could trigger a strong upward move. The projected target is around $43–44, which aligns with a 12–13% upside potential.
Entry Zone: Above $39 breakout
Target Price: $43–44
Stop Loss: Below $37 (trendline support)
Momentum is supported by higher lows, consistent trendline touches, and a constructive RSI setup. If the breakout holds, bulls may push FXI toward prior highs.
$MAGS: Magnificent Seven ETF – Tech Titan or Overhyped?(1/9)
Good afternoon, everyone! ☀️ CBOE:MAGS : Magnificent Seven ETF – Tech Titan or Overhyped?
With MAGS at $46.85, is this ETF a powerhouse of tech giants or just another bubble waiting to burst? Let’s decode the code! 🔍
(2/9) – PRICE PERFORMANCE 📊
• Current Price: $ 46.85 as of Mar 18, 2025 💰
• Recent Move: Likely up, reflecting tech sector strength, per data 📏
• Sector Trend: Tech stocks soaring with AI and cloud hype 🌟
It’s a tech fest—let’s see if it’s worth the buzz! ⚙️
(3/9) – MARKET POSITION 📈
• Market Cap: Approx $1.87B (assuming 40M shares) 🏆
• Operations: Tracks Apple, Microsoft, Amazon, Alphabet, Meta, Tesla, Nvidia ⏰
• Trend: Dominant players in tech, driving innovation and market trends 🎯
Firm in the heart of Silicon Valley! 🚀
(4/9) – KEY DEVELOPMENTS 🔑
• Tech Rally: Magnificent Seven companies hit new highs, per data 🌍
• Earnings Season: Strong Q4 results from underlying firms, per posts on X 📋
• Market Reaction: MAGS up, reflecting sector momentum 💡
Navigating through tech’s highs and lows! 🛢️
(5/9) – RISKS IN FOCUS ⚡
• Regulatory Scrutiny: Antitrust concerns for big tech players 🔍
• Market Volatility: Tech stocks prone to swings due to innovation and competition 📉
• Economic Factors: Interest rates and global economic conditions impact growth ❄️
It’s a risky ride—buckle up! 🛑
(6/9) – SWOT: STRENGTHS 💪
• Industry Leaders: The Magnificent Seven are pioneers in their fields 🥇
• Growth Potential: AI, cloud computing, and other tech trends fuel expansion 📊
• Dividend Payouts: Some companies offer dividends, adding income potential 🔧
Got the best of both worlds! 🏦
(7/9) – SWOT: WEAKNESSES & OPPORTUNITIES ⚖️
• Weaknesses: High valuations, potential for overinvestment 📉
• Opportunities: Emerging technologies like quantum computing, biotech integration, per strategy 📈
Can they stay ahead of the curve? 🤔
(8/9) – POLL TIME! 📢
MAGS at $46.85—your take? 🗳️
• Bullish: $50+ soon, tech’s unstoppable 🐂
• Neutral: Steady, risks balance gains ⚖️
• Bearish: $40 looms, overhyped and due for correction 🐻
Chime in below! 👇
(9/9) – FINAL TAKEAWAY 🎯
MAGS’s $46.85 price reflects the dynamism of the tech sector 📈, but with risks from valuations and regulatory pressures 🌿. DCA-on-dips could be a strategy to manage volatility. Gem or bust?

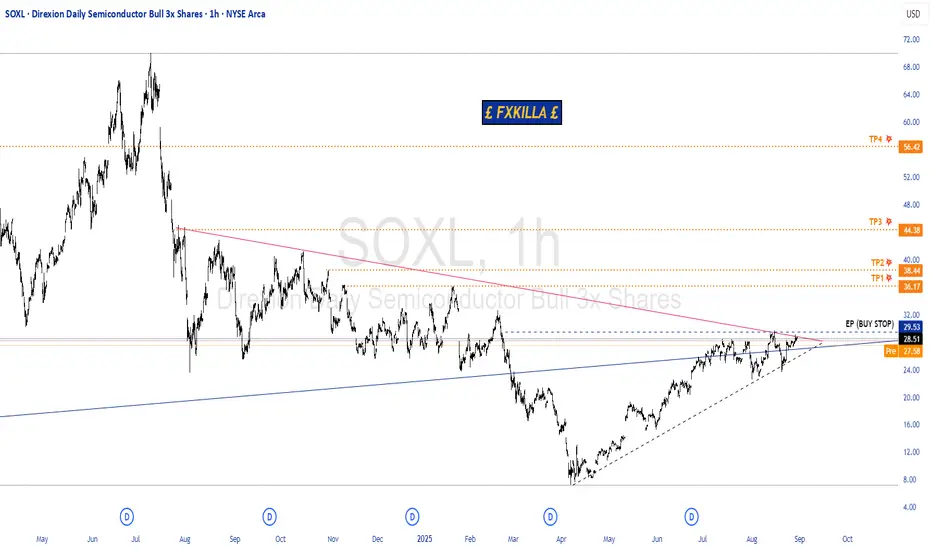
SOXL HIGH PROBABILITY BUY SETUP SOON!!🚨 SOXL HIGH PROBABILITY BUY SETUP 🚨
* Here We Can See Clearly The Next Potential Move For SOXL Coming Hours/Days.
* Keep Your Eyes Close On Your Trading Positions.
* Happy PIP Hunting Traders.
£ FXKILLA £
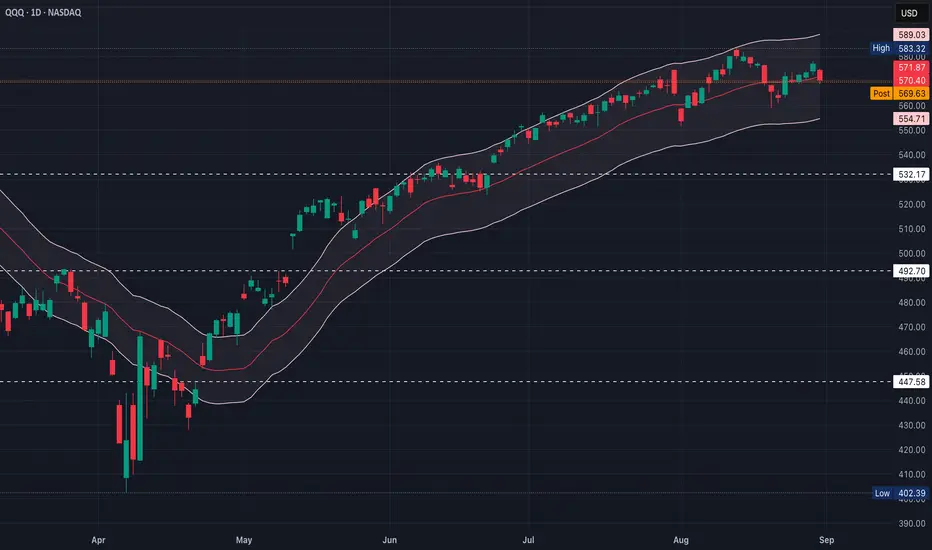
QQQ Pure LottoMomentum indicators (like stoch/RSI) are mid-range, so still room either way
The dominant developing pattern is an ascending triangle under $580
That favors a bullish breakout if buyers hold $574–$575
If ~$580 fails again, it flips into a short-term pullback
What we’ve seen since mid-August looks more like a round bottom recovery than an upside-down “U”
The “handle-like” action under $580 is tight & flat, not sloping down
That aligns more with an ascending triangle (bullish) than an inverted cup & handle (bearish)
If this were a true inverted cup & handle, expect a weak “handle” bounce that fails near resistance before rolling over
However, the bounce off $559 hasn’t been shallow; instead, price has climbed into a rising channel
That channel is more characteristic of a bearish rising wedge than a handle
Rising wedges often resolve lower, but they do climb higher first, sometimes to retest prior resistance ($580–$583)
A close above $583 on volume invalidates the bear case
Negates the “cup” idea & confirms a breakout
A breakdown of the rising wedge (below ~$572 then $568)
Aligns with the inverted cup & handle thesis and target ~$559
Right now, a bearish wedge inside the potential inverted cup & handle
If it breaks down, it validates the bearish case
If it powers through $583, it flips back to bullish continuation
Trading a bearish setup inside an uptrend context
Inverted cup + wedge is bearish, but bulls still have a chance until $583 is rejected
Think of 583 as the “line in the sand”
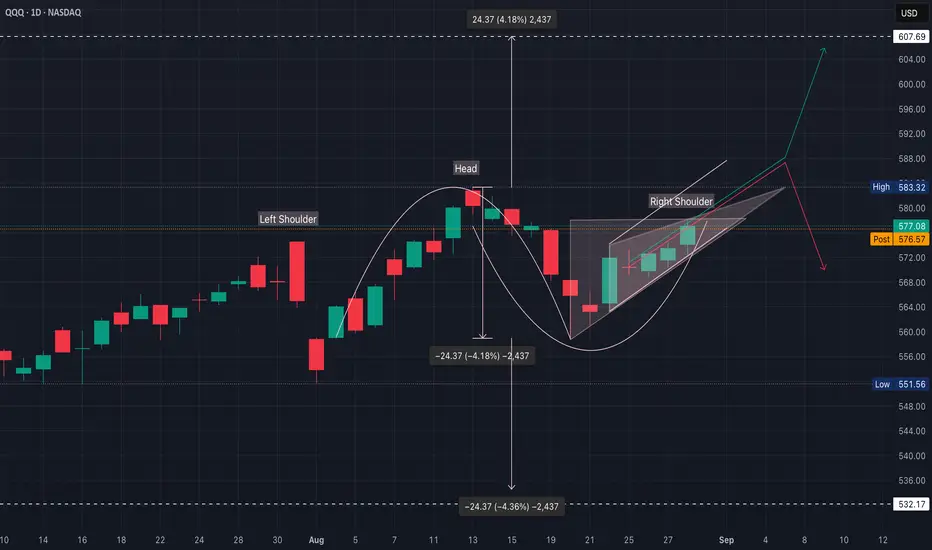
1. Bearish Case (~55% probability)
Head & Shoulders + rising wedge
Failure to break/close above $583
Target $568 (neckline)
If sellers press, $550–$555 with a full measured move to ~$532, but may need a macro shock to hit
2. Bullish Case (≈40% probability)
Strong breakout & hold above $583
Squeeze toward $590 (prior resistance)
If momentum + AI narrative revives, $605–$607
Would represent a sentiment shift
3. Neutral/Chop (≈5% probability)
Sideways consolidation $570–$580
Economic data this week comes mixed results in no conviction
$583 is the decision point & $568 is the neckline where bears are in control
NVDA earnings reaction + economic data (jobs, inflation)
If rally is on weak volume, likely a bull trap
The market leans bearish unless bulls can decisively close >$583