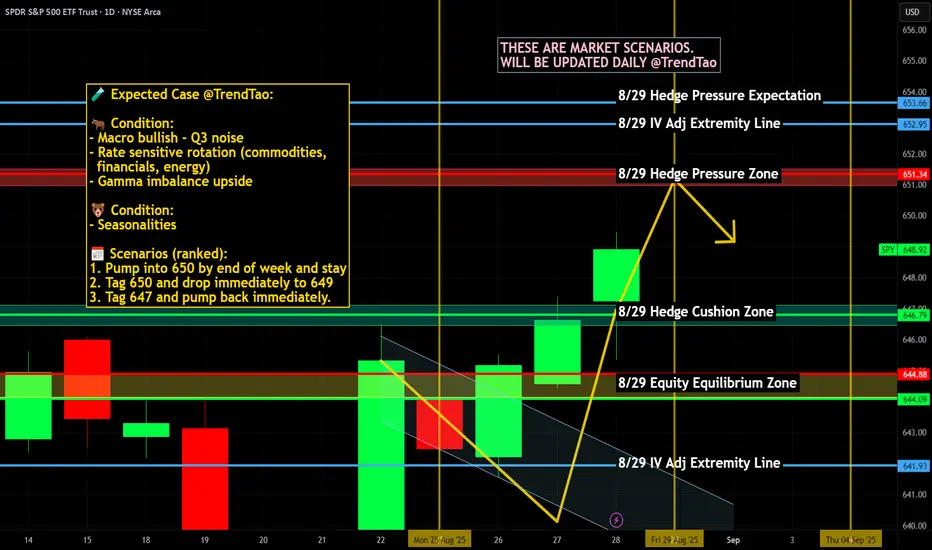
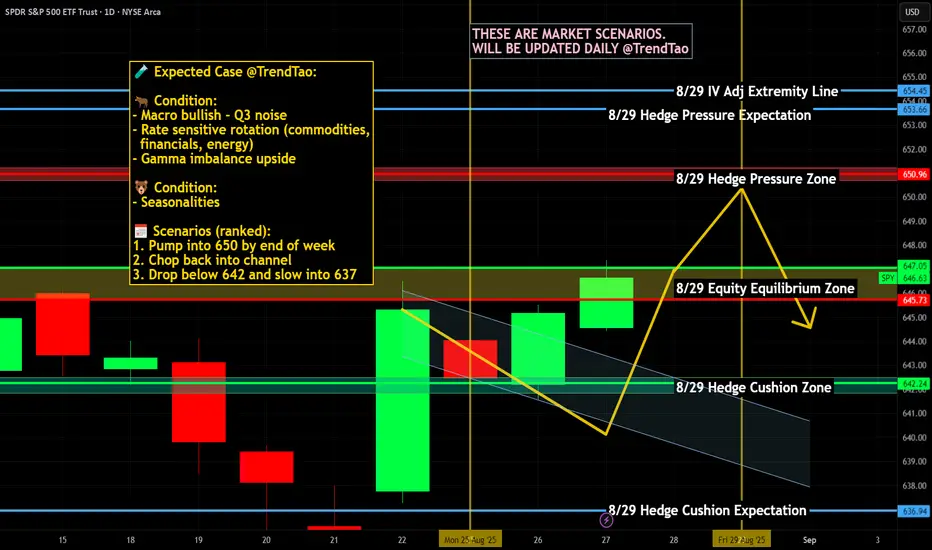
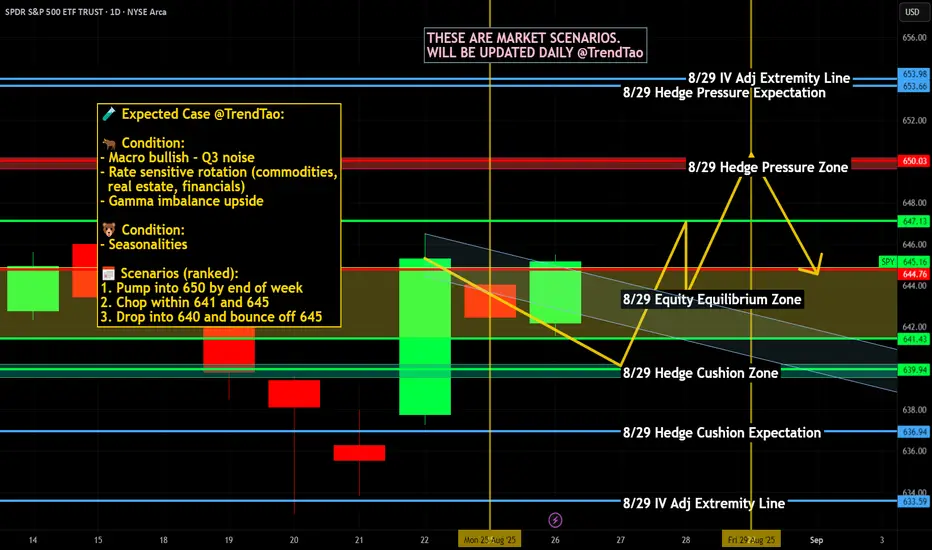
$SPY / $SPX Scenarios — Friday, Aug 29, 2025🔮 AMEX:SPY / SP:SPX Scenarios — Friday, Aug 29, 2025 🔮
🌍 Market-Moving Headlines
🔥 Fed’s favorite inflation gauge hits: PCE arrives just as markets digest Powell’s Jackson Hole tone.
💵 Consumer under the microscope: Spending & income data reveal demand strength heading into fall.
🏭 Regional PMI wrap: Chicago PMI closes out August with a manufacturing pulse check.
📊 Key Data & Events (ET)
⏰ 8:30 AM — PCE Price Index (Jul)
⏰ 8:30 AM — Personal Income & Outlays (Jul)
⏰ 9:45 AM — Chicago PMI (Aug)
⏰ 10:00 AM — UMich Consumer Sentiment (Final, Aug)
⚠️ Disclaimer: Educational/informational only — not financial advice.
📌 #trading #stockmarket #SPY #SPX #PCE #inflation #Fed #bonds #economy #PMI #consumerconfidence
ETF market
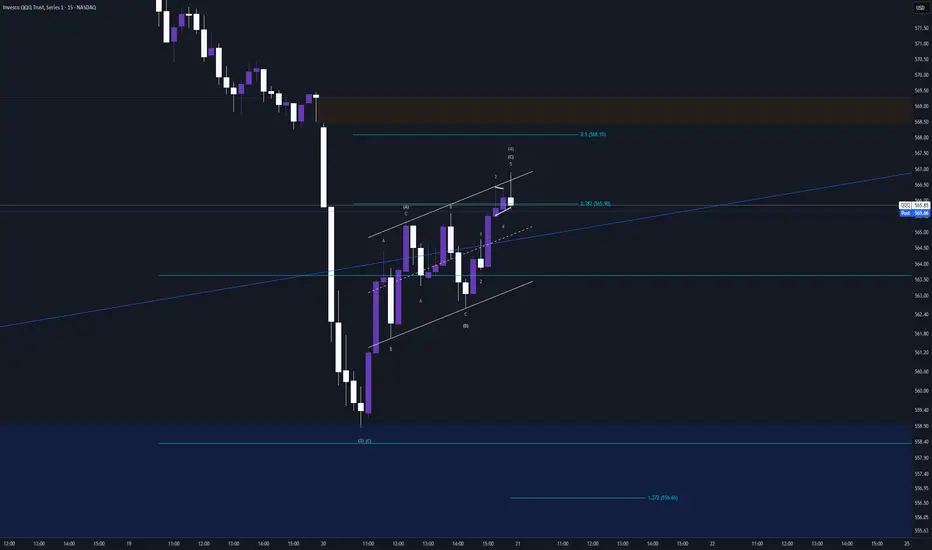
QQQ 5th leg down tomorrow?Normally wouldn't want to publish anything this short term, but the rally this afternoon looks like a 3-3-5 flat for wave 4. It stayed within the channel and the close for the day was under the 38% retracement of wave 3 after going over it.
QQQ LongLooking at QQQ on the 15-minute chart, the broader market structure has shifted from bearish to more balanced after a deep selloff earlier in the month. The sharp decline created a series of lower lows until buyers stepped in aggressively around 560, forming a clear Change of Character (CHoCH) as the downtrend stalled. Since then, the structure has transitioned into higher lows, with price now pushing back toward prior supply levels. The most recent rally suggests buyers have regained momentum, though the major Break of Structure (BOS) needed to confirm a full trend reversal would come above 583.32.
The key supply zones sit between 576–578 and higher up at 580–582, both of which previously sent price lower with strong rejections. These are significant resistance areas where sellers showed control, and they remain strong supply zones until decisively broken. On the demand side, the 570–571 region has proven itself as a solid base, where buyers stepped in with strength on multiple retests. Deeper demand sits closer to 561–563, which sparked the strongest bullish reaction, making it the most reliable support zone if tested again.
Within the marked region, price is pressing into the 576 supply, showing a small pause but not yet a full rejection. The price action suggests buyers may allow a shallow pullback toward 572–573 before attempting another push into the 577–580 zone. If demand holds on that pullback, continuation higher into the upper supply looks likely. However, if 570 is lost, that would be a sign of weakness and could shift the short-term bias back toward sellers.
Trade bias: Short-term bullish
Expected direction: A continuation higher into 577–580 supply, possibly after a shallow pullback
Invalidation level: A decisive break below 570 demand would flip the bias bearish
Momentum condition: Buyers currently hold the edge, with clean higher lows and strong candles on impulses
Price behavior: Consolidation under supply, signaling accumulation before the next test higher
What no one will reveal to you about volume. Theory and PracticeFor Richard W. Schabacker, whom I consider the father of Technical Analysis in the West, rigorous technical analysis must combine the study of price and volume. Paradoxically, volume was the last piece of data I effectively integrated into my trading, due to the scarcity of practical information.
In this article, I will explore the classical view of using volume and then my personal approach, based on logic and accumulated experience.
Whether you are a novice or an expert in the markets, and whether or not you use volume to clarify your analyses, reading this article will enrich your perspective on this topic.
The Ichimoku indicator values displayed on the screen are personal variations, resulting from my research. I hope they are useful to you.
What is Volume?
In the context of financial markets, volume represents the number of shares, contracts, or lots traded in an asset over a specific period of time.
Volume reflects the intensity of market activity and is represented as a histogram just below the price chart.
"Volume is a relative matter; that is, when we speak of high volume, we refer to a transaction volume greater than what has prevailed for some time before."
— Richard W. Schabacker, Technical Analysis and Stock Market Profits
Classical View of Volume:
Generally, the main proponents inShannon proponents in this discipline see volume as useful for the following purposes:
1. Confirming the Strength of a Trend:
Volume should accompany the strength of a trend, and if volume is weak, it is likely that we can anticipate a reversal, as low volumes in a trend indicate a loss of interest among participants.
2. Analyzing Support and Resistance:
Most major proponents tend to view weak volume as a signal for potential reversals, while recommending validating breakouts of support and resistance with increased volume.
3. Analyzing Continuation or Exhaustion Patterns:
The classical approach suggests that before entering continuation or exhaustion patterns (such as accumulations, distributions, head and shoulders, double tops and bottoms, triangles, etc.), there should be a depletion of volume, followed by a breakout of the pattern with a significant increase in volume to confirm the presence of participant interest.
This approach is solid in theory, but in practice, it can lead to subjective interpretations and errors if not properly contextualized.
Personal View: May the Force Be with You
In my experience, volume should not be primarily interpreted by observing weakness, as this can lead to misreadings and premature market entries. Instead, I recommend focusing on detecting strength as the decisive factor. High volume reveals the massive entry of participants or large orders—whether from large investors or institutions—leaving a clear footprint in the market. These large orders, whether buy or sell, indicate real commitment and potential for sustained movements.
On Volume and Trend Analysis:
Why base a reversal on the weakness of a trend when the key is to identify the context and strength driving the change? A clearly weakened price action backed by low volumes can extend in the direction of the trend, draining our accounts if we base our entries on volume weakness. Whether trading with or against the trend, the turning point must be supported by robust volume. This spike in activity confirms the presence of large investors or institutions in action, translating into greater interest and liquidity.
As technical analysts, our goal is to capture fluctuations or trends, not to diagnose whether a trend is "healthy." Weakness is relevant information for detecting exhaustion, but it is strength, in the right context and with proper confirmation (through patterns), that will increase our success rate and improve our risk-reward ratio.
In Figure 1.1, we can see how volume spikes generally predict pauses or reversals in trends.
Figure 1.1
Tesla. Daily Chart
In Figure 1.2, we can observe how weak volume could indicate a loss of interest from participants (1 and 2), but it is an increase in volume combined with a Japanese candlestick pattern (3) that can confirm a likely effective entry.
Figure 1.2
BTC/USDT Daily Chart
On Volume in Support and Resistance Analysis:
As mentioned earlier, weakness is relevant information, but strength is essential to validate a trend reversal or continuation.
According to the classical approach, a breakout of support or resistance should be backed by a significant increase in volume. However, experience has taught me that the high volume detected during a breakout often represents common bull or bear traps, where buyers or sellers get trapped.
There are several reasons for this: supports and resistances are psychological zones that are constantly evolving, making it easy to confuse breakout volume with rejection volume. Additionally, during breakouts of significant supports or resistances, large institutions often manipulate or protect their positions by executing large buy or sell orders.
How can we avoid falling into bull or bear traps, or even use them to our advantage?
Personally, I recommend not seeking breakouts of supports and resistances based on volume. Price compressions around supports and resistances are more useful for this purpose, as they reveal the intent and dominance of buyers or sellers while offering a superior risk-reward ratio. High volumes generally indicate rejection, even if the zone appears to have been broken. Without prior compression—or accumulation or distribution—it is never advisable to chase breakouts.
In Figure 1.3, we can observe two phenomena in one: the breakout of a consolidation pattern and the breakout of a resistance ($110,000) following a price compression (3). Notice how buying forces intensely defended the $100,000 zone, as evidenced by volume spikes and large engulfing patterns that preceded them (1 and 2). The price compression at the $110,000 zone reveals the bullish intent to break the resistance in a context where buying strength is dominant.
On the other hand, in Figure 1.4, I show you what a bear trap looks like. Observe how what appears to be a confirmed breakout with volume at a defended support level ended up being a significant rejection by large investors or institutions (1).
At this point, I will make two clarifications:
The volume histogram is represented with colors on some investment platforms to facilitate the visual detection of patterns, but volumes themselves do not have color. Whether a volume is bullish or bearish does not depend on whether the accompanying candlestick is bullish or bearish, but rather on the real-time interpretation of the technical analyst and, above all, on the subsequent development of events. In the example of the false breakout in Figure 1.4, we observe a bullish rejection volume.
Another vital aspect is that supports in strong and healthy uptrends will generate more false breakouts than reliable ones, so I recommend taking more long entries. Additionally, during the euphoria and hope characteristic of a bullish market, short entries will be extremely risky.
In the articles “Bear and Bull Traps” and “Double Pressure: The Key to Successful Breakout Trading,” I describe these phenomena in detail.
Figure 1.3
BTC/USDT Daily Chart
Figure 1.4
BTC/USDT 4-Hour Chart
On Volume in Continuation or Exhaustion Patterns:
While it is often recommended to ensure a decrease in volume prior to the breakout of an exhaustion pattern, I recommend ensuring the detection of large volumes within the exhaustion pattern itself and confirming entries based on price compressions at the boundaries of the accumulation or distribution range.
Large volumes in continuation or exhaustion patterns indicate that many participants or strong institutions are partially or fully closing their buy or sell positions, which can lead to a correction. Even investors like Thomas Bulkowski have noted that the success rate increases in patterns where large volumes are present.
On the other hand, contrary to the classical approach, I recommend avoiding confirming entries based on pattern breakouts with large volume, as exhaustion and trend continuation patterns often generate strong bursts of volatility. In the best case, this may cause you to miss the trend, but in the worst case, it will expose you to entries with poor risk-reward ratios. Price compressions are a safer option for making entries and capitalizing on volatility bursts.
In Figure 1.5, you can observe the effectiveness of price compressions in the right context and how volume is a key factor in determining the presence of large investors.
Figure 1.5
BTC/USDT Daily Chart
Some Additional Examples:
An ABCD pattern offers excellent opportunities to take entries based on volume, always with confirmation from price action. In Figure 1.6, you will observe how I would effectively use bear traps (D), which are very common in strong uptrends.
Figure 1.6
BTC/USDT Daily Chart
Relevant Data on Volume:
Volume in Forex and CFDs
Both the Forex market (currencies) and CFDs (contracts for difference) operate in a decentralized, over-the-counter (OTC) manner, meaning there is no centralized exchange where all trading volume is recorded.
In Forex, the volume displayed on platforms does not represent the "true" total volume of the global market, but rather the flow of trades within the liquidity pool of the broker or its liquidity providers.
CFDs, being OTC derivatives offered by brokers, follow the same pattern: the visible volume is specific to the broker and its liquidity network, not the total volume of the underlying market. Brokers aggregate liquidity from multiple providers (such as banks or dark pools), but traders only see a fraction of this, which may not reflect the actual volume of the underlying asset (e.g., a CFD on stocks does not show the total volume of the stock exchange).
Volume in Centralized Stock Exchanges
Stock markets like the NYSE are centralized, meaning all transactions are executed and recorded on a single regulated exchange. This allows for consolidated, real-time reporting of the total volume of shares traded on that exchange. The volume reflects all executed trades, including the total number of shares bought and sold. Under strict regulation, the data is standardized, audited, and publicly accessible.
Volume in the Cryptocurrency Market
The cryptocurrency market is decentralized and fragmented, similar to Forex: transactions occur across multiple global exchanges (such as Binance or Coinbase) without a unified central record. This makes the total volume an aggregation of data reported by each platform, introducing inconsistencies and potential manipulations.
Personally, I recommend prioritizing data from Binance, as it consistently leads in spot and derivatives trading volume globally, representing a significant portion of the market (approximately 30-40% in recent aggregated metrics).
Volume and the S&P 500
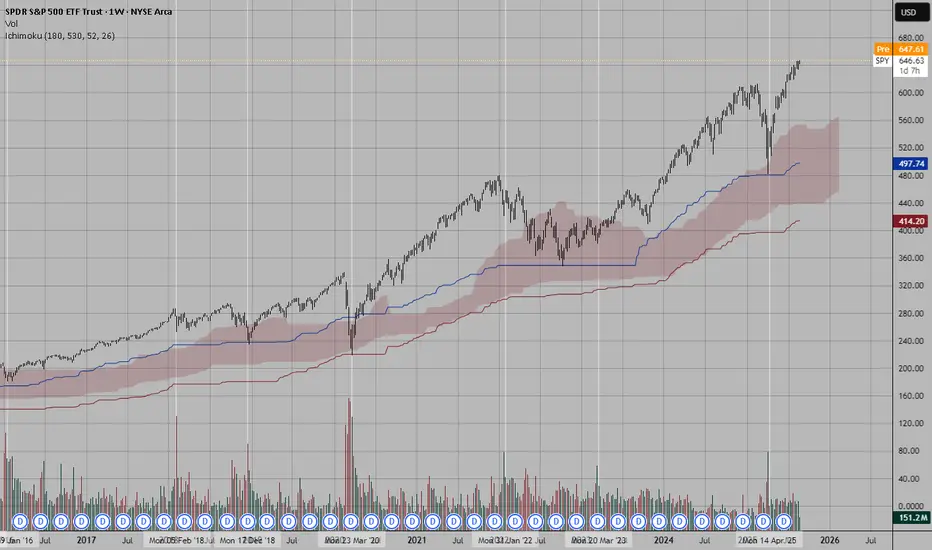
Although the S&P 500 index, being a composite indicator and not a tradable asset itself, does not record transaction volume, a smart strategy for analyzing volume related to this index involves monitoring the trading volume of the SPY ETF (SPDR S&P 500 ETF Trust). This exchange-traded fund closely tracks the performance of the S&P 500 and attracts a high level of trading activity, providing a valuable metric for assessing market interest, liquidity, and potential volume patterns during bullish or bearish trends.
In Figures 1.7 and 1.8, you can see how S&P 500 readings can be cleverly combined with SPY volume data.
Figure 1.7
S&P 500 Daily Chart
Figure 1.8
SPY Daily Chart
Final Note:
If you’d like to take a look at my analysis record, you can check out my profile in Spanish, where I transparently share well-defined market entries. Send your good vibes if you enjoyed this article, and may God bless you all.
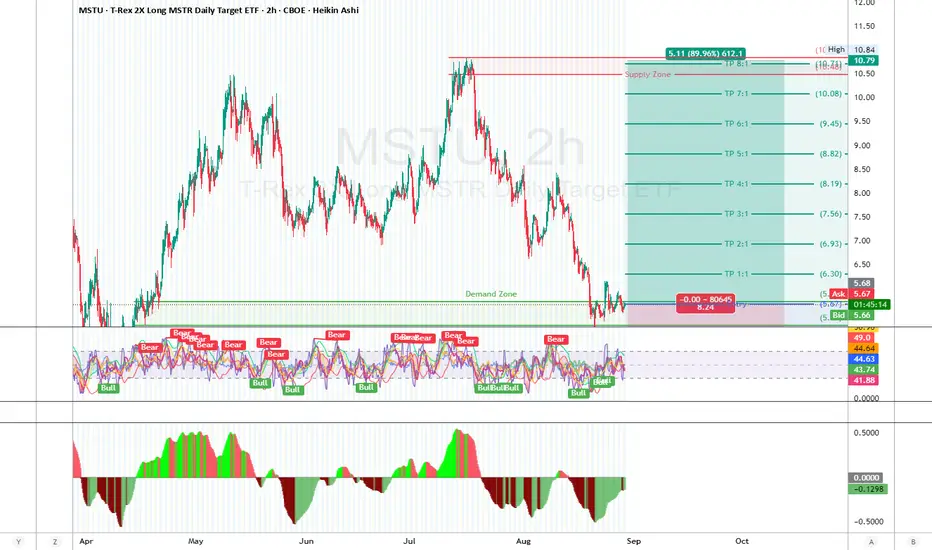
MSTU (T-Rex 2X Long MSTR ETF, 2H chart, Long MSTU – Sitting Right on a 2H Demand
MSTU has been in free fall since that 10.80 peak. Now, it’s parked right at a big demand zone (5.20–5.50) — the same area that held earlier this year.
MSTU is basically a leveraged bet on Bitcoin + MicroStrategy earnings.
MSTR just posted Q2: revenue flat, still net loss, but the big story = they now hold 226,500 BTC at ~$35.3K avg cost.
🟩 Demand Zone
5.20–5.50 → tested multiple times, still holding strong.
🟥 Supply Zone
10.50–10.80 → the area where sellers dumped hard.
RSI/Stoch Signals: After weeks of “Bear” signals, we’re now seeing a string of fresh “Bull” flashes as price stabilizes. Momentum is shifting.
MACD Histogram: Still slightly red, but starting to flatten out. If it flips green, that’s the trigger.
🎯 Trade Setup
Entry: Anywhere 5.50–5.70 (demand zone buy)
Stop Loss: 5.06 (below demand breakdown)
Target: 10.80 (major supply)
Risk/Reward: ~1:8 RR → high payoff if demand holds.
Trade Management
Move stop to Break Even once price clears 7.00.
Scale out partials near 8.50.
Let a runner ride into 10.50–10.80 for the home run.
“The best trades often feel the hardest to take.”
This one? It feels tough to buy because the chart looks wrecked — but that’s often when demand zones do their best work.
⚠️ Disclaimer
This is just my trading plan — not financial advice. MSTU is a leveraged ETF = big upside, but also amplified downside. Size small, manage risk.
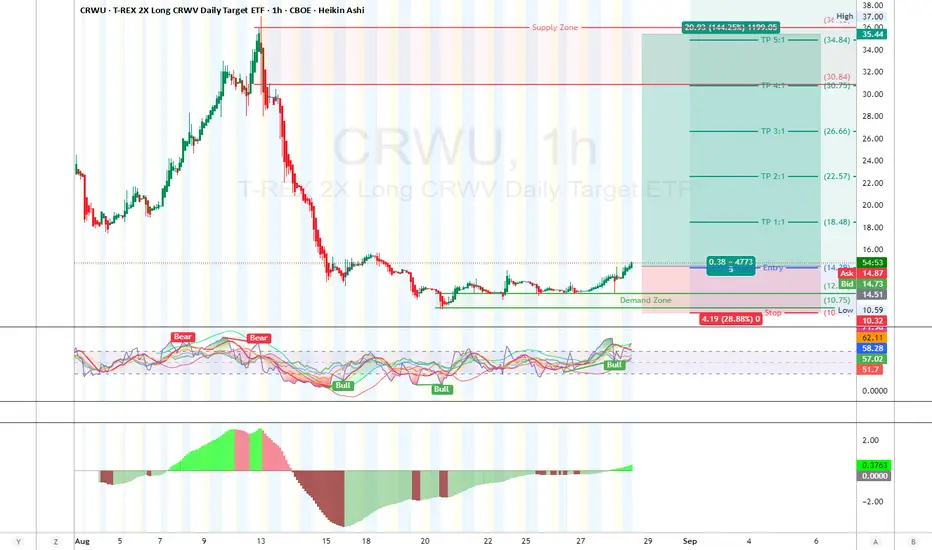
CRWU – Breakout From Demand Zone (1H) Long
CRWU (T-REX 2X Long CRWV Daily Target ETF).
CRWU got absolutely wrecked after that parabolic run to 35+, dumping all the way down into the 10s. But here’s the kicker — that flush might have been the reset this needed.
Price spent weeks building a solid base around 10.75–12.00, aka the demand zone.
Now we’re finally breaking out of the 14.40–14.50 ceiling. Green Heikin Ashi candles showing momentum flip.
Stoch/RSI printed fresh “Bull” signals after multiple oversold cycles.
MACD histogram turned green after a monster red wave = buyers stepping back in.
Demand & Supply
Demand Zone (Support): 10.75–12.00 → where bulls defended hard.
Supply Zones (Resistance): 30–35 → the “danger zone” where bag holders live.
Trade Plan
Entry: 14.30–14.50 (breakout zone)
Stop Loss: 10.30 (under demand lows, invalidate structure)
Take Profits (scale out):
TP1 → 18.48 (1R)
TP2 → 22.57 (2R)
TP3 → 26.66 (3R)
TP4 → 30.75 (4R)
TP5 → 35.44 (full send, retest highs)
Risk/Reward looks tasty — up to 5R if we squeeze back to the top.
Risk & Trade Management
I’ll risk 1–3% max. Leveraged ETFs like this move crazy fast, so small size only.
Once TP1 hits, I’d move stop to break-even and let the trade breathe.
I’d also scale out piece by piece — pros lock in profit on the way up.
Don’t forget: CRWU tracks CoreWeave (CRWV) 2×. They just reported Q2 earnings:
Revenue +207% YoY 💥
Backlog at $30B
“Amateurs want to be right. Professionals want to make money.”
I’m not here to marry the trade. If demand holds and we rip, great. If not, I cut it fast and move on.
⚠️ Disclaimer
This is not financial advice. Just sharing my plan for educational purposes. Leveraged ETFs = high risk, manage size, don’t chase blindly.
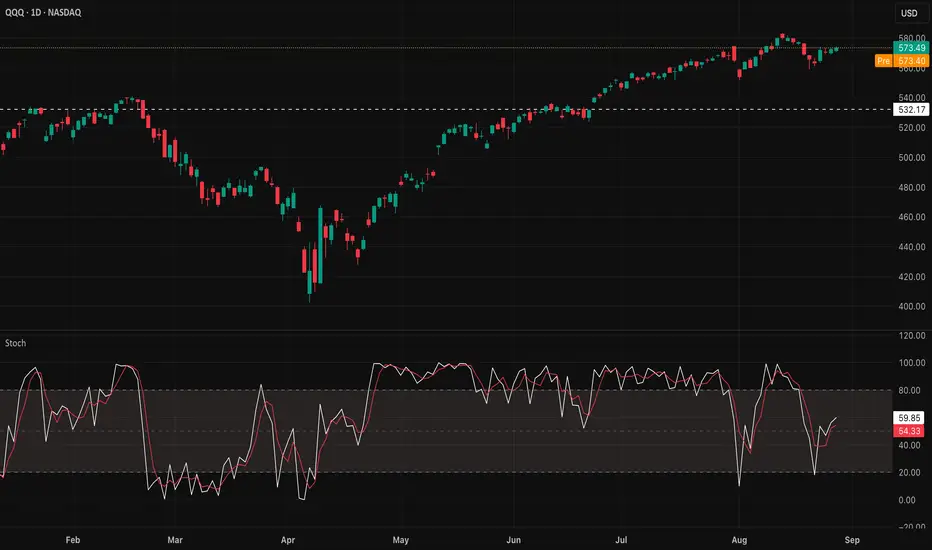
QQQ Break or Fail?Bullish Breakout
QQQ breaks and holds above $575
Calls with tight expiry (if momentum is strong) or slightly further out for safer time decay
Needs broad tech confirmation (NVDA, AAPL, MSFT, META & etc)
Bearish Rejection
QQQ fails to push above $575 and stalls
Puts with tight expiry for momentum, or stagger entries to scale in
If NVDA’s earnings fade spreads to semis, this path gains momentum
Current Bias
Momentum is mid-stochastic (not overbought/oversold)
That means the $575 zone is the decision point
The trade will likely set up today/tomorrow - break or fail
Volatility at lows... Watch out. I have unloaded 50% of my large positions and took some positions to hedge the market such as UVXY. We have 4hr, daily and weekly time frames in oversold conditions. Watch for a reaction or overaction to news here in the next week or so. We have lots of economic data coming out. Statistically, when volatility gets this low the VIX and UVXY will run hard. This is a short term scalp trade for me. I am not really that bearish overall but it seems like a pull back in the markets is due soon. Not financial advice, DYOR. Stay Blessed!
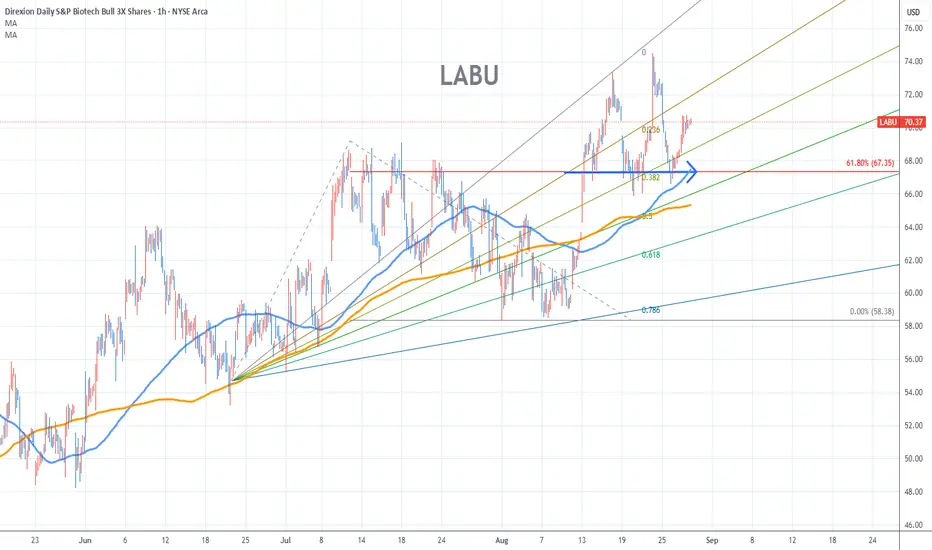
LABU Stock Chart Fibonacci Analysis 082725Trading Idea
1) Find a FIBO slingshot
2) Check FIBO 61.80% level
3) Entry Point > 67.3/61.80%
Chart time frame:C
A) 15 min(1W-3M)
B) 1 hr(3M-6M)
C) 4 hr(6M-1year)
D) 1 day(1-3years)
Stock progress:C
A) Keep rising over 61.80% resistance
B) 61.80% resistance
C) 61.80% support
D) Hit the bottom
E) Hit the top
Stocks rise as they rise from support and fall from resistance. Our goal is to find a low support point and enter. It can be referred to as buying at the pullback point. The pullback point can be found with a Fibonacci extension of 61.80%. This is a step to find entry level. 1) Find a triangle (Fibonacci Speed Fan Line) that connects the high (resistance) and low (support) points of the stock in progress, where it is continuously expressed as a Slingshot, 2) and create a Fibonacci extension level for the first rising wave from the start point of slingshot pattern.
When the current price goes over 61.80% level , that can be a good entry point, especially if the SMA 100 and 200 curves are gathered together at 61.80%, it is a very good entry point.
As a great help, tradingview provides these Fibonacci speed fan lines and extension levels with ease. So if you use the Fibonacci fan line, the extension level, and the SMA 100/200 curve well, you can find an entry point for the stock market. At least you have to enter at this low point to avoid trading failure, and if you are skilled at entering this low point, with fibonacci6180 technique, your reading skill to chart will be greatly improved.
If you want to do day trading, please set the time frame to 5 minutes or 15 minutes, and you will see many of the low point of rising stocks.
If you want to prefer long term range trading, you can set the time frame to 1 hr or 1 day
$SPY / $SPX Scenarios — Thursday, Aug 28, 2025🔮 AMEX:SPY / SP:SPX Scenarios — Thursday, Aug 28, 2025 🔮
🌍 Market-Moving Headlines
🏔️ Jackson Hole aftershocks: Markets still digest Powell’s stance; cut odds for September in focus.
📉 GDP revision risk: Growth momentum under the microscope with Q2 update.
🛠️ Labor market cooling? Jobless claims set the tone into Friday’s PCE.
📊 Key Data & Events (ET)
⏰ 8:30 AM — Initial Jobless Claims (weekly).
⏰ 8:30 AM — GDP (Q2, 2nd Estimate).
⏰ 11:00 AM — Kansas City Fed Manufacturing Index (Aug).
⚠️ Disclaimer: Educational/informational only — not financial advice.
📌 #trading #stockmarket #SPY #SPX #Fed #GDP #joblessclaims #JacksonHole #bonds #economy
Invesco Physical Silver ETC | Chart & Forecast SummaryKey Indicators On Trade Set Up In General
1. Push Set Up
2. Range Set Up
3. Break & Retest Set Up
Notes On Session
# Invesco Physical Silver ETC
- Double Formation
* (A+ SIgnal)) - Short Entry - *5EMA | Subdivision 1
* Medium Range | No Size Up - *Reversal Area | Completed Survey
* 30bars, 2744d | Date Range Method - *(Uptrend Argument))
- Triple Formation
* (P1)) / (P2)) & (P3)) | Subdivision 2
* 3 Monthly Time Frame | Trend Settings Condition | Subdivision 3
- (Hypothesis On Entry Bias)) | Regular Settings
* Stop Loss Feature Varies Regarding To Main Entry And Can Occur Unevenly
- Position On A 1.5RR
* Stop Loss At 25.00 USD
* Entry At 33.00 USD
* Take Profit At 45.00 USD
* (Uptrend Argument)) & No Pattern Confirmation
- Continuation Pattern | Not Valid
- Reversal Pattern | Not Valid
* Ongoing Entry & (Neutral Area))
Active Sessions On Relevant Range & Elemented Probabilities;
European-Session(Upwards) - East Coast-Session(Downwards) - Asian-Session(Ranging)
Conclusion | Trade Plan Execution & Risk Management On Demand;
Overall Consensus | Buy
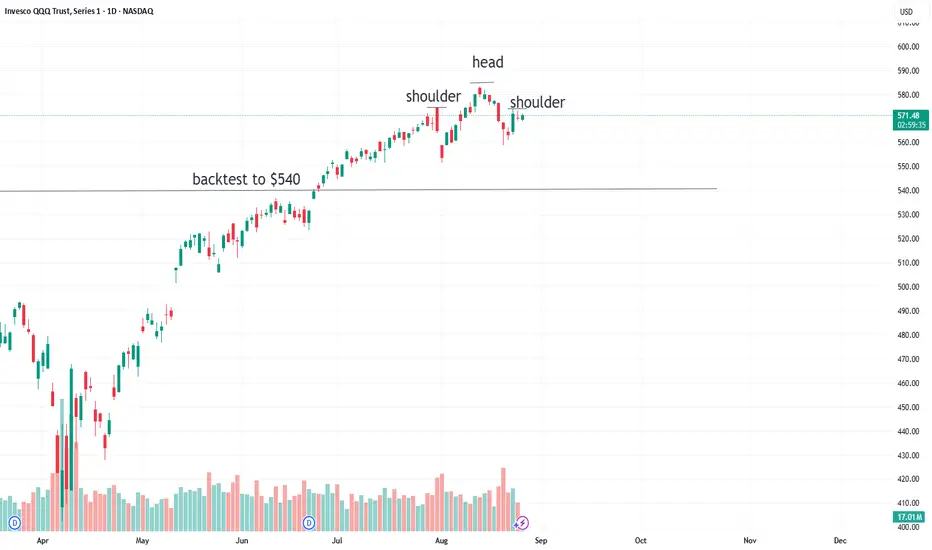
September Collapse in QQQAfter the April Tariff collapse, the index rose significantly off of the bottom and blew right past prior highs. There is a need to back-test to the $540 range. Further, which the government taking fascist equity positions in publicly traded equities and threatening the independence of the federal reserve, there are black swans looming everywhere. Also, tariffs will soon start impacting inflation, just as cracks are forming in the job market. However, can you really rely on the data since the head of BLS was fired for telling the truth about jobs?
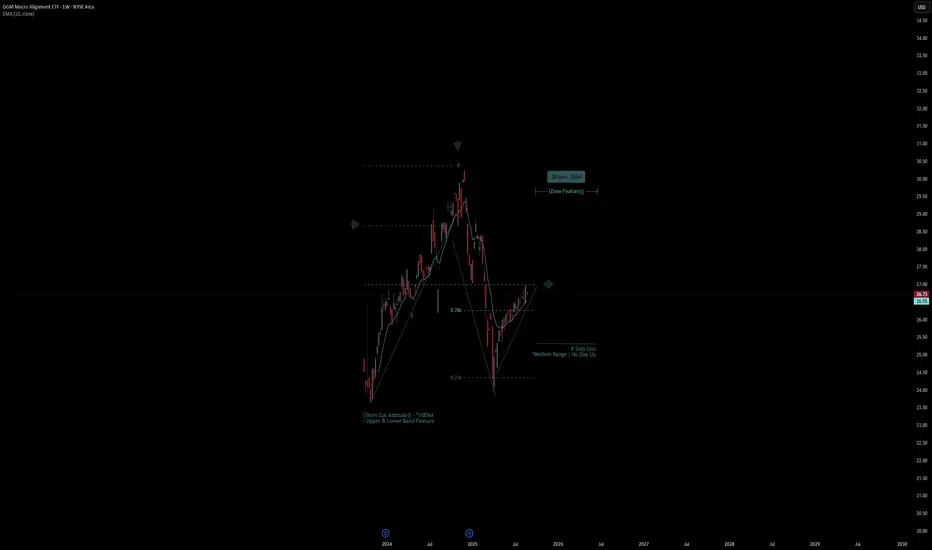
GGM Macro Alignment ETF | Chart & Forecast SummaryKey Indicators On Trade Set Up In General
1. Push Set Up
2. Range Set Up
3. Break & Retest Set Up
Notes On Session
# GGM Macro Alignment ETF
- Double Formation
* Upper & Lower Band Feature - Long Entry - *10EMA | Subdivision 1
* Medium Range | No Size Up - *Retest Area | Completed Survey
* 40bars, 280d | Date Range Method - *(Uptrend Argument))
- Triple Formation
* (P1)) / (P2)) & (P3)) | Subdivision 2
* Weekly Time Frame | Trend Settings Condition | Subdivision 3
- (Hypothesis On Entry Bias)) | Regular Settings
* Stop Loss Feature Varies Regarding To Main Entry And Can Occur Unevenly
- Position On A 1.5RR
* Stop Loss At 25.00 USD
* Entry At 26.00 USD
* Take Profit At 28.00 USD
* (Uptrend Argument)) & No Pattern Confirmation
- Continuation Pattern | Not Valid
- Reversal Pattern | Not Valid
* Ongoing Entry & (Neutral Area))
Active Sessions On Relevant Range & Elemented Probabilities;
European-Session(Upwards) - East Coast-Session(Downwards) - Asian-Session(Ranging)
Conclusion | Trade Plan Execution & Risk Management On Demand;
Overall Consensus | Buy
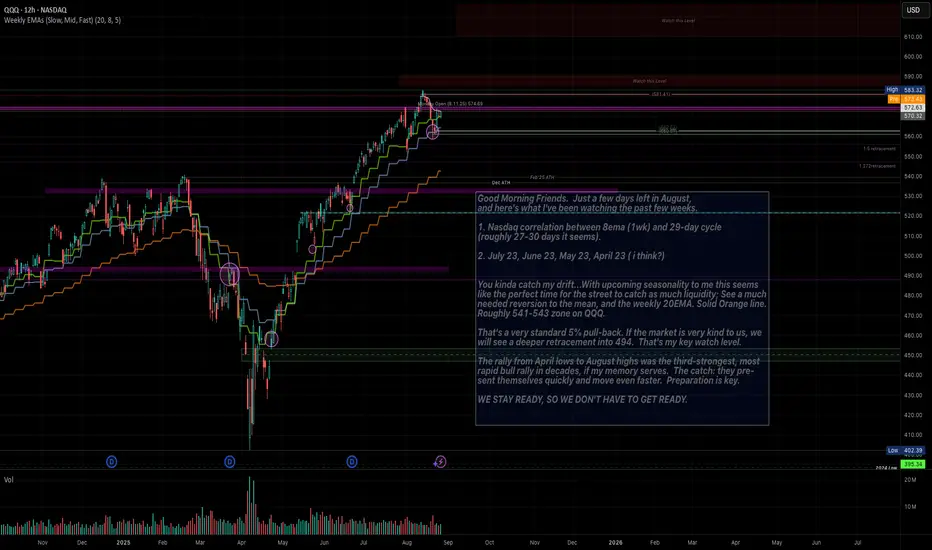
QQQ: REVERSION TO 20WK.EMA? 544-542 Zone? Upcoming seasonality is right on-time. Saw a stat which read 25 of 27 times, the market sold after Jackson Hole, Wy event with FED speaker.
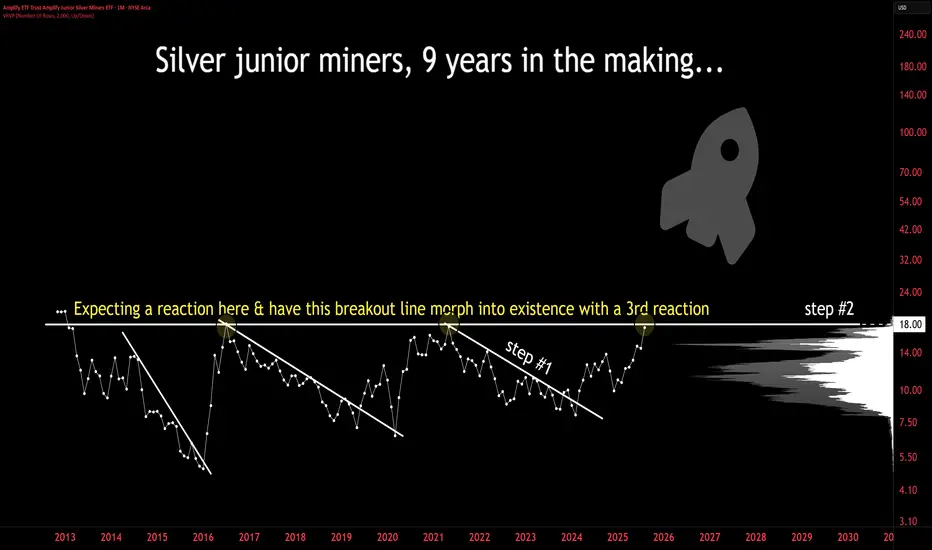
bull era for silver junior miners is ahead of us, not behindStep #1 ✅ Completed.
Step #2⏭️ On deck.
The bull era for silver junior miners is ahead of us, not behind.
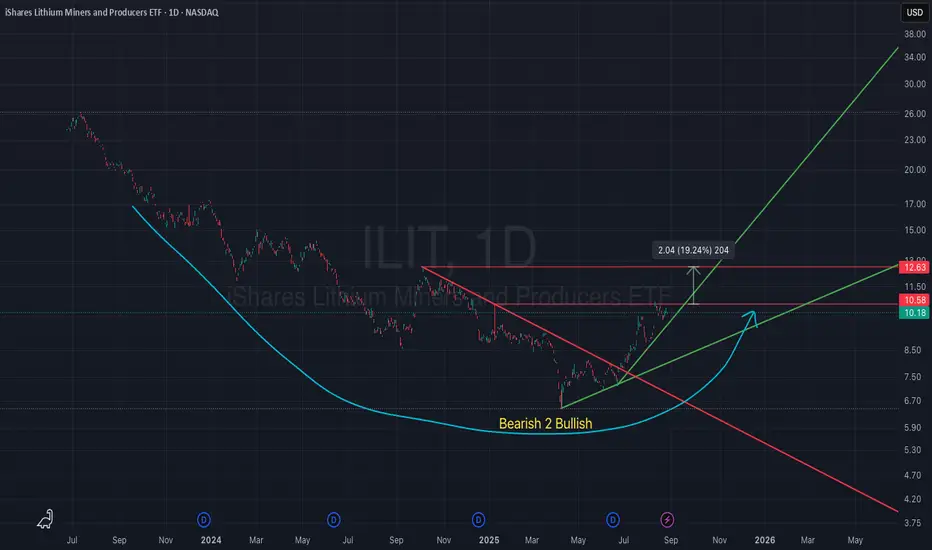
iShares Lithium Miners & Producers ETF (ILIT) – Bearish to BulliILIT is showing signs of a major trend reversal after a long bearish cycle. The ETF has broken out of its descending trendline (red) and is now establishing a new bullish trendline (green). The rounded bottom structure highlights a transition from bearish to bullish momentum.
Currently, price is consolidating around $10.20–10.60, just below the key resistance level at $12.60. A breakout above this zone could confirm a strong bullish continuation.
🔑 Trade Plan:
Entry Trigger: Break and close above $10.60–11.00 for early confirmation, or above $12.60 for full breakout.
Profit Targets:
Target 1: $12.60 (+19%)
Target 2: $18.00–20.00 (medium term)
Target 3: $30.00+ (long-term projection if bullish momentum sustains).
Stop-Loss: Below $9.50 (back inside bearish zone).
📊 ILIT’s chart shows strong accumulation and a potential sector-wide recovery in lithium miners. If buyers step in at the current level, this ETF could transition into a long-term uptrend.
Not financial advice. No responsibility for any actions taken.
$SPY / $SPX Scenarios — Wednesday, Aug 27, 2025🔮 AMEX:SPY / SP:SPX Scenarios — Wednesday, Aug 27, 2025 🔮
🌍 Market-Moving Headlines
🇺🇸➡️🇮🇳 U.S. slaps 50% tariffs on Indian goods (textiles, gems, leather, machinery) starting today — inflation & trade ripple risk.
💻 Earnings spotlight: Nvidia, CrowdStrike, Snowflake, Alibaba reporting this week → tech volatility in focus.
📊 Key Data & Events (ET)
⏰ All Day — U.S. Treasury Auctions (10-year note, 5-year note + FRN).
⏰ 11:45 AM — Richmond Fed Pres. Tom Barkin speaks.
⚠️ Disclaimer: Educational/informational only — not financial advice.
📌 #trading #stockmarket #SPY #SPX #Fed #tariffs #India #Treasury #earnings #tech #Nvidia
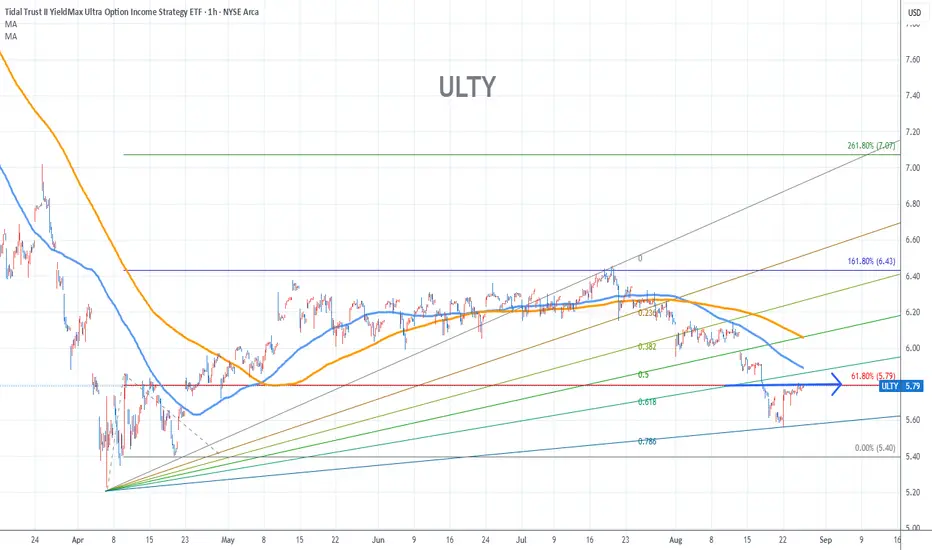
Ulty Stock Chart Fibonacci Analysis 082625Trading Idea
1) Find a FIBO slingshot
2) Check FIBO 61.80% level
3) Entry Point > 5.8/61.80%
Chart time frame:B
A) 15 min(1W-3M)
B) 1 hr(3M-6M)
C) 4 hr(6M-1year)
D) 1 day(1-3years)
Stock progress:B
A) Keep rising over 61.80% resistance
B) 61.80% resistance
C) 61.80% support
D) Hit the bottom
E) Hit the top
Stocks rise as they rise from support and fall from resistance. Our goal is to find a low support point and enter. It can be referred to as buying at the pullback point. The pullback point can be found with a Fibonacci extension of 61.80%. This is a step to find entry level. 1) Find a triangle (Fibonacci Speed Fan Line) that connects the high (resistance) and low (support) points of the stock in progress, where it is continuously expressed as a Slingshot, 2) and create a Fibonacci extension level for the first rising wave from the start point of slingshot pattern.
When the current price goes over 61.80% level , that can be a good entry point, especially if the SMA 100 and 200 curves are gathered together at 61.80%, it is a very good entry point.
As a great help, tradingview provides these Fibonacci speed fan lines and extension levels with ease. So if you use the Fibonacci fan line, the extension level, and the SMA 100/200 curve well, you can find an entry point for the stock market. At least you have to enter at this low point to avoid trading failure, and if you are skilled at entering this low point, with fibonacci6180 technique, your reading skill to chart will be greatly improved.
If you want to do day trading, please set the time frame to 5 minutes or 15 minutes, and you will see many of the low point of rising stocks.
If you want to prefer long term range trading, you can set the time frame to 1 hr or 1 day
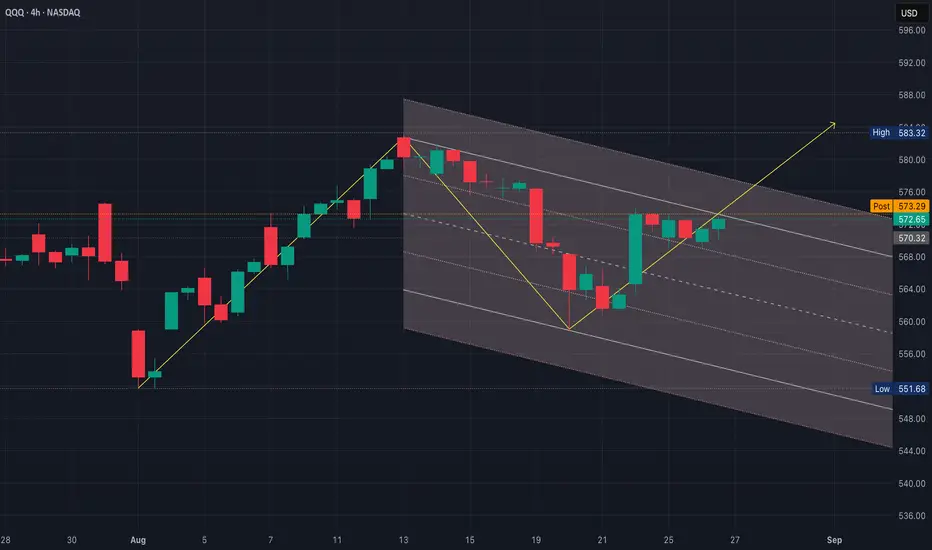
QQQ Bearish vs Bullish Continuation A bull flag needs 3 key ingredients
1. Flagpole (strong impulsive move up)
• QQQ ran from ~$563 (5 Aug) to ~$583 (14 Aug)
2. Flag (controlled consolidation)
• The consolidation after 14 Aug hasn’t just been a tight downward drift; instead, QQQ dropped sharply to ~$563 (not shallow, that’s a full retrace)
• Bounced, but then chopped sideways inside a descending channel
• It looks more like a bearish channel than a neat flag that’s hugging the 50% retrace level
3. Volume & structure
• In a bull flag, you want volume drying up during the pullback
• The selling volume stayed heavy at times
• The “flag” portion is wider, choppier & longer in time than a bull flag (which is usually 1/3 the length of the pole)
This pattern is flag-like, but it leans closer to a descending channel/consolidation than a bull flag
• If bulls can break $575 on rising volume, it becomes a flag breakout
• If QQQ slips under $568, then it invalidates the bull flag & resolves bearish (a continuation of the down-channel)
It can be a bull flag, but right now it’s an ambiguous consolidation that will only prove itself with a breakout over $575
• If QQQ breaks $575 with conviction, the projected target = $583 + $20 = ~$603
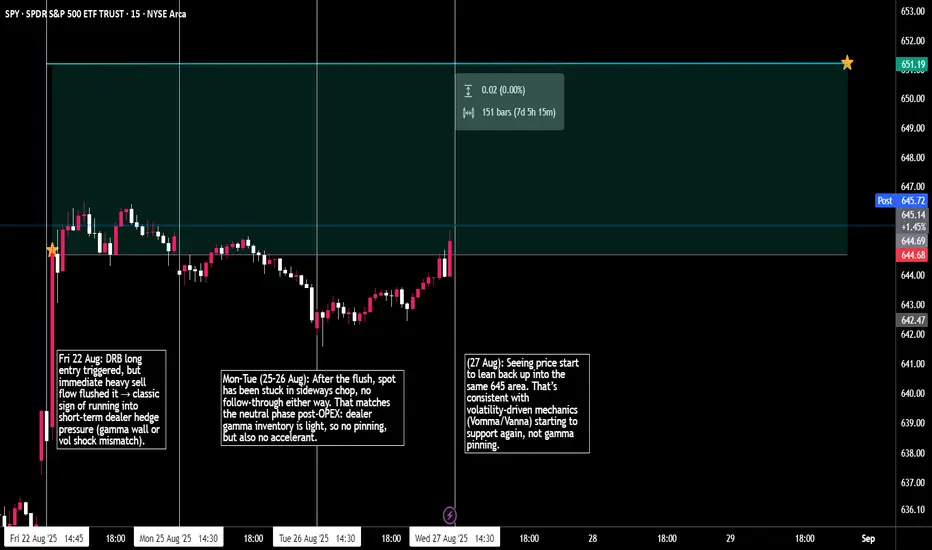
Convexity Doesn’t Care: Pinned, Suppressed, Released.This is antifragile flow in action.
Fri: DRB signal fires, but spot runs headfirst into a gamma wall. Dealers long gamma = suppression, absorption, fakeout.
Mon: OPEX clears. Pin decays. Market resets. Neutral, no follow-through yet.
Tue: Vomma/Vanna flows finally kick. No pin left to absorb → convex release to target.
The point? Breakouts aren’t wrong, they’re delayed.
Gamma pins are temporary. Vol releases are structural.
Learn to wait for expiry, not fight it.
KBWB eyes on $65.58: Golden Genesis Fib for bulls to BreakKBWB trying to resume uptrend but hit a Golden Genesis fib.
Looking for a Dip-to-Fib below or Break-n-Retest to enter.
There is another relevant fib just above so will be tough.

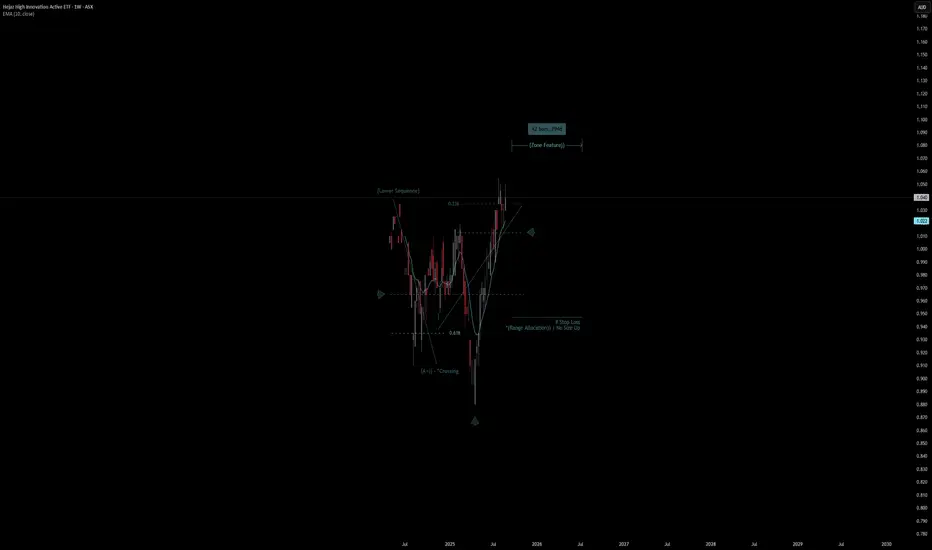
Hejaz High Innovation | Chart & Forecast SummaryKey Indicators On Trade Set Up In General
1. Push Set Up
2. Range Set Up
3. Break & Retest Set Up
Notes On Session
# Hejaz High Innovation
- Double Formation
* (Lower Sequence) Short Entry - *10EMA | Subdivision 1
* (A+)) - *Crossing | No Size Up - *Reversal Area | Completed Survey
* 42bars, 294d | Date Range Method - *(Uptrend Argument))
- Triple Formation
* (P1)) / (P2)) & (P3)) | Subdivision 2
* Weekly Time Frame | Trend Settings Condition | Subdivision 3
- (Hypothesis On Entry Bias)) | Regular Settings
* Stop Loss Feature Varies Regarding To Main Entry And Can Occur Unevenly
- Position On A 1.5RR
* Stop Loss At 0.985 AUD
* Entry At 1.020 AUD
* Take Profit At 1.075 AUD
* (Uptrend Argument)) & No Pattern Confirmation
- Continuation Pattern | Not Valid
- Reversal Pattern | Not Valid
* Ongoing Entry & (Neutral Area))
Active Sessions On Relevant Range & Elemented Probabilities;
European-Session(Upwards) - East Coast-Session(Downwards) - Asian-Session(Ranging)
Conclusion | Trade Plan Execution & Risk Management On Demand;
Overall Consensus | Buy
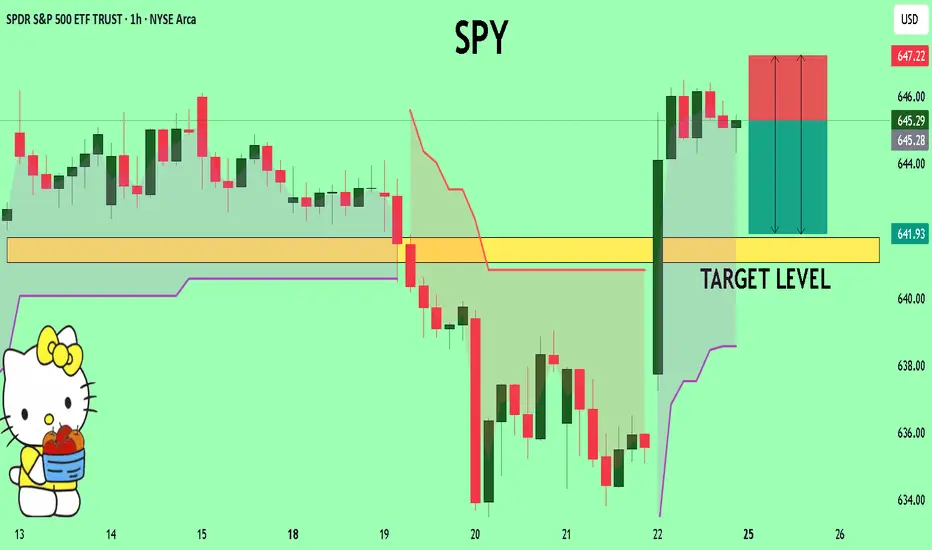
SPY My Opinion! SELL!
My dear subscribers,
My technical analysis for SPYis below:
The price is coiling around a solid key level - 645.29
Bias - Bearish
Technical Indicators: Pivot Points High anticipates a potential price reversal.
Super trend shows a clear sell, giving a perfect indicators' convergence.
Goal - 641.80
My Stop Loss - 647.22
About Used Indicators:
By the very nature of the supertrend indicator, it offers firm support and resistance levels for traders to enter and exit trades. Additionally, it also provides signals for setting stop losses
Disclosure: I am part of Trade Nation's Influencer program and receive a monthly fee for using their TradingView charts in my analysis.
———————————
WISH YOU ALL LUCK