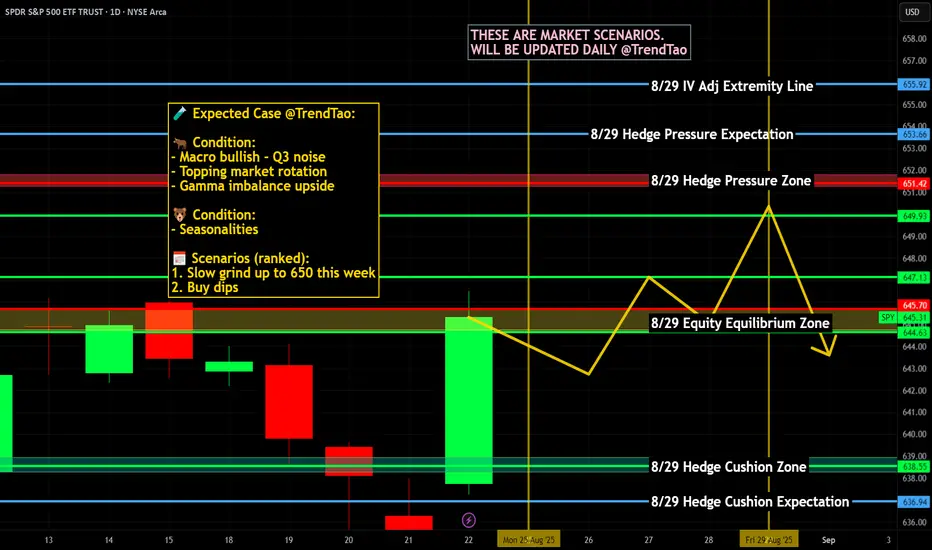
Nightly $SPY / $SPX Scenarios for Tuesday, August 26, 2025🔮 Nightly AMEX:SPY / SP:SPX Scenarios for Tuesday, August 26, 2025 🔮
🌍 Market-Moving Headlines
Post-Jackson Hole digestion 🏔️ → markets recalibrate. Traders continue parsing Powell’s keynote; the path of cuts into September remains the dominant driver for $SPY/$TLT/$DXY.
Durables in focus ✈️📦. Core capital goods orders (non-defense ex-air) are the cleanest read on business investment; softness fuels cut odds, strength = “higher-for-longer.”
Housing affordability squeeze 🏠. Case-Shiller and pending sales provide a 2-sided look at price momentum vs. turnover; AMEX:XHB and AMEX:XLY key tickers.
Consumer mood check 🛒😬. Conference Board Confidence frames labor market sentiment and forward spending intentions.
📊 Key Data Releases & Events (ET)
8:30 AM — Durable Goods Orders (Jul)
Consensus: ~-0.3% headline; core orders expected flat/slightly positive.
Why it matters: Big-ticket spending → business cycle pulse.
9:00 AM — S&P CoreLogic Case-Shiller Home Price Index (Jun)
Prior: +6.0% y/y.
Why it matters: Tracks housing inflation pressure; feeds into consumer wealth effect.
10:00 AM — Conference Board Consumer Confidence (Aug)
Prior: 100.3.
Why it matters: Labor perceptions & spending intentions → AMEX:XLY sentiment.
10:00 AM — Richmond Fed Manufacturing Survey (Aug)
Regional check on factory activity; complements durables.
10:00 AM — Pending Home Sales (Jul)
Prior: -4.1% m/m.
Why it matters: Leading indicator of housing turnover; affordability squeeze.
⚠️ Disclaimer: Educational/informational only — not financial advice.
📌 #trading #stockmarket #SPY #SPX #durablegoods #housing #consumerconfidence #Fed #DXY #TLT
ETF market
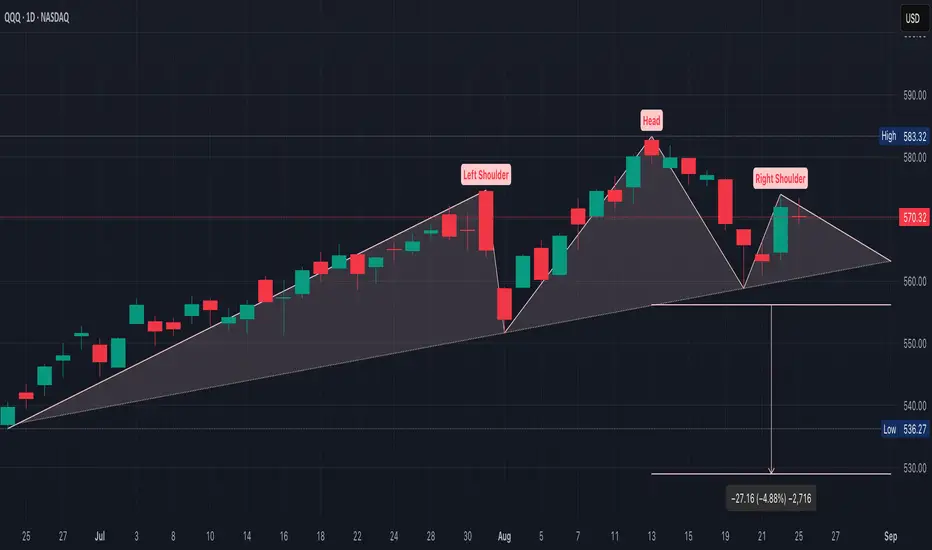
QQQ Volatility Squeeze Ahead?A decisive break & close below $556 would confirm this bearish move,
$532–$529
Head at ~$583
Neckline at ~$556 sloping upward which tends to delay confirmation, but breakdowns can be sharper if they do occur
(Head - Neckline) = ~27 points, so the measured move is ~$556 – $27 = ~$529
If QQQ closes back above $575, the right shoulder fails & we see continuation of the uptrend
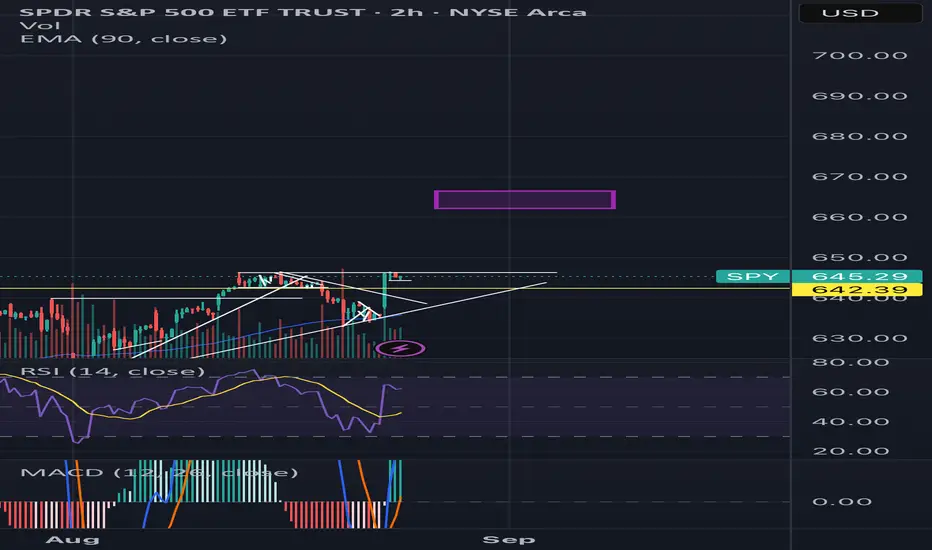
SPY Bullish Ascending TrianglePlanning to catch this before break above top line. Ideally we get a retest of lows within structure for best entry. Don’t want to miss this one.
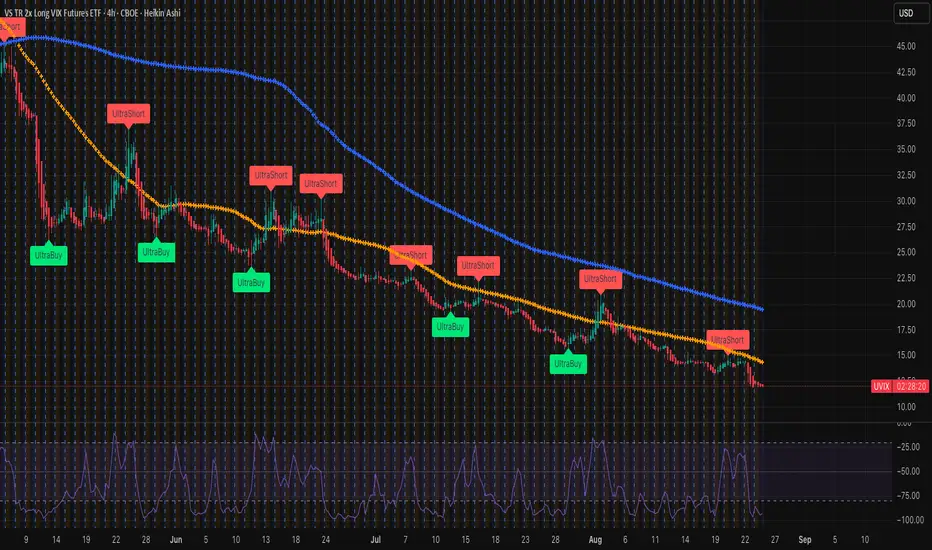
Soon she will grow like a tree....UVIX (VIX proxy)Don't underestimate the VIX spike (UVIX is highly correlated), which has been sitting at a ONE YEAR low, which is extremely rare - only in times when a massive correction is about to happen! Frame this post bc historically VIX doesn't sit around 15 for too long (over 30 years). A major jump is unraveling and AI bubble will burst. Japan's long term interest rates are exploding and the Fed's short term rate cut cannot stop it since it's based on market demand / supply.
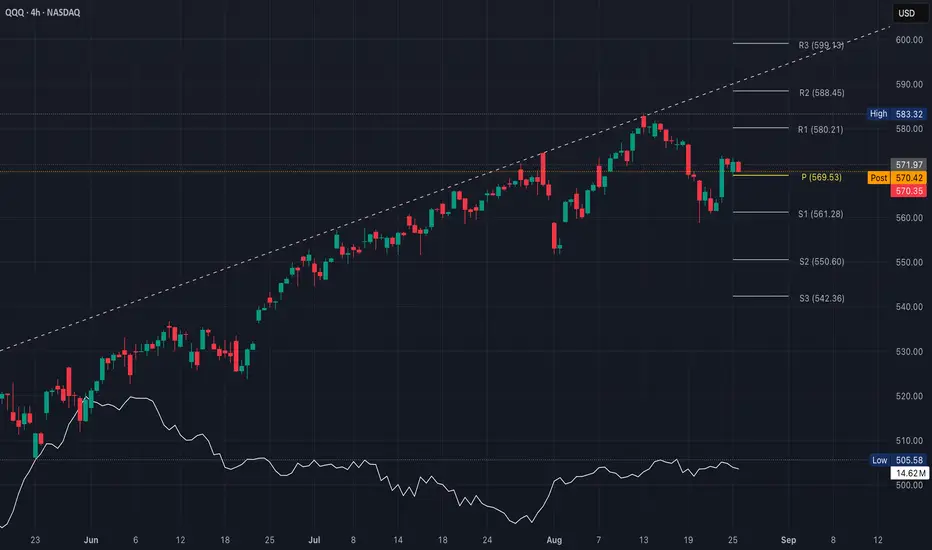
QQQ Binary Setup Around PivotBias slightly bullish as long as $570 holds, but QQQ has been fading end of day, so morning strength needs confirmation
If QQQ holds above 5$70 pre-market/first hour, risk/reward favors calls
If QQQ loses $569 pivot with volume, momentum shifts down
Whichever side wins $569/$570 will likely carry the session
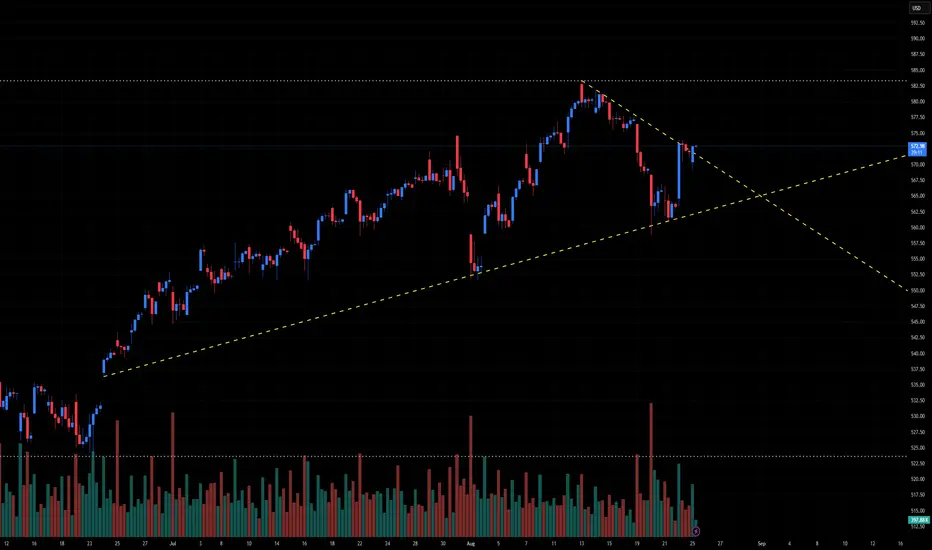
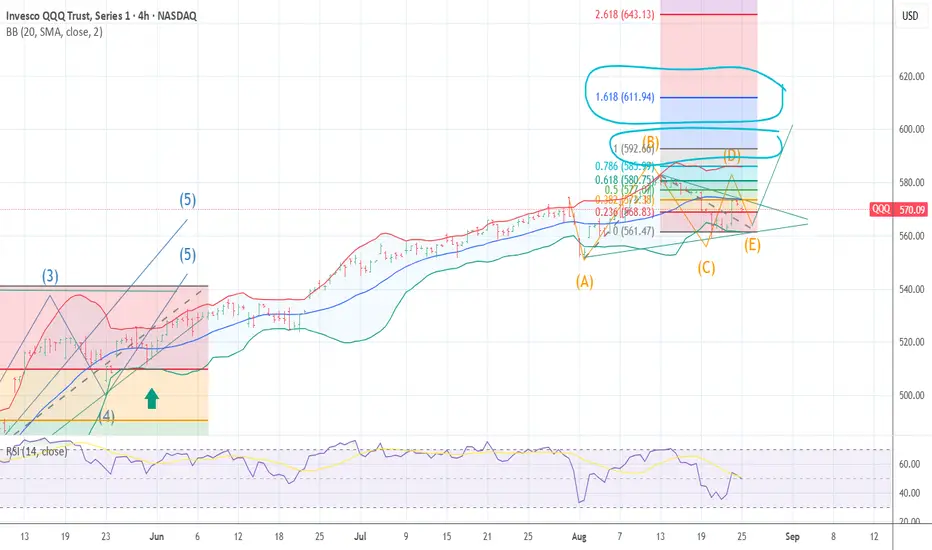
QQQ Technical Outlook – Symmetrical Triangle After Pullback📊 QQQ Technical Outlook – Symmetrical Triangle After Pullback
Ticker: QQQ (Invesco Nasdaq-100 ETF)
Timeframe: 30-minute candles
🔍 Current Setup
QQQ has been in a strong uptrend since June, peaking around ~582 before pulling back. Price is now consolidating into a symmetrical triangle, with:
Descending resistance: from ~582 down toward current ~572.
Ascending support: from June lows, now near 563–565.
Current price: ~572, sitting right near the apex.
This structure suggests compression ahead of a breakout move.
📊 Breakout Levels
🚀 Upside (Bullish Scenario)
Trigger: Break and close above 575–577.
Intermediate Targets:
582–585 → Prior highs.
590 → Extension zone.
Measured Move Target: ~600 (triangle height projection).
🔻 Downside (Bearish Scenario)
Trigger: Break below 565, with confirmation under 563.
Intermediate Supports:
555–552 → First demand zone.
540–542 → Stronger support.
Measured Move Target: ~545 (triangle height projection downward).
📈 Volume Analysis
Volume has contracted during this triangle — classic consolidation behavior.
Expect a volume expansion to confirm the breakout direction.
⚖️ Probability Bias
The trend into the pattern was bullish, favoring continuation higher.
Still, failure to defend 565 could quickly open downside risk toward 552–545.
✅ Takeaway
QQQ is at a major decision point inside a symmetrical triangle:
Bullish Break > 577: Targets 582 → 590 → 600
Bearish Break < 565: Targets 555 → 545
SPY: Are the Bears Preparing for Winter?Greetings again, fellow travelers.
Once more, I am not here to offer a crystal ball, but simply to share the patterns I observe and the story they seem to be telling. This is one perspective, a single lens through which to view the market's vast landscape. Take what serves you on your own path.
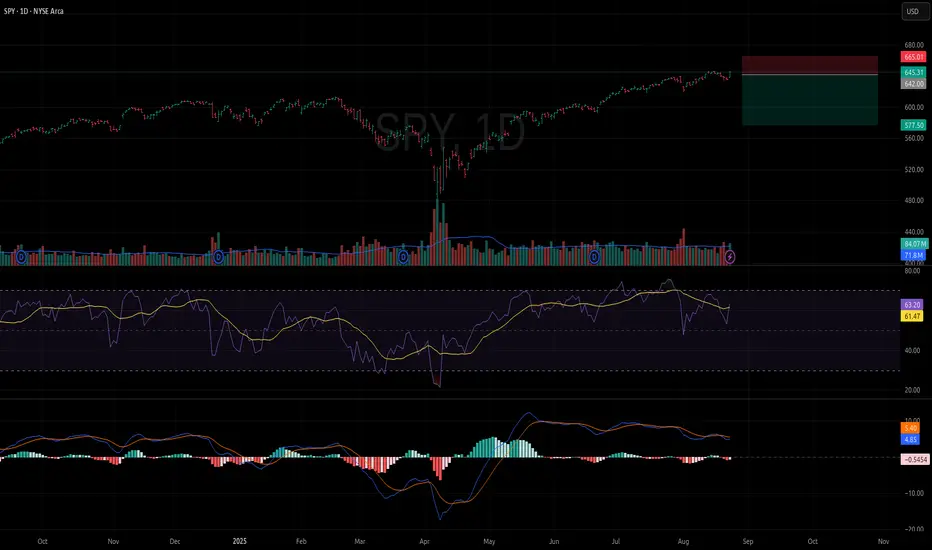
SPY: Are the Bears Preparing for Winter?
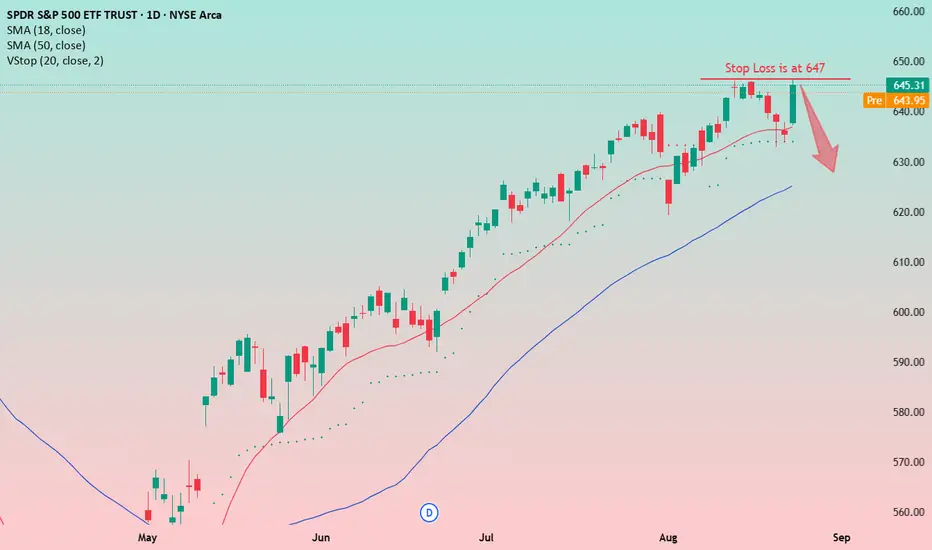
The narrative for SPY feels similar to the broader market: a moment of pause and potential reversal after a strong run. However, the winds here feel a bit colder. Recent commentary from Jerome Powell suggesting the economy may be more fragile than it appears, coupled with the ongoing tariff situation, provides a fundamental backdrop that warrants extra caution.
It feels like the seasons are changing. The bear claws seem sharp, and as we approach the colder months, they may need to fatten up before hibernation. This is a time when they can be voracious, so we must navigate with awareness and respect for their power.
The Technical Story on the Daily Chart
The chart itself reflects this cautious sentiment:
Fading Momentum: Just as we saw elsewhere, the momentum indicators in the lower panel are showing signs of exhaustion. The energy that propelled this last move up is beginning to wane, suggesting the path of least resistance may soon be shifting downwards.
Market Structure: Price is hovering at a level where it has previously met resistance. A failure to push decisively higher here could invite sellers to step in with more confidence.
Potential Pullback Zones: If sellers do take control, I see two primary areas of interest below:
The first key support level is around the $577.50 mark, which represents a previous market structure break (MSB).
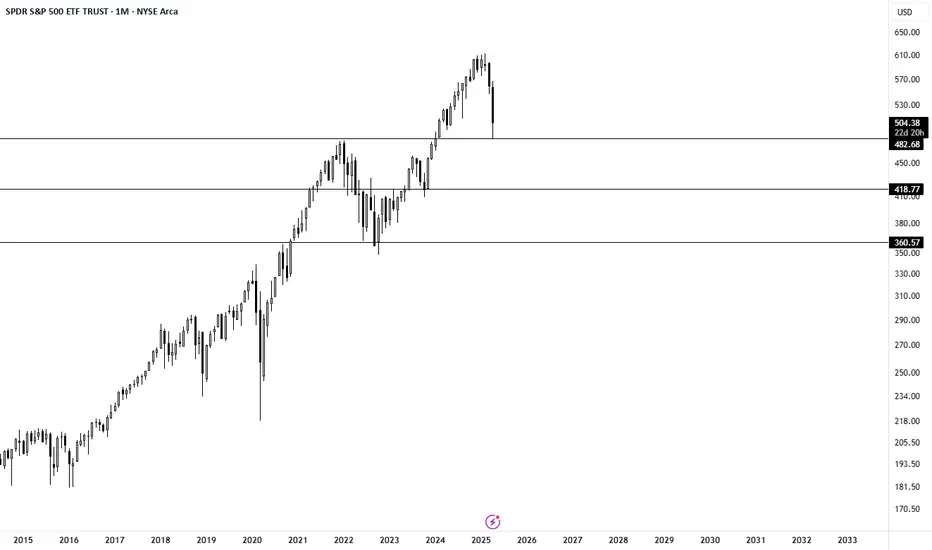
Below that, a larger demand zone sits between $510-$530 , where longer-term buyers might be waiting.
An Illustrative Short Setup
For those whose plan aligns with this cautious view, the current price offers a quality risk/reward setup based on the updated parameters.
Bias: Short-Term Bearish
Entry: Around $642.00
Stop Loss: A clearly defined stop above the recent price action at ~$665.01 protects against a change in the narrative.
Take Profit: Targeting the support level at ~$577.50 . The Risk/Reward for this specific idea is approximately 1:2.8 .
Navigating the River
This potential downturn is not something to fear, but something to understand. It is a cycle. For those who are patient, it could present a fantastic "buy the dip" opportunity later on. The key is not to fight the current.
Don't be a salmon. A salmon fights with all its might to swim upstream, and while noble, it often ends in exhaustion and peril. Right now, the river's current feels bearish. It is wiser to be a leaf, flowing with it, observing from the bank, and waiting for the stream to calm before entering again.
This is my piece of the puzzle. I hope it helps.
Just shine.
Disclaimer: This is not financial advice. It is for educational and informational purposes only. Please conduct your own research and manage your risk accordingly.
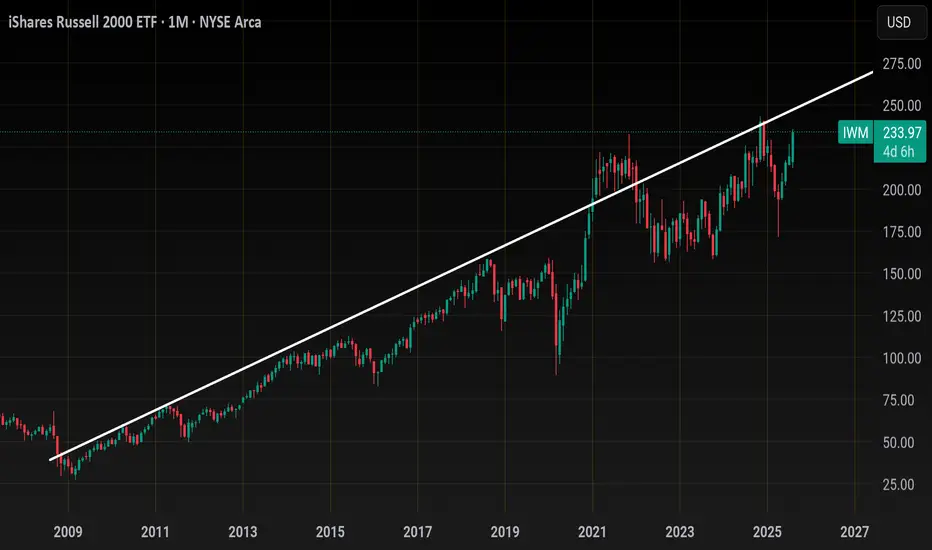
IWM Looks like 240 is incoming, most likely this move comes with a cool Core PCE this Friday and if not then, then most likely on next month job numbers .
Weekly trendline resistance from 2010 has resistance at around 240ish.
That's only another 3% upside
In an extreme move we could see price momentarily push above 240 and tag 245
From 245 I can't see price heading higher going into Seasonality of Sept.. so I'd be looking for a top signal above 240 and a correction from there to 210.00
Here's the price action from April lows..
Simple channel..
I don't think we tag support again until 240 is tested, we could just grind mid channel all the way back to ATH like that Green circle of price I highlighted.. let's see if we get more of a dip towards 230-232 before Friday's core pce , IMO that would be the entry for a final leg up.
SPY OptionsThere is a possibilty to get from this point 644 to 658 needs to brake 646 to go higher, AI earings can trigger a big movement in the other hand 644 to 629 if the earing are negative
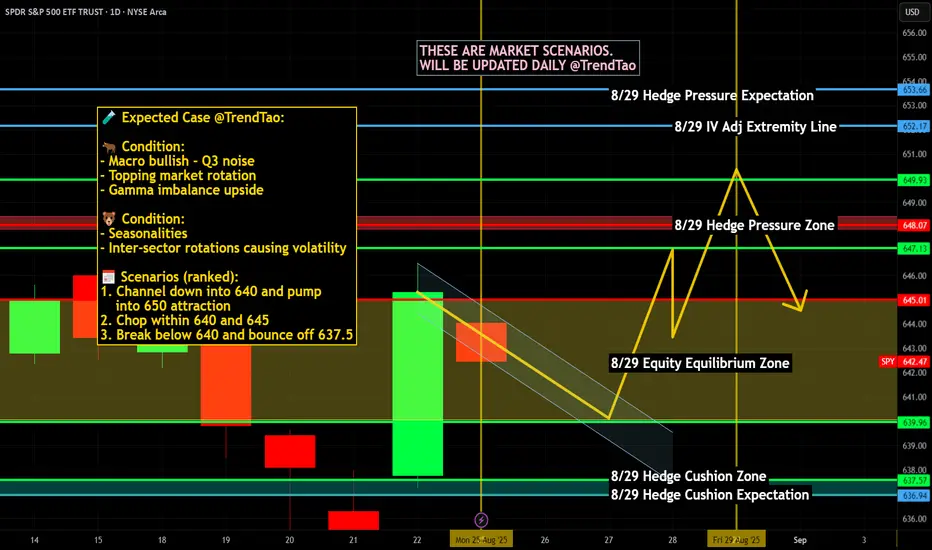
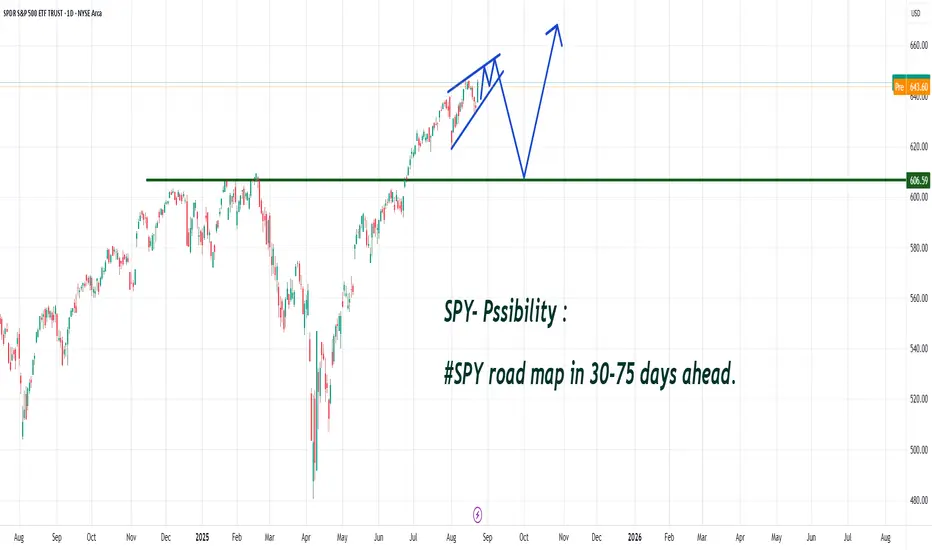
#SPY road map in 30-75 days ahead.Based on my analysis, the market, especially the #SPY road map, will likely be seen in 30-75 days.
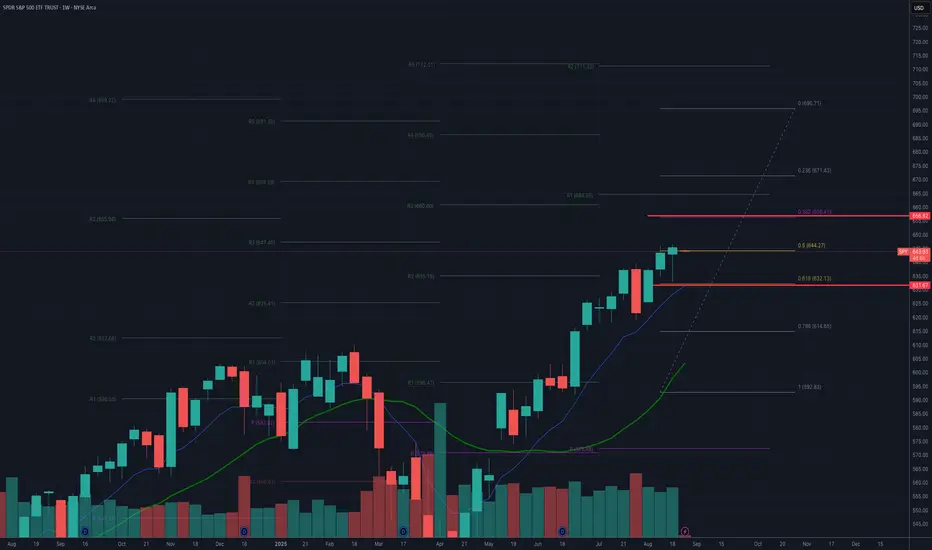
Bearish OutlookThe market reaction to Powell’s speech, in which the potential rate cut by the Fed in September was essentially confirmed, led to a rise. However, what’s encouraging is that the previous peak wasn’t broken.
This is a good sign for a short.
Just to remind, I have a rather bearish view on the broader market in the medium-term (on a 1-year horizon).
And perhaps the moment has come.
Maybe it's not yet the time for a big short, but we could certainly head toward the 630 area.
📝Trading Plan
🟢Entry: Short from the current level
🔴Stop: 647. If we go above the historical maximum, I’ll exit, and the idea will be off. I’ll look for another entry point for a short.
🎯Target: The potential downside is to 630, maybe even lower—let's see. For now, this is the plan.
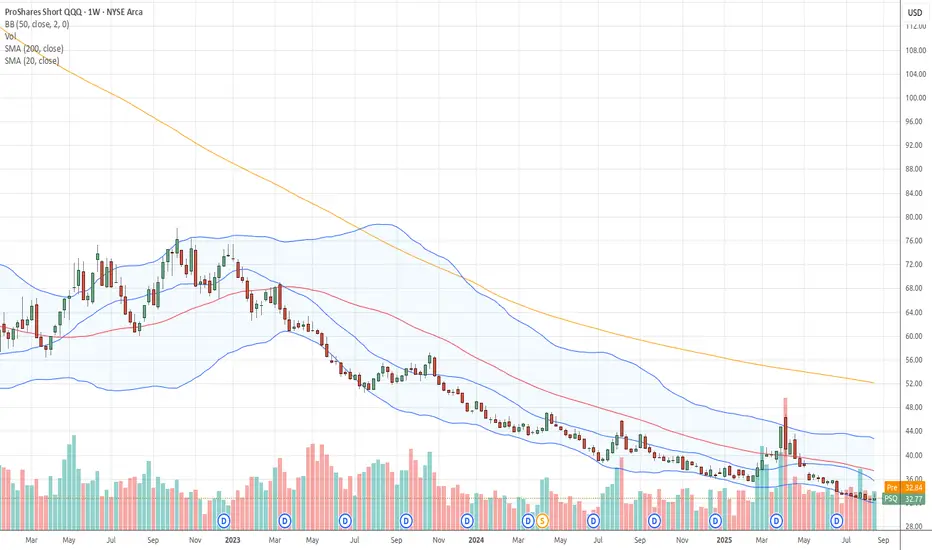
$PSQ Tradespoon – Long Entry $33.27Tradespoon model generated long signal for ProShares Short QQQ AMEX:PSQ . Predicted range: $33.13–$33.62. Trend: +0.37%. AMEX:PSQ
Market Outlook and SetupsHope everyone had a good week swing trading. Things are still on the bullish side. Any new position should be light at this level. Got a jam packed video with new setups going into this week. Take partial profits as soon as you can. I like to use the 1.5 ATR as my Take Profit zone.

buy the dippity dip of the dipTechnically, charts are near previous highs from 2021-22,
As the great investooore ser unlimited meals buffett said
"if you eat when others are hungry, you will get fat. but if you starve when others are eating you will get all the chix."
its just a correction, not a recession .
buy the dip fm
Weekly $SPY / $SPX Scenarios for August 25 – 29, 2025🔮 Weekly AMEX:SPY / SP:SPX Scenarios for August 25 – 29, 2025 🔮
🌍 Market-Moving Themes
Jackson Hole aftermath 🏔️
Powell’s Friday keynote sets the tone. Markets will trade on whether he opened the door to a September cut or stuck to a cautious stance. Expect chop in AMEX:SPY , NASDAQ:TLT , TVC:DXY as traders recalibrate.
Inflation & Jobs 🔥💼
Fresh PCE inflation and jobless claims anchor the week. Any upside surprise revives “higher-for-longer”; softness = fuel for cut odds.
Retail earnings wrap 🛒
With $WMT/$TGT/ NYSE:HD behind us, discounters and specialty retailers close the season. AMEX:XRT stays a barometer of consumer resilience.
Housing & confidence 🏠📉
Pending Home Sales + Conference Board Confidence will test sentiment in an affordability squeeze backdrop. Watch AMEX:XHB , $XLY.
📊 Key Data & Events (ET)
📅 Monday, Aug 25
Chicago Fed National Activity Index (8:30 AM) – broad growth pulse.
Dallas Fed Manufacturing Survey (10:30 AM) – regional check.
📅 Tuesday, Aug 26
Durable Goods Orders (8:30 AM) – capex signal; core ex-transport key.
Richmond Fed Manufacturing Survey (10:00 AM) – factory health in Mid-Atlantic.
S&P CoreLogic Case-Shiller Home Price Index (9:00 AM) – housing momentum.
Conference Board Consumer Confidence (10:00 AM) – labor intentions, rate sentiment.
📅 Wednesday, Aug 27
MBA Mortgage Applications (7:00 AM) – weekly mortgage pulse.
Advance Economic Indicators (8:30 AM) – trade, inventories, wholesale.
Pending Home Sales (10:00 AM) – affordability and turnover test.
Crude Oil Inventories (10:30 AM) – $CL_F/ AMEX:XLE driver.
📅 Thursday, Aug 28
Initial Jobless Claims (8:30 AM) – labor cooling watch.
GDP (2nd Estimate, Q2) (8:30 AM) – growth momentum, revisions matter.
Kansas City Fed Manufacturing Index (11:00 AM) – regional survey.
📅 Friday, Aug 29
PCE Price Index (Jul, 8:30 AM) – Fed’s preferred inflation gauge.
Personal Income & Outlays (8:30 AM) – consumer demand and savings rates.
Chicago PMI (9:45 AM) – manufacturing signal ahead of ISM next week.
UMich Consumer Sentiment (Final, 10:00 AM) – inflation expectations track.
⚠️ Disclaimer: Educational/informational only — not financial advice.
📌 #trading #stockmarket #economy #SPY #SPX #Fed #PCE #GDP #Housing #Confidence #Energy #Bonds #Dollar
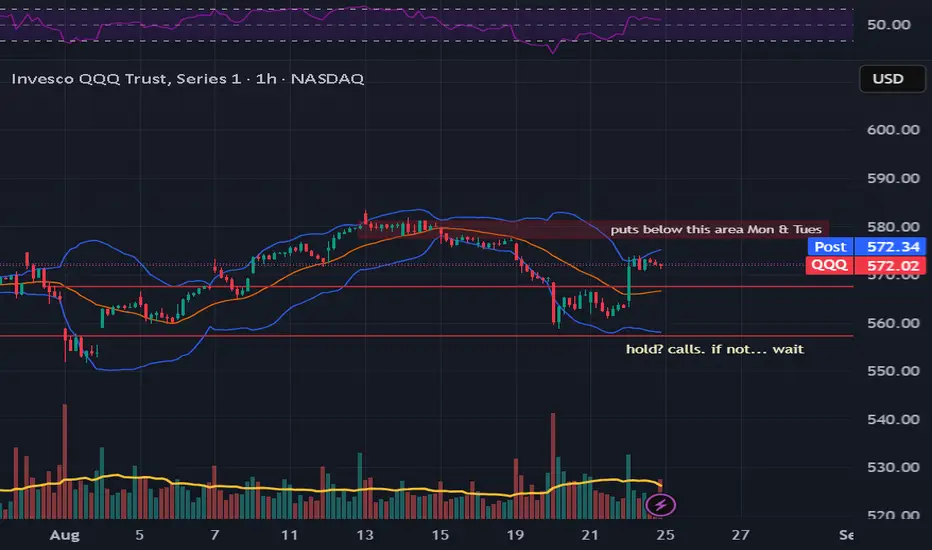
QQQ day & hr reviewWatch these new soft lows. Lower Highs.
Hr chart shows a band to band play within the BB... nice.
Day reflects double wicks w/ HL... bullish. The close was a bit of a rejection... makes sense as the BB are right there. Let's see if we pullback Mon/Tues of next week.
*NVDA & BABA earnings next week. Will be watching....
Have a great weekend. What do you see?
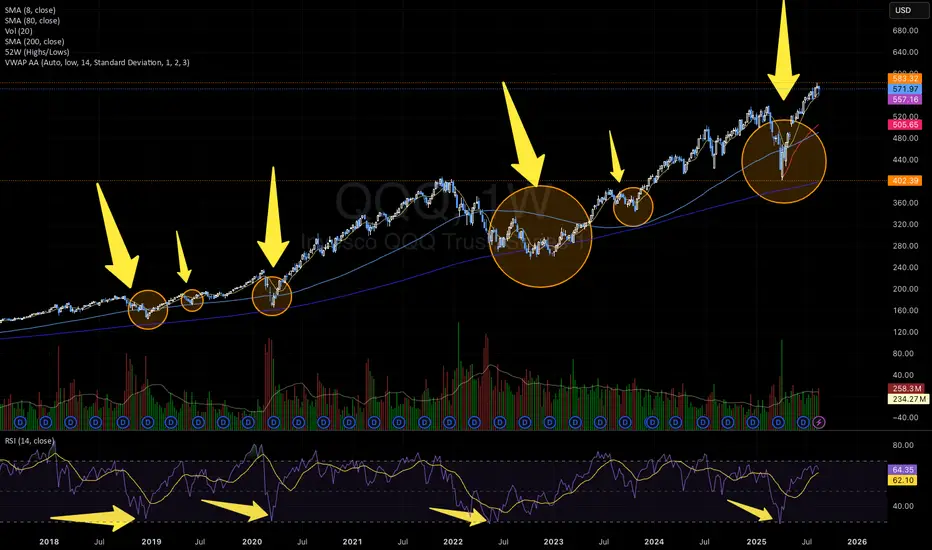
Bullish Pattern: V-Shape + Shakeout with Strong RSI SignalOn the QQQ weekly chart, a recurring bullish pattern has emerged multiple times over the last years:
1) V-shape recoveries followed by Cup & Handle formations and then a shakeout, all of which preceded powerful upside moves (highlighted with arrows and circles).
2) Each time the weekly RSI touched the 30 zone , it triggered a strong bullish rally. This happened three times in the past (2018, 2020, 2022) and just occurred again in March/April 2025.
3) Both times the Cup & Handle pattern formed, the RSI found support around the 45 level.
This suggests that QQQ may be setting up for another bullish leg if history repeats itself.
📊 Key Takeaways:
Weekly RSI bouncing from oversold (30 zone)
Recurrent V-Shape + Cup & Handle + Shakeout bullish pattern
Strong rallies historically followed this setup
⚠️ Not financial advice — purely a technical pattern study.
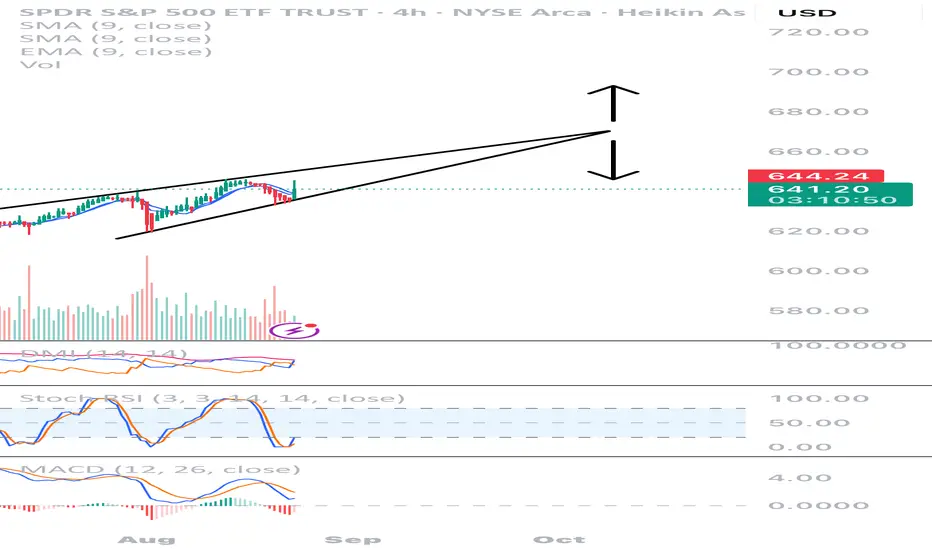
The SPY is continuing upward…The SPY is continuing upward. I have the target as being around Oct. 9th.
There will be a few reports coming out that day including jobless claims, etc. But the market can always exit the triangle prior to the expected date usually around 2/3 to the tip of the triangle.
I suspect it will move lower in October but I will wait and see where the indicators are to make that judgement. As of right now, I have indicated both an up or downward movement.
I have posted the 4 hour chart as you can see the market is already bullish on the 4 hour chart but not the daily chart (just yet)
As I have said in my previous charts, I am a technical trader but I believe fundamentals drive the market.
I used the Heikin Ashi candles:
1: They show more of a directional movement.
2: They tend to filter out the market noise, so you can see the direction better.
3: it reduces false signals, allowing you to stay in the trade longer.
4: And it also gives a smoother appearance making it easier to see the trends and reversals.
Trade at your own risk, make sure you have stops in place and only use 10% of your trading account, so that if you are wrong, you will not blow up your account.
Happy trading!
(I am drawing this on my phone so I got to be quick! LOL!)
How to Filter for Trading CandidatesIntroduction
This post explores how to filter tradable assets using structural and behavioral criteria. While the examples focus on swing trading stocks, the same principles apply across other markets.
A structured selection process helps refine the list of candidates and supports a more consistent approach. The use of filters can reduce the universe of stocks to those that fit the chosen method. For example, in momentum trading, the purpose is to find stocks that have already shown strong movement and may offer continuation opportunities.
There are multiple approaches to selection. This chapter focuses on two practical methods: scan-based filtering and a top-down approach.
Foundational Filters
These basic criteria can be applied across all scans and serve to exclude assets that are illiquid or incompatible with standard execution. The specific thresholds used may depend on personal account size, capital allocation and trading style. This guide focuses on swing trading, where moderate liquidity and price stability are important to ensure consistent fills and manageable risk.
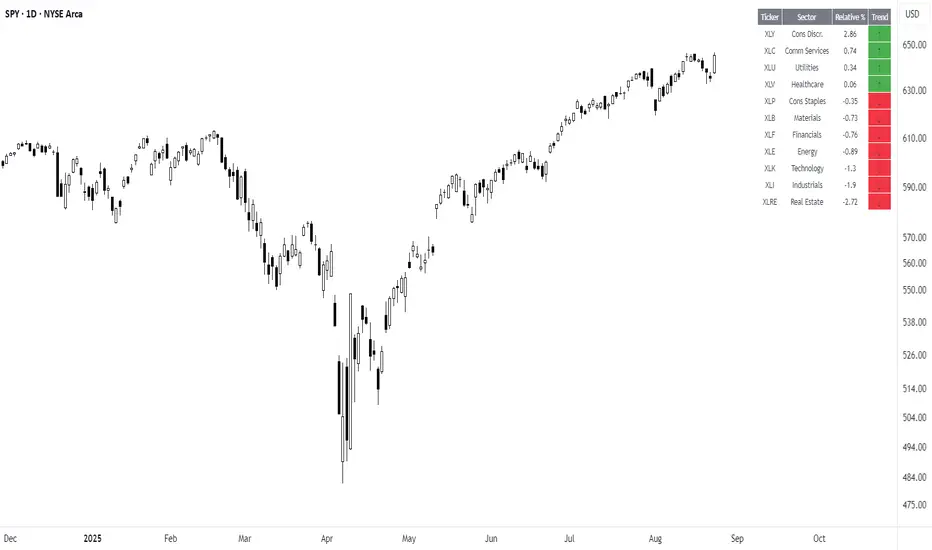
The Sector Relative Strength tool can help show leading sectors versus the S&P 500 Index over the longer term. This optional top-down approach highlights which areas of the market are outperforming and can support manual refinement.
Setup-Based Filters
These examples demonstrate criteria for identifying potential continuation setups following recent momentum. The filters shown are for bullish conditions; for bearish setups, the logic is reversed. For other approaches, such as fading, filters based on excursion/overextension would be applied instead.
Use the Momentum Tracker to visualize when stocks historically met each of these criteria. This helps evaluate the behavior that preceded meaningful setups and refine your filters over time.
Optional Refinement Filters
These filters can help focus the scans further and improve candidate quality.
Candidates can also be sorted based on preference. A common method is to sort by recent volatility, such as ATR%, or distance from the mean price to prioritize price retracement or contraction.
Momentum Scan Example
This sample scan uses normalized momentum to identify new highs in price. The method is standardized and adapts well across different markets. In case the number of candidates is extensive, filters can be more restrictive or additional criteria applied to narrow the selection.
Market Context
Market breadth is the equilibrium between the number of stocks in advance to those in a decline, in other words a method to determine the current market environment. In a positive phase, bullish setups will have improved probabilities and presence, whereas in a bearish phase the opposite would be true. There tends to be a correlation in the market, where stocks often move in line with their sector or the broader index. Being aware of where capital is flowing helps align trades with the broader environment. In case one has an effective scan and review process, much of this assessment is implicitly accounted for.
This guide will not cover these in depth, but there are numerous ways to evaluate market context; such as reviewing index or sector performance, market breadth, and monitoring economic or macro events. The most important part is to be consistent and apply discretion within the chosen process.
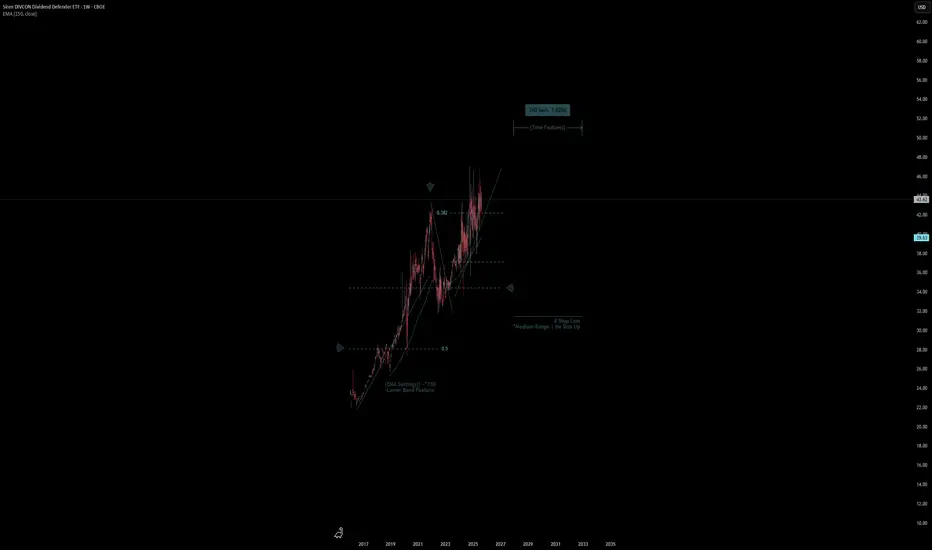
Siren DIVCON | Chart & Forecast SummaryKey Indicators On Trade Set Up In General
1. Push Set Up
2. Range Set Up
3. Break & Retest Set Up
Notes On Session
# Siren DIVCON
- Double Formation
* (EMA Settings)) - Lower Band Feature - *Long Entry - *150EMA | Subdivision 1
* Medium Range | No Size Up | Completed Survey
* 260bars, 1820d | Date Range Method - *(Uptrend Argument))
- Triple Formation
* (P1)) / (P2)) & (P3)) | Subdivision 2
* Weekly Time Frame | Trend Settings Condition | Subdivision 3
- (Hypothesis On Entry Bias)) | Regular Settings
* Stop Loss Feature Varies Regarding To Main Entry And Can Occur Unevenly
- Position On A 1.5RR
* Stop Loss At 36.00 USD
* Entry At 41.00 USD
* Take Profit At 48.00 USD
* (Uptrend Argument)) & No Pattern Confirmation
- Continuation Pattern | Not Valid
- Reversal Pattern | Not Valid
* Ongoing Entry & (Neutral Area))
Active Sessions On Relevant Range & Elemented Probabilities;
European-Session(Upwards) - East Coast-Session(Downwards) - Asian-Session(Ranging)
Conclusion | Trade Plan Execution & Risk Management On Demand;
Overall Consensus | Buy
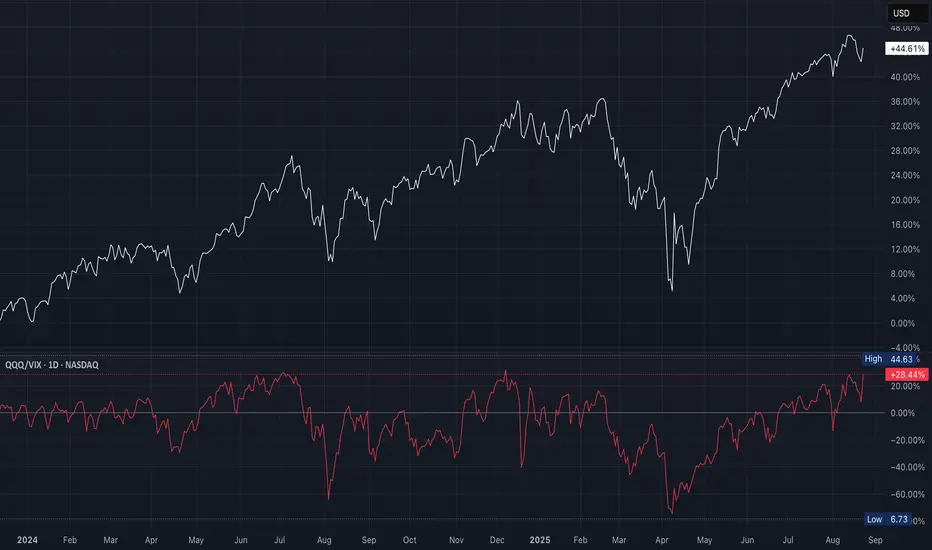
QQQ Fear-Adjusted Momentum GaugeThis is a fear-adjusted momentum gauge
A higher ratio = strong risk appetite (bullish for QQQ)
A lower ratio = stress (bearish for QQQ)
Big rallies in QQQ (January to July 2024 & May to August 2025) coincided with QQQ/VIX trending upward
Price gains were stronger than implied volatility
Whenever QQQ/VIX rolled over (August to October 2024 & January to March 2025), QQQ sold off hard
QQQ price sometimes “lingered flat” at first, but the ratio gave an early risk-off warning
As of late August 2025, the ratio is at +28%, near upper resistance zone where rallies have previously stalled
QQQ price itself is consolidating near highs
If the ratio holds above +20% and pushes higher, this confirms a risk-on continuation
If it rolls back below +20%, this is a warning of correction, even if QQQ is still flat
Ratio rising from neutral (~0%) into +20–40%, which confirms healthy momentum with low fear; however, the ratio is falling while QQQ still up (divergence)
Sharp drops below 0% (volatility leading) indicates strong downside risk
QQQ/VIX is elevated, confirming risk-on, but at a spot where past rallies faded
Suggests short-term cautious bullish bias, but watch for reversal in ratio which would precede a QQQ pullback
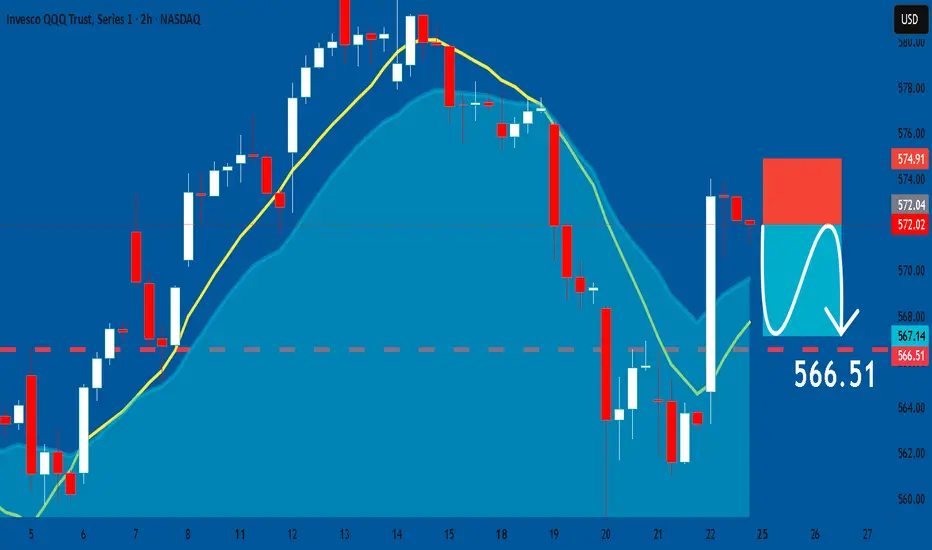
QQQ: Bearish Continuation & Short Signal
QQQ
- Classic bearish setup
- Our team expects bearish continuation
SUGGESTED TRADE:
Swing Trade
Short QQQ
Entry Point - 572.02
Stop Loss - 574.91
Take Profit - 566.51
Our Risk - 1%
Start protection of your profits from lower levels
Disclosure: I am part of Trade Nation's Influencer program and receive a monthly fee for using their TradingView charts in my analysis.
❤️ Please, support our work with like & comment! ❤️