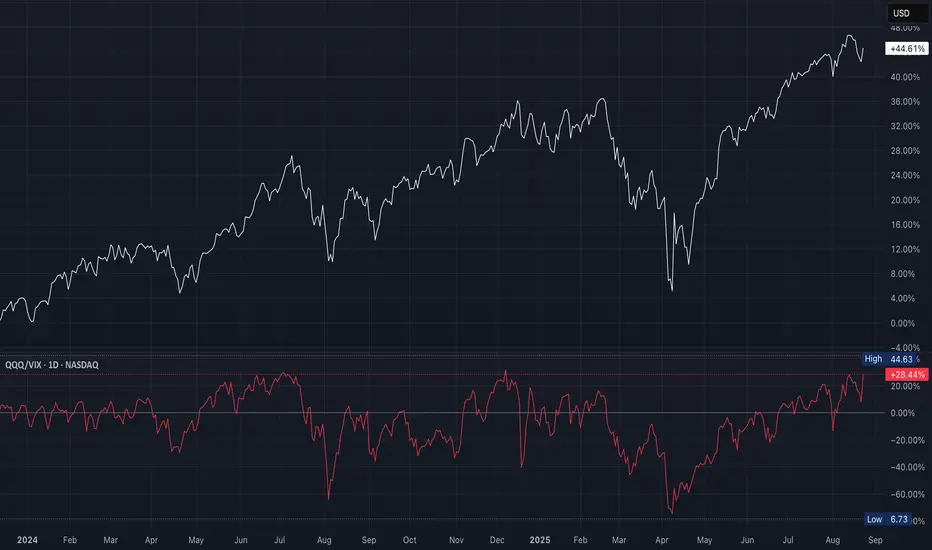
QQQ Fear-Adjusted Momentum GaugeThis is a fear-adjusted momentum gauge
A higher ratio = strong risk appetite (bullish for QQQ)
A lower ratio = stress (bearish for QQQ)
Big rallies in QQQ (January to July 2024 & May to August 2025) coincided with QQQ/VIX trending upward
Price gains were stronger than implied volatility
Whenever QQQ/VIX rolled over (August to October 2024 & January to March 2025), QQQ sold off hard
QQQ price sometimes “lingered flat” at first, but the ratio gave an early risk-off warning
As of late August 2025, the ratio is at +28%, near upper resistance zone where rallies have previously stalled
QQQ price itself is consolidating near highs
If the ratio holds above +20% and pushes higher, this confirms a risk-on continuation
If it rolls back below +20%, this is a warning of correction, even if QQQ is still flat
Ratio rising from neutral (~0%) into +20–40%, which confirms healthy momentum with low fear; however, the ratio is falling while QQQ still up (divergence)
Sharp drops below 0% (volatility leading) indicates strong downside risk
QQQ/VIX is elevated, confirming risk-on, but at a spot where past rallies faded
Suggests short-term cautious bullish bias, but watch for reversal in ratio which would precede a QQQ pullback
ETF market
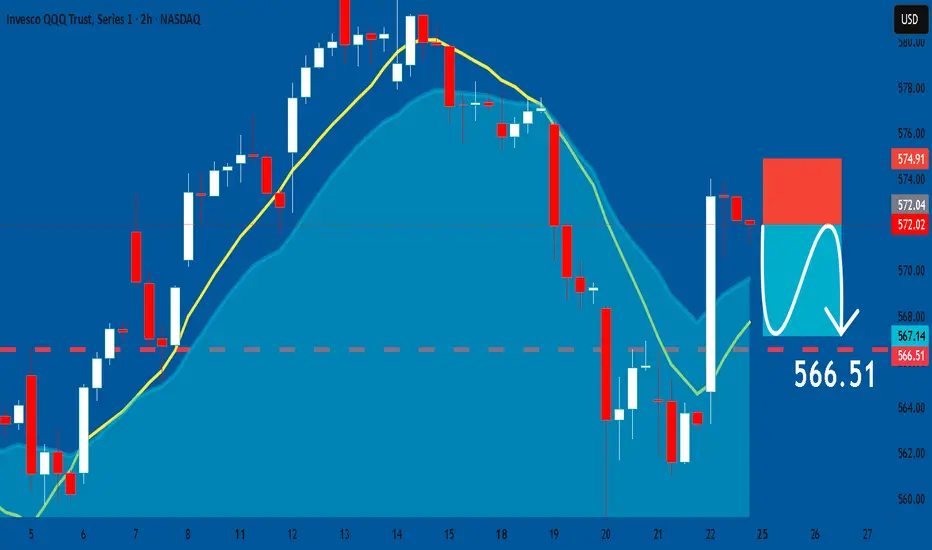
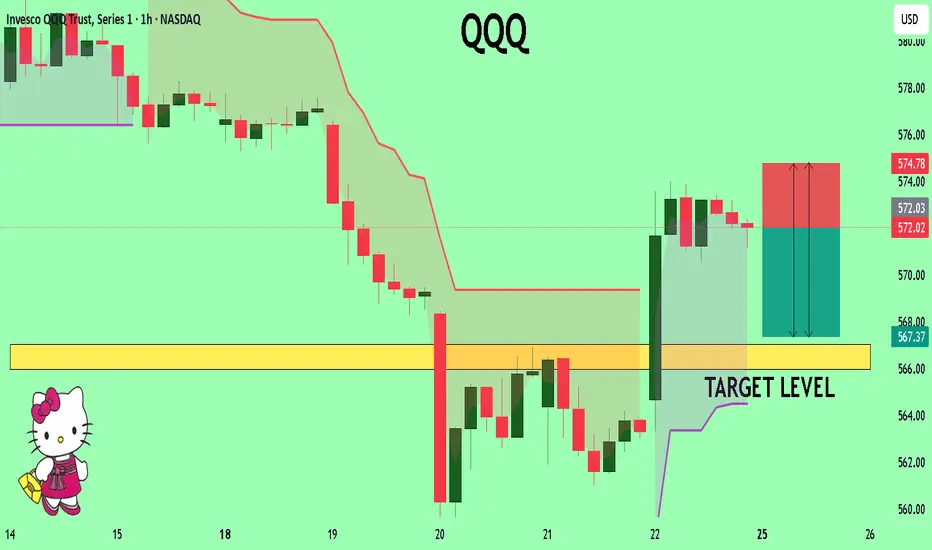
QQQ: Bearish Continuation & Short Signal
QQQ
- Classic bearish setup
- Our team expects bearish continuation
SUGGESTED TRADE:
Swing Trade
Short QQQ
Entry Point - 572.02
Stop Loss - 574.91
Take Profit - 566.51
Our Risk - 1%
Start protection of your profits from lower levels
Disclosure: I am part of Trade Nation's Influencer program and receive a monthly fee for using their TradingView charts in my analysis.
❤️ Please, support our work with like & comment! ❤️
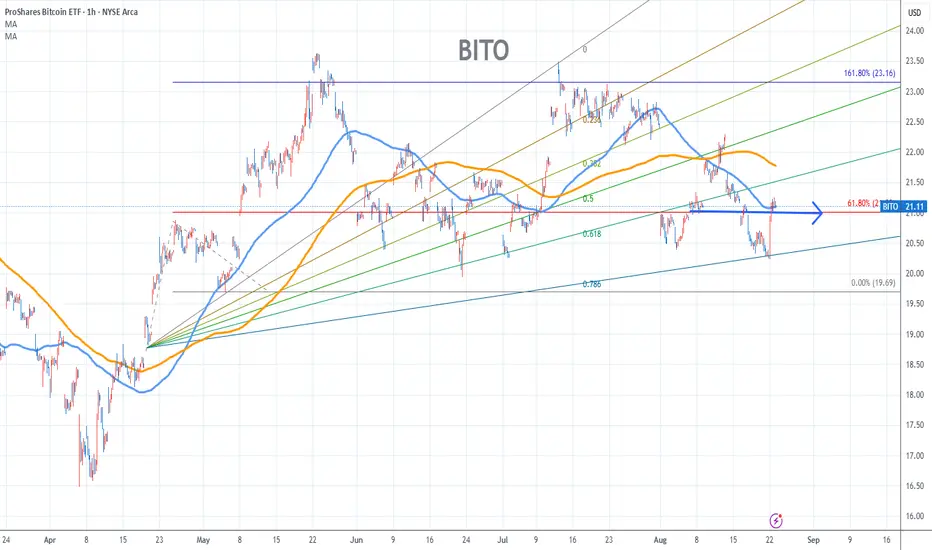
BITO Stock Chart Fibonacci Analysis 082225Trading Idea
1) Find a FIBO slingshot
2) Check FIBO 61.80% level
3) Entry Point > 21/61.80%
Chart time frame:B
A) 15 min(1W-3M)
B) 1 hr(3M-6M)
C) 4 hr(6M-1year)
D) 1 day(1-3years)
Stock progress:C
A) Keep rising over 61.80% resistance
B) 61.80% resistance
C) 61.80% support
D) Hit the bottom
E) Hit the top
Stocks rise as they rise from support and fall from resistance. Our goal is to find a low support point and enter. It can be referred to as buying at the pullback point. The pullback point can be found with a Fibonacci extension of 61.80%. This is a step to find entry level. 1) Find a triangle (Fibonacci Speed Fan Line) that connects the high (resistance) and low (support) points of the stock in progress, where it is continuously expressed as a Slingshot, 2) and create a Fibonacci extension level for the first rising wave from the start point of slingshot pattern.
When the current price goes over 61.80% level , that can be a good entry point, especially if the SMA 100 and 200 curves are gathered together at 61.80%, it is a very good entry point.
As a great help, tradingview provides these Fibonacci speed fan lines and extension levels with ease. So if you use the Fibonacci fan line, the extension level, and the SMA 100/200 curve well, you can find an entry point for the stock market. At least you have to enter at this low point to avoid trading failure, and if you are skilled at entering this low point, with fibonacci6180 technique, your reading skill to chart will be greatly improved.
If you want to do day trading, please set the time frame to 5 minutes or 15 minutes, and you will see many of the low point of rising stocks.
If you want to prefer long term range trading, you can set the time frame to 1 hr or 1 day
Is Fridays Bounce a Bull Trap?CME_MINI:NQ1! CME_MINI:ES1! stock market Forecast
Nvidia Stock NASDAQ:NVDA Forecast
Apple Stock NASDAQ:AAPL Forecast
Microsoft Stock MSFT Forecast
Google Stock GOOGL Forecast
Amazon Stock AMZN Forecast
Meta Forecast Technical Analysis
Tesla Stock TSLA Forecast
Magnificent 7 stocks forecast

QQQ The Target Is DOWN! SELL!
My dear subscribers,
My technical analysis for QQQ is below:
The price is coiling around a solid key level - 572.02
Bias - Bearish
Technical Indicators: Pivot Points Low anticipates a potential price reversal.
Super trend shows a clear sell, giving a perfect indicators' convergence.
Goal - 567.03
My Stop Loss - 574.78
About Used Indicators:
By the very nature of the supertrend indicator, it offers firm support and resistance levels for traders to enter and exit trades. Additionally, it also provides signals for setting stop losses
Disclosure: I am part of Trade Nation's Influencer program and receive a monthly fee for using their TradingView charts in my analysis.
———————————
WISH YOU ALL LUCK
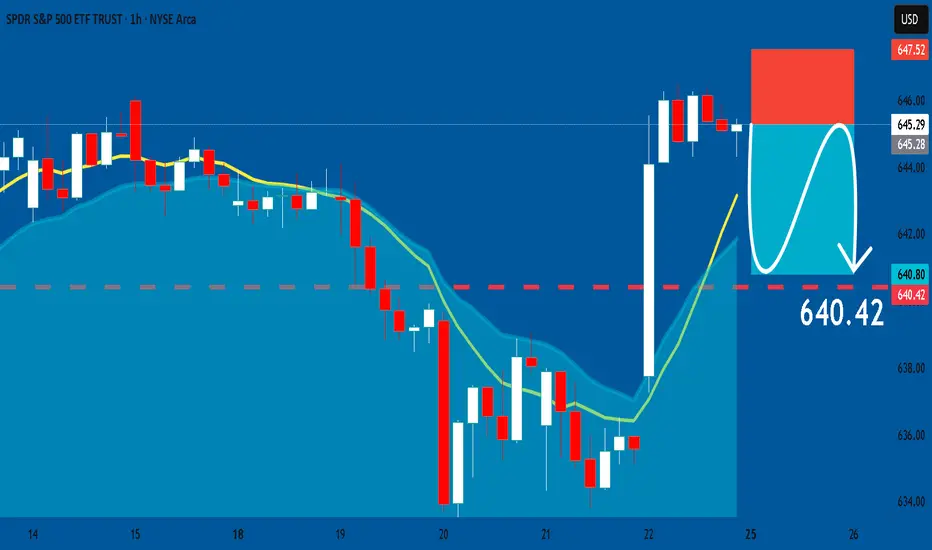
SPY: Short Trade Explained
SPY
- Classic bearish formation
- Our team expects pullback
SUGGESTED TRADE:
Swing Trade
Short SPY
Entry - 645.29
Sl - 647.52
Tp - 640.42
Our Risk - 1%
Start protection of your profits from lower levels
Disclosure: I am part of Trade Nation's Influencer program and receive a monthly fee for using their TradingView charts in my analysis.
❤️ Please, support our work with like & comment! ❤️
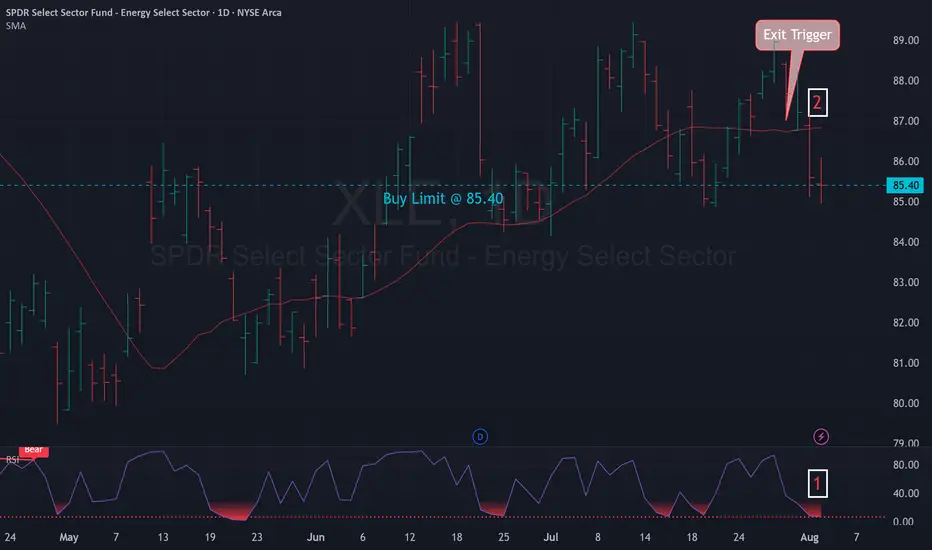
Mean Reversion Trade: XLE1. RSI in oversold region
2. Price likely to rebound back the the mean
Trade Rules:
Entry Trigger - RSI has cross below oversold region, enter limit buy at close price
Exit Trigger - Close at market when close price cross above exit trigger (Red line)
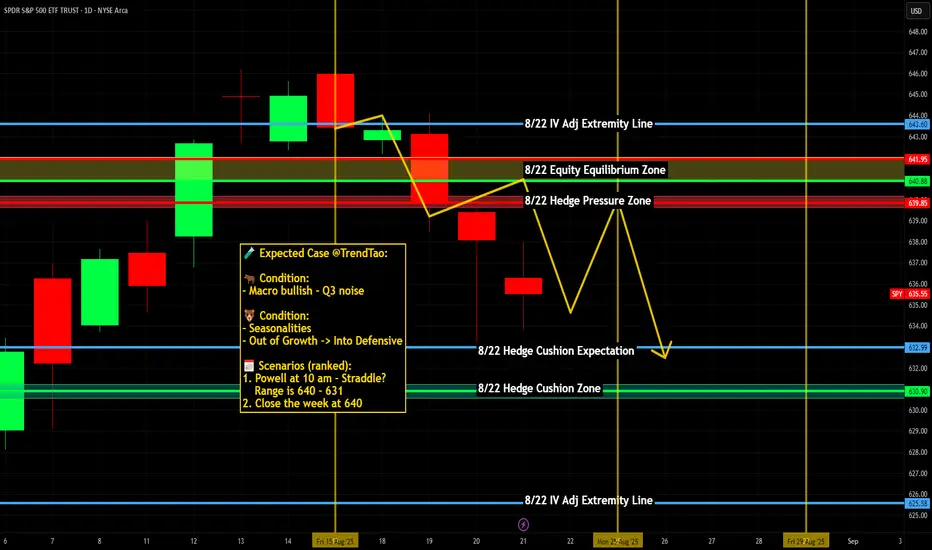
QQQ (22 August)Monday is binary
If momentum pushes through $575 early, calls can run toward $580–$583 quickly
$575 is a decision point - break & run to $583, or fade back to $568
Powell hint already absorbed so the next big movers include economic data mid-week (jobs, inflation reads) & tech leadership (NVDA moves will matter)
SPY/QQQ Plan Your Trade Update For 8-22 : Is This The Top?This is a follow-up to my recent video to help answer questions and to share my analysis of the SPY/QQQ, Gold/Silver, and Bitcoin for all viewers.
This video also addresses the tools I use to stay on top of the swings in price movement and highlights why I believe the markets may continue to unwind from these lofty highs.
Get some.
#trading #research #investing #tradingalgos #tradingsignals #cycles #fibonacci #elliotwave #modelingsystems #stocks #bitcoin #btcusd #cryptos #spy #gold #nq #investing #trading #spytrading #spymarket #tradingmarket #stockmarket #silver

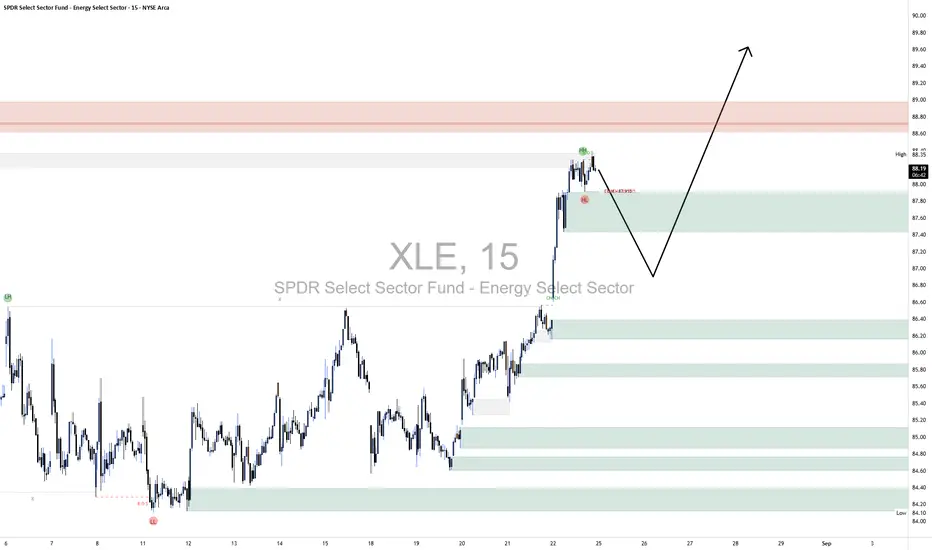
XLE LongOn the XLE 15-minute chart, the broader market structure is firmly bullish. Price has been making consistent higher highs and higher lows, and most recently broke structure above 88.00, confirming continuation to the upside. There has not been a clear Change of Character yet, meaning buyers remain in control, though the current pullback is testing short-term demand. This structural setup suggests that the move higher is not yet complete, but a deeper retracement could unfold before continuation.
Looking at supply and demand, the most recent supply sits around 88.70–89.00, where price previously dropped sharply, confirming this zone as strong resistance. On the demand side, the nearest support is at 87.40–87.60, a level where buyers previously stepped in aggressively and created the breakout above 88.00. Below that, a secondary demand sits near 86.20–86.40, which also triggered a strong rally, showing that buyers continue to defend higher lows.
Inside the marked region, price is pulling back from local highs just under supply and is now heading toward the 87.40–87.60 demand zone. Momentum has shifted slightly toward sellers in the short-term, but candles remain controlled, suggesting this is a healthy retracement rather than aggressive liquidation. If buyers defend the 87.40 zone, the likely outcome is a bounce that targets 88.70 and potentially breaks into 89.00. If the demand fails, however, price could extend down toward 86.40 before attempting another leg higher.
Trade bias: Bullish
Expected direction: Pullback into demand at 87.40–87.60, then bounce higher toward 89.00
Invalidation level: A clean breakdown below 87.20 would weaken the bullish outlook and favor a deeper retracement into 86.40
Momentum condition: Short-term favors sellers during this retracement, but higher timeframe momentum still aligns with buyers
Price behavior: Current rejection wicks at highs show profit-taking, but no aggressive seller control yet
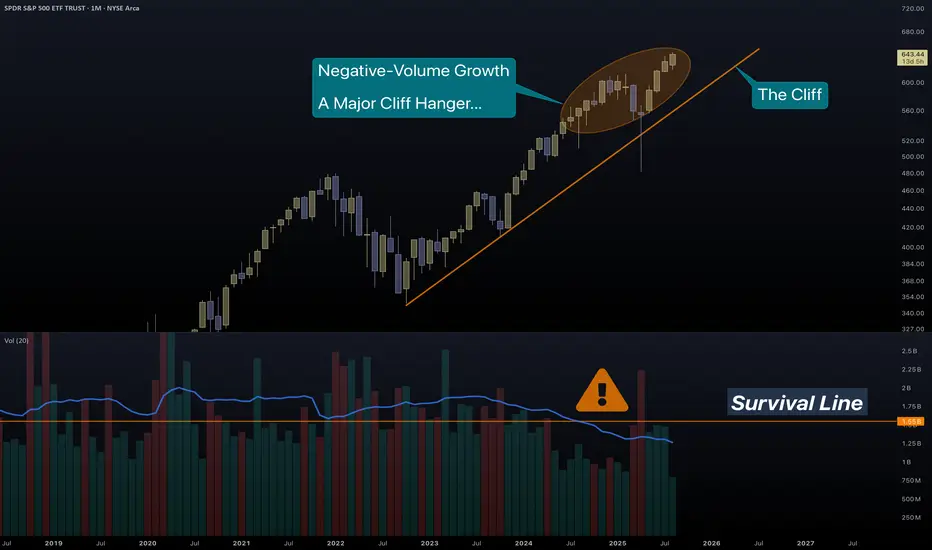
SPY | Leap of Doom?SPY just jumped...
The wrong way up!
To sustain you must conserve. To climb up a hill, you need energy, resources like food and water. The energy they give you far out-weighs their absolute mass. Therefore it makes sense for you to carry them.
And they have taken you very far...
But now you have run out of energy.
Price growth needs transaction volume to have strength and meaning.
You are too light(headed) to realize that moving further up is a dead-end.
THIS IS NOT SOMETHING SMALL.
SPY is one of the largest Funds in the world. A first-ever major violation of volume trend, in such a big index, must not be ignored. Imagine what is happening underneath...
Look at some examples:
NVDA
The most massive of companies, has a multi-year issue with volume.
MSFT
Unlike its first growth, Microsoft has a tremendous loss of strength in volume metrics.
Such long-term drop in volume means that companies offload real stocks for cheap futures .
We witness the same with Bitcoin...
And gold...
Not quite doomed yet, but troublesome still.
TSLA
Tesla with their shiny and financially pointless cars, has made a pointless growth. Just like many stocks as you will soon realize.
AAPL
The masses, even though their name suggests that they have some matter, in reality they don't. 10% of people have 90% of wealth. Investors have long left Apple, leaving the hoard inside to bubble up the dream.
There is more and more proof that the Fab5 (well the Fab500 as we can see from SPY/SPX) are replacing stocks with derivatives. Real money replaced by weapons of mass destruction, just like Warren Buffett said.
Good luck to us all...
PS. Something irrelevant to stocks, but relevant to the fundamentals of investing in AAPL.
Judging by the recent UI decisions, they trapped the users in bubbles and they are unable to see the truth. Brilliantly, they changed the name of soap bubbles to liquid glass. (bubbles are shiny, crystals are rough).
As a long-time Apple user, now not much of an Apple lover, I know quite well the changing philosophy of them. iPhone (and all products) began as a phone for the "smart" ones and ended up the No1 desire for the masses.
After a decade, I have switched to Fedora Silverblue for 90% of my leisure.
GOLD WAVE 5 is setup 4wave has ended ! look for the blowoff wave in 5th targets are posted best of trades Wavetimer
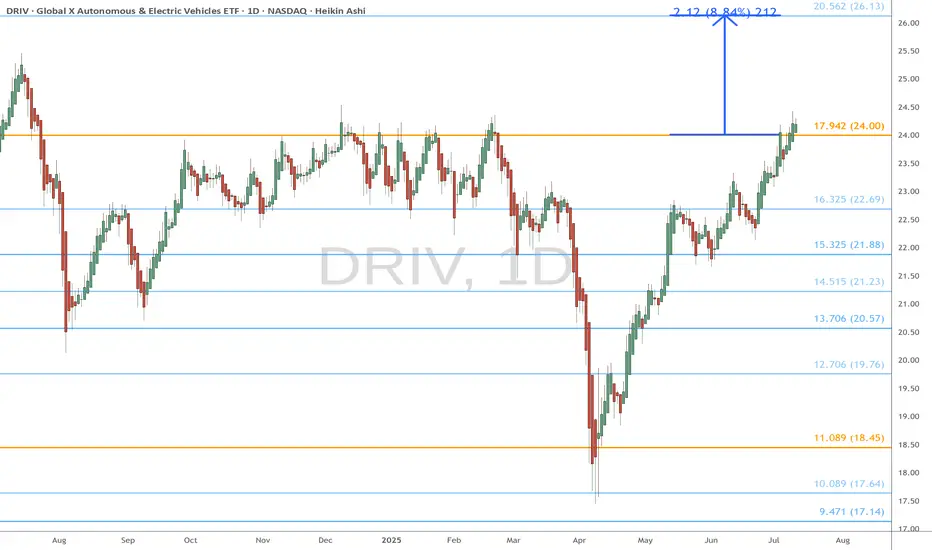
DRIV eyes on $24.00: Golden Genesis fib holding orbit over 3 yrsDRIV is once again testing the Golden Genesis at $24.00
Ultra High Gravity fib has held it in orbit for over 3 years.
Break and Retest should start the next Leg with vigor.
Looking for a Retest entry to pop to $26.13 minimum.
==================================================
.
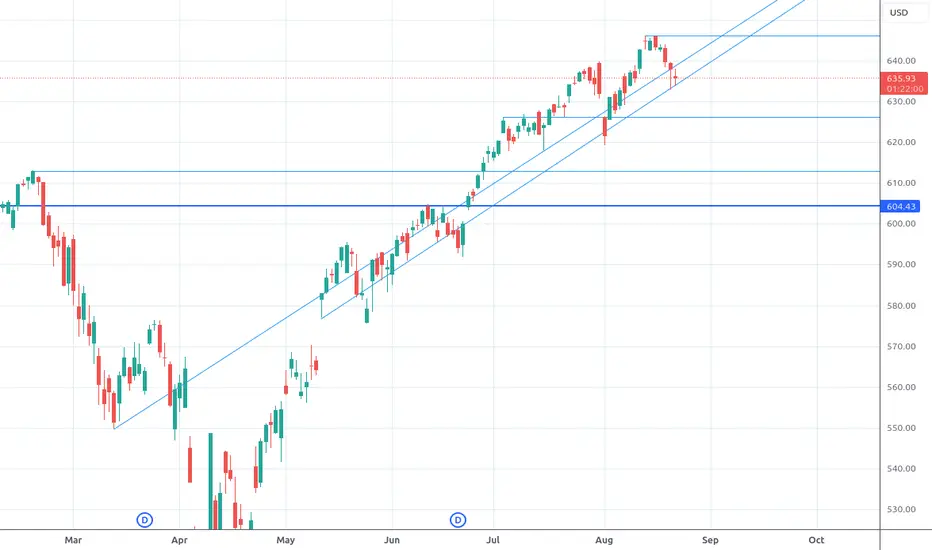
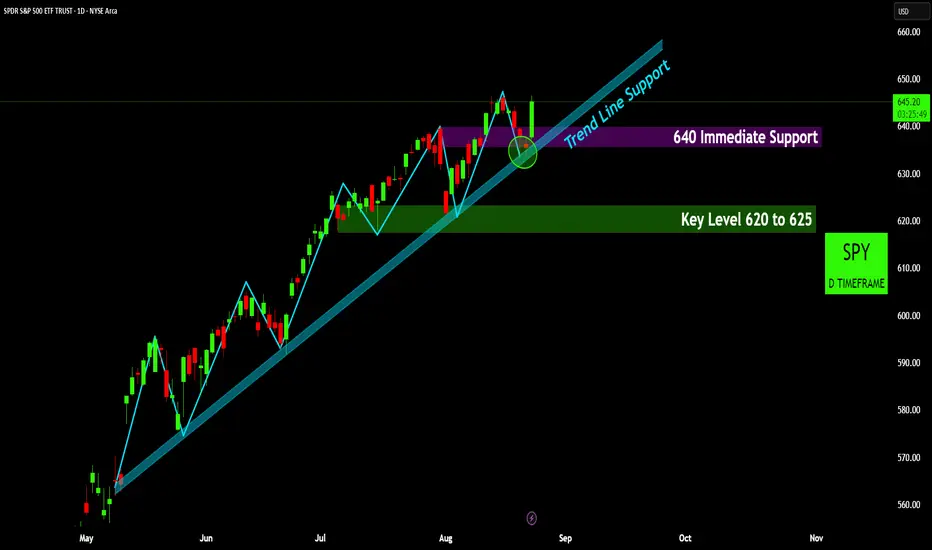
SPY Daily Chart: Uptrend Intact, Key Supports in Focus
SPY Daily Chart: Uptrend Intact, Key Supports in Focus
Established Uptrend with Strong Trend Line Support: SPY continues to display a clear upward trend on the daily timeframe, with price consistently finding support along the depicted trend line. The recent pullback in mid-August saw price effectively test and bounce off this crucial trend line, reaffirming its strength.
640 as Immediate and Confluent Support: The 640 level has proven to be an immediate support zone, coinciding with the recent touch of the upward trend line. The market has shown a decisive bounce from this confluence of support, suggesting current bullish momentum for the short term.
Key Level 620-625 as Deeper Support: Should the immediate 640 support and the upward trend line fail to hold, the next significant 'Key Level' to monitor is the 620 to 625 range. This area has previously acted as a strong demand zone and would represent a more substantial correction within the prevailing uptrend.
Powell’s dovish Jackson Hole speech signaling potential rate cuts amid labor market slowdown and inflation risks, fueled a surge in growth and tech stocks, reinforcing today’s rally.
Disclaimer:
The information provided in this chart is for educational and informational purposes only and should not be considered as investment advice. Trading and investing involve substantial risk and are not suitable for every investor. You should carefully consider your financial situation and consult with a financial advisor before making any investment decisions. The creator of this chart does not guarantee any specific outcome or profit and is not responsible for any losses incurred as a result of using this information. Past performance is not indicative of future results. Use this information at your own risk. This chart has been created for my own improvement in Trading and Investment Analysis. Please do your own analysis before any investments.
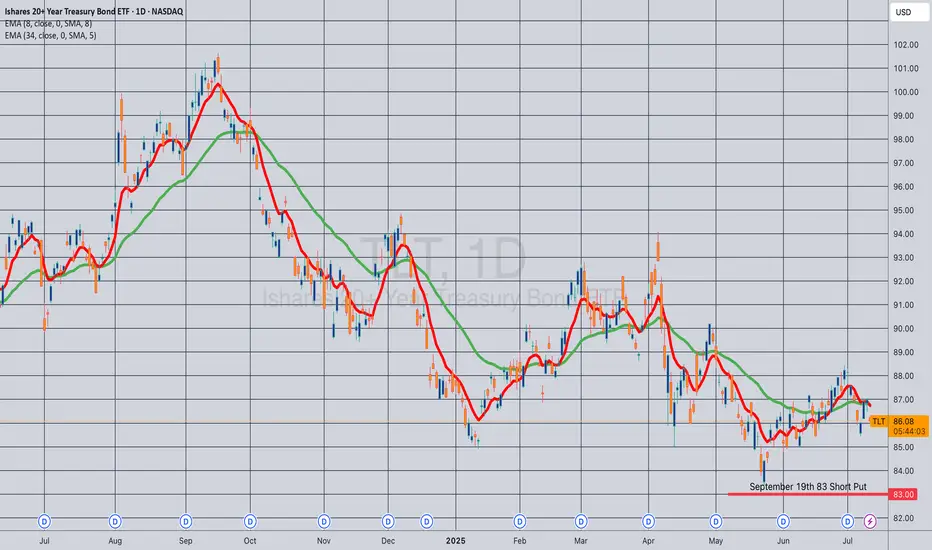
Opening (IRA): TLT Sept 19th 83 Short Put... for an .88 credit.
Comments: Camping out with a strike slightly below the 52-week low, where the options contract is paying a smidge more than 1% of the strike price in credit.
I don't really need more TLT, but wouldn't mind being assigned more at a lower price than the stock element of my covered calls.
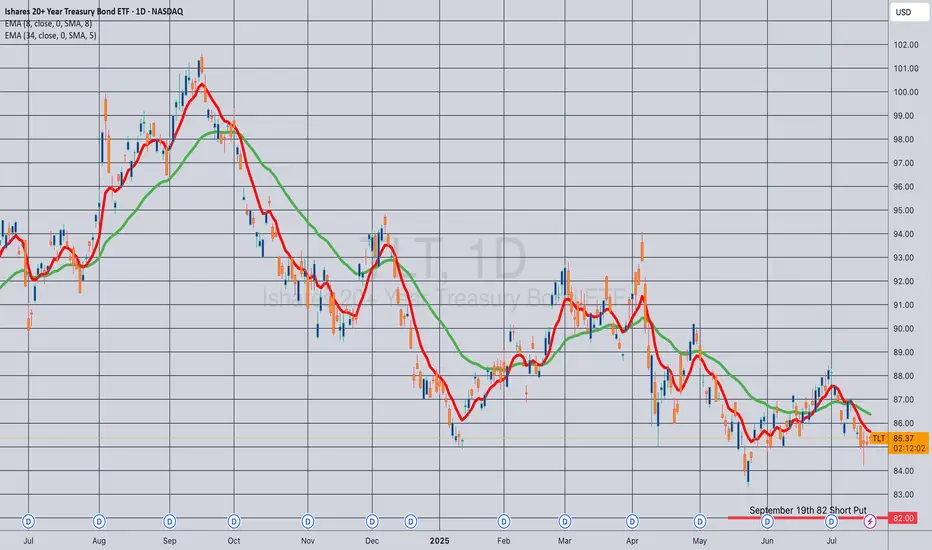
Opening (IRA): TLT September 19th 82 Short Put... for a .90 credit.
Comments: Adding to my position at strikes slightly better than what I currently have on ... .
Opening (IRA): SPY September 19th 500 Short Put... for a 5.02 credit.
Comments: Adding at intervals at strikes better than what I currently have on, targeting the <16 delta strike paying around 1% of the strike price in credit. Will look to manage positions as I come to them.

PSIL weekly bullflag is most likely scenarioBear break of the daily equilibrium with no followthrough has me believing more and more in the weekly bull flag scenario. Still a 4hr downtrend but the bounce today made enough room where we can anticipte a higher low on the next pullback, and then look for resistance breaks on the next push forward to change hourly and 4hr trends.
I publish regular technical analysis of the psychedelic sector. Be sure to like and follow to not miss an important update!

Nightly $SPY / $SPX Scenarios for Friday, August 22, 2025🔮 Nightly AMEX:SPY / SP:SPX Scenarios for Friday, August 22, 2025 🔮
🌍 Market-Moving News
Powell’s Jackson Hole keynote is the main event (10:00 AM ET). Markets want clarity on the path to cuts and any framework tweaks; the Fed’s own calendar lists the speech and KC Fed confirms the Aug 21–23 agenda. $SPY/$TLT/ TVC:DXY are the most sensitive.
Risk tone turned cautious into the speech. Stocks faded Thursday as traders de-risked ahead of Powell; positioning is tight and headline-sensitive.
Dollar firm / gold steady into Jackson Hole. Classic pre-keynote safety bid; futures price a high probability of a September cut, keeping two-way risk for rates and equities.
Global cues: Japan CPI lands overnight; UK retail sales postponed. Japan’s July inflation print hits before U.S. cash open; the U.K.’s July retail sales were pushed to Sep 5, trimming one macro catalyst from the tape.
📊 Key Data & Events (ET)
10:00 AM — Fed Chair Powell @ Jackson Hole (Keynote). Why it matters: Sets near-term curve path and risk appetite; watch $TLT/ TVC:TNX and TVC:DXY → AMEX:SPY reaction.
1:00 PM — Baker Hughes U.S. Rig Count. Why it matters: Energy activity → supply expectations → $CL_F/ AMEX:XLE ; persistent rig drift can nudge inflation expectations. (Released weekly at noon CT/1 PM ET.)
Overnight — Japan CPI (Jul). Why it matters: Yen rates and global FX spillovers; a surprise could ripple into U.S. risk before the keynote.
All day — Jackson Hole Symposium continues. Why it matters: Secondary speakers can color post-Powell reaction as positioning resets.
⚠️ Disclaimer: Educational/informational only — not financial advice.
📌 #trading #stockmarket #SPY #SPX #Fed #JacksonHole #Powell #DXY #TLT #Gold #Energy #RigCount
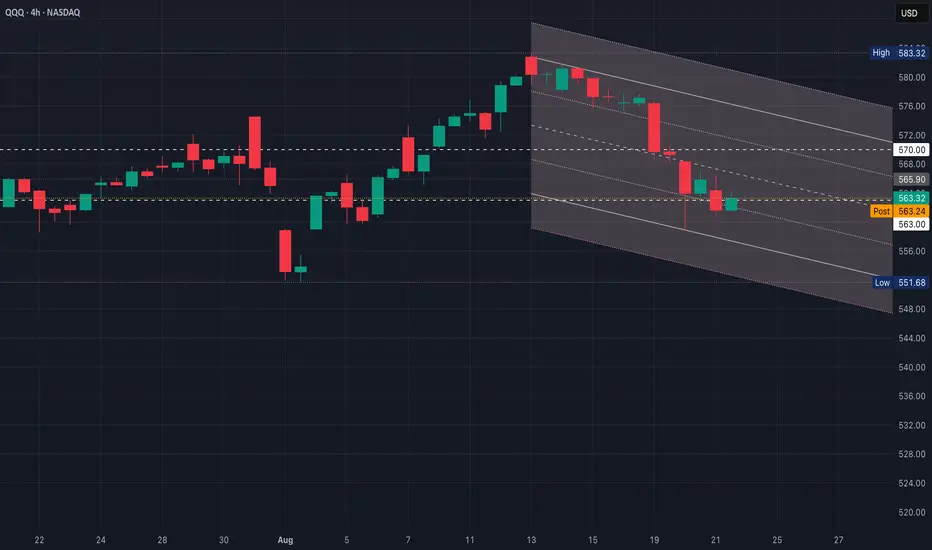
QQQ Post Powell Move w/ Range ExpansionQQQ closing right in the middle of the down channel at ~$563, which is a key battleground ahead of Powell
What’s “developing” is either a base at $563 (could support a bounce) or a bear flag (if bounce fails)
1. Dovish Tilt (hinting at cuts/easing)
Dollar & yields drop, then QQQ rallies
Break above $566, tests $570 quickly
If $570 breaks, upside gap-fill to $575–$577 possible
2. Neutral (balanced/data-dependent)
Market chops inside $561–$570 range
Expect whipsaws; QQQ likely oscillates around $563 pivot line until close
3. Hawkish (higher-for-longer/inflation worry)
Dollar & yields rip higher
QQQ loses $561, then flush toward ~$558
If momentum builds, $553–$555 opens fast
SPY WEEKLY LIVE RECORDED 21st AUG 2025This is the price action of SPY. I have clearly discussed the levels where charts are showing us the probability of buying levels.
If you have any doubts, feel free to leave a comment or DM me.
NOTE:FORGET ABOUT TRADING & FOCUS ON PROTECTING YOUR CAPITAL

August 21st 2025 - Testing New all time high res on S&P 500 SPYS&P 500 SPY ... is testing the new all time high at 646.19 ..... bullish channel support at 634.34 ... watching the bounce off that level today ...