S&P 500 (ES1): Post FOMC, Buyers Pushing Back To The Highs!In this video, we will analyze the following FX market for July 31 - Aug 1st.
S&P 500 (ES1!)
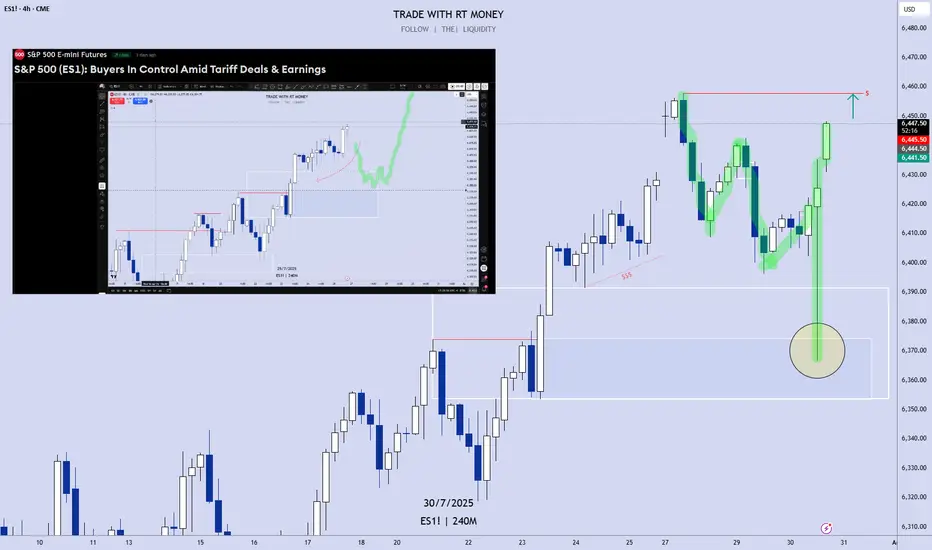
In the Weekly Forecast for the S&P 500, we highlighted:
- price is bullish, and expected to go higher. It did move to ATH before pulling back.
- the sell side liquidity under the ascending lows would draw price.... which it did.
- the Area of Fair Value below the lows, with the Demand Zone as the potential level where a
a high probability long could setup.... which was spot on!
Did you benefit from the forecast? Let me hear from you if you did, in the comment section.
Enjoy!
May profits be upon you.
Leave any questions or comments in the comment section.
I appreciate any feedback from my viewers!
Like and/or subscribe if you want more accurate analysis.
Thank you so much!
Disclaimer:
I do not provide personal investment advice and I am not a qualified licensed investment advisor.
All information found here, including any ideas, opinions, views, predictions, forecasts, commentaries, suggestions, expressed or implied herein, are for informational, entertainment or educational purposes only and should not be construed as personal investment advice. While the information provided is believed to be accurate, it may include errors or inaccuracies.
I will not and cannot be held liable for any actions you take as a result of anything you read here.
Conduct your own due diligence, or consult a licensed financial advisor or broker before making any and all investment decisions. Any investments, trades, speculations, or decisions made on the basis of any information found on this channel, expressed or implied herein, are committed at your own risk, financial or otherwise.
Futures market
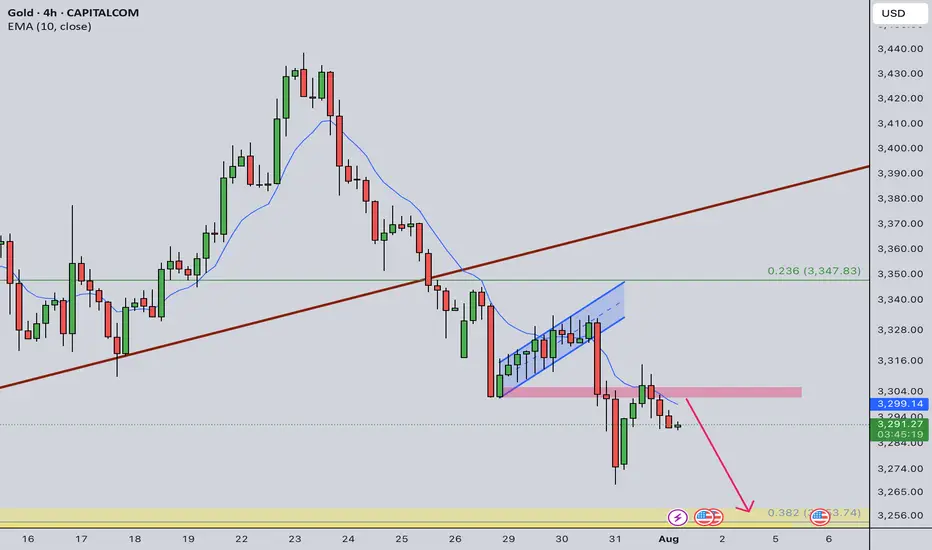
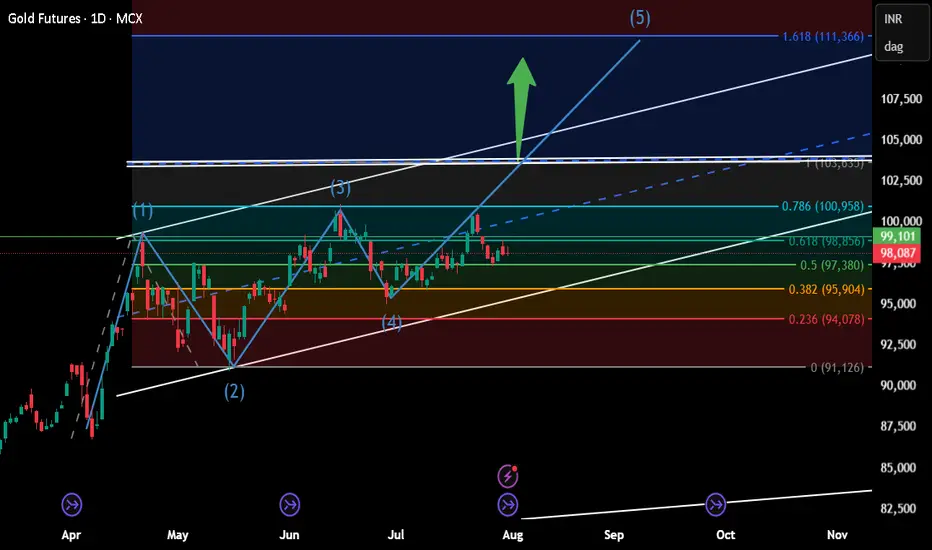
BUY GOLDStill buy oriented for now. Cont from prev post. Will take positions based on price fracturing
GOLD POSSIBLE SHORT (LT Buy Oriented)Things are starting to calm down. Gold might see a shift in demand and calm down.
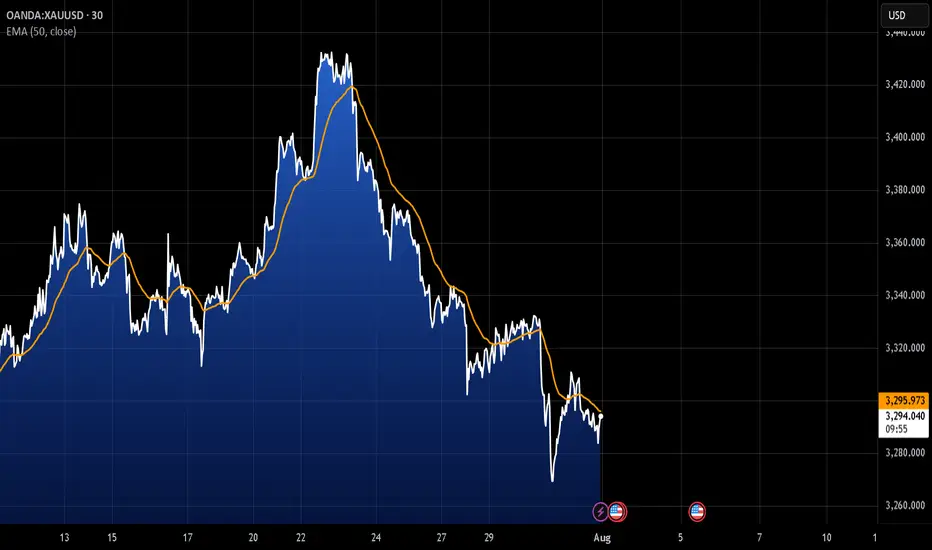
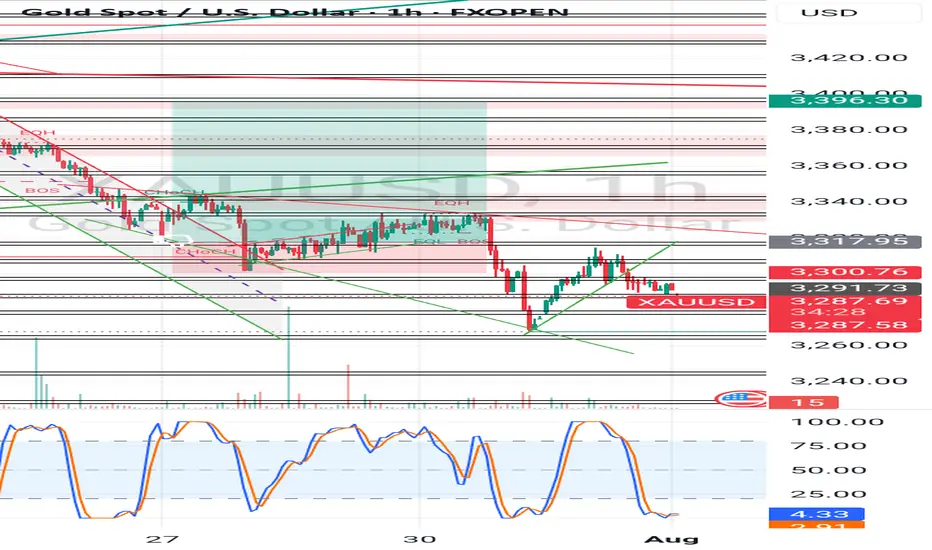
Gold Intraday Trading Plan 8/1/2025Although yesterday's retracement is a bit too deep, I am still bearish in gold in medium term as long as 3333 resistance is not broken. Therefore, I will still look for selling opportunities today.
Currently daily is in green bar while smaller timeframe shows bearish signs. If there is a double top formed near 3300, I will sell toward my weekly target at 3255.
Natural Gas Bullish Reversal...Are the Lows in?U.S. natural gas inventories increased by 48 billion cubic feet last week to 3,123 Bcf, increasing the surplus over the five-year average.
Consensus / forecast was 37Billion Cubic feet.
Despite a much higher build than expected Nat gas saw positive price action.
This appears to simply be a dead cat bounce before we go lower.
A death cross on the daily chart has occurred. This signal often results in a small bounce before going lower.


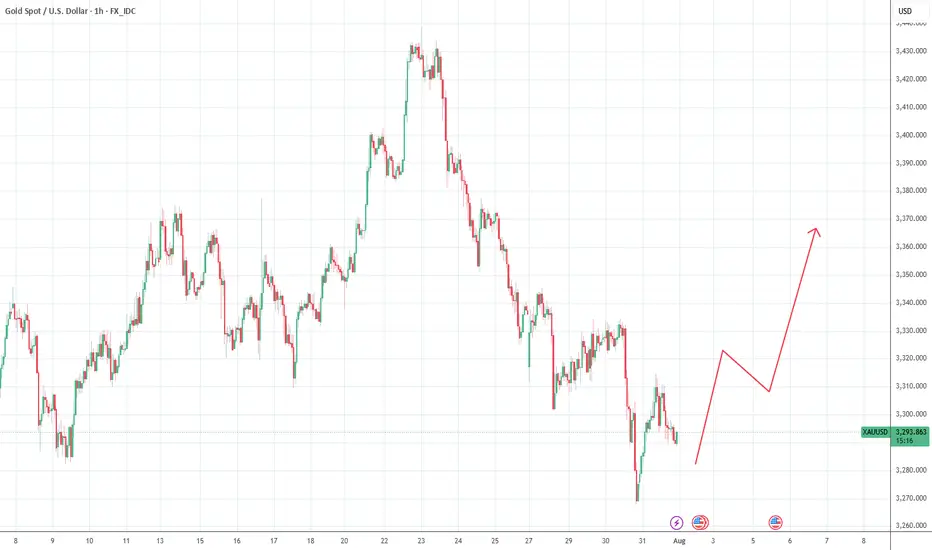
GOLD BUYGold maintains its daily gains around $3,300
After retreating markedly on Wednesday, Gold rebounds moderately and remains positive at about $3,300 per troy ounce on Thursday. The precious metal’s rebound comes in response to the daily retracement in US yields across the curve and the so far irresolute price action in the Greenback
The US Federal Reserve kept its benchmark interest rate unchanged for the fifth consecutive meeting, in a range of 4.25% to 4.5%, despite intense pressure from US President Donald Trump and his allies to lower borrowing costs. The decision, however, met opposition from Fed Governors Michelle Bowman and Christopher Waller. This was the first time since 1993 that two governors had dissented on a rate decision.
In the accompanying monetary policy statement, the committee had a more optimistic view and noted that the economy continued to expand at a solid pace. Adding to this, Fed Chair Jerome Powell said during the post-meeting press conference that the central bank had made no decisions about whether to cut rates in September. This comes on top of the upbeat US macro data, and lifted the US Dollar to a two-month high.
Automatic Data Processing reported that private payrolls in the US rose by 104,000 jobs in July, following a revised 23,000 fall recorded in the previous month. Adding to this, the Advance US Gross Domestic Product (GDP) report published by the US Commerce Department showed that the economy expanded at a 3.0% annualized pace during the second quarter after contracting by 0.5% in the previous quarter
SUPPORT 3,346
SUPPORT 3,328
SUPPORT 3,309
RESISTANCE 3,283
RESISTANCE 3,273
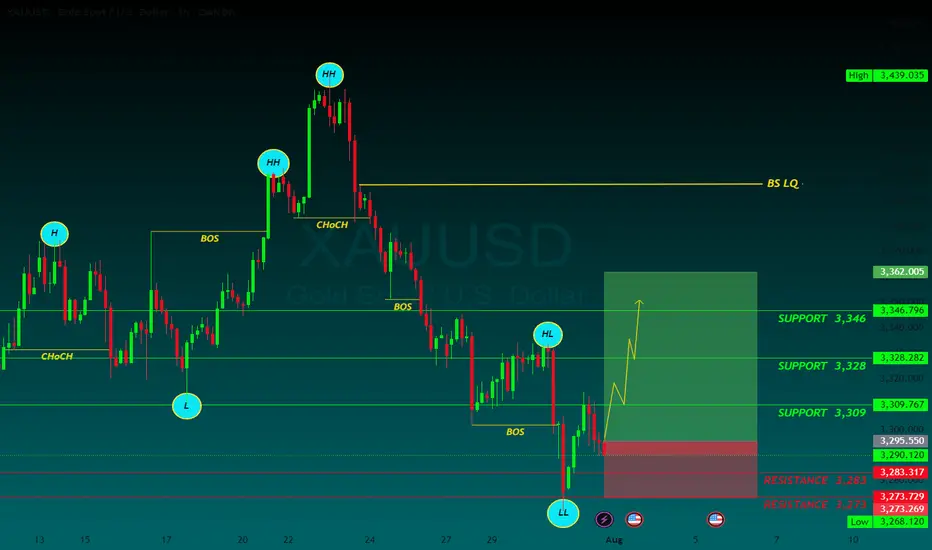
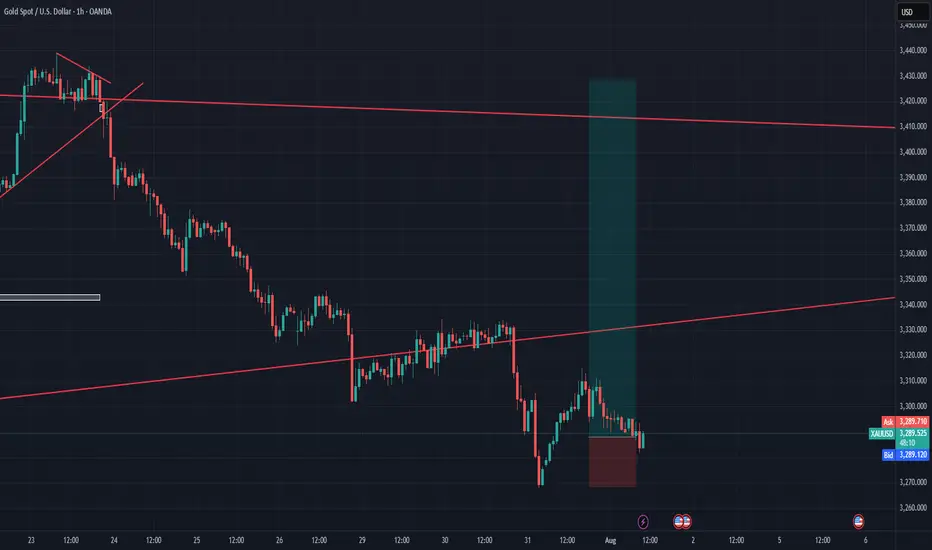
XAU USD LONG RESULT Price broken down both of our supports Trendline and zones without filling any of the supply zones hitting our SL.
Better Improved Set-ups to come 💪
_THE_KLASSIC_TRADER_.
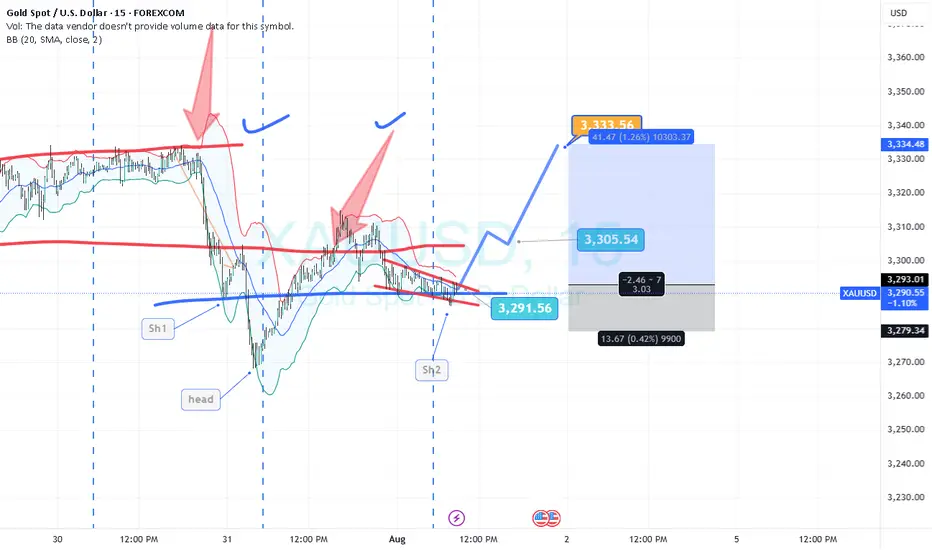
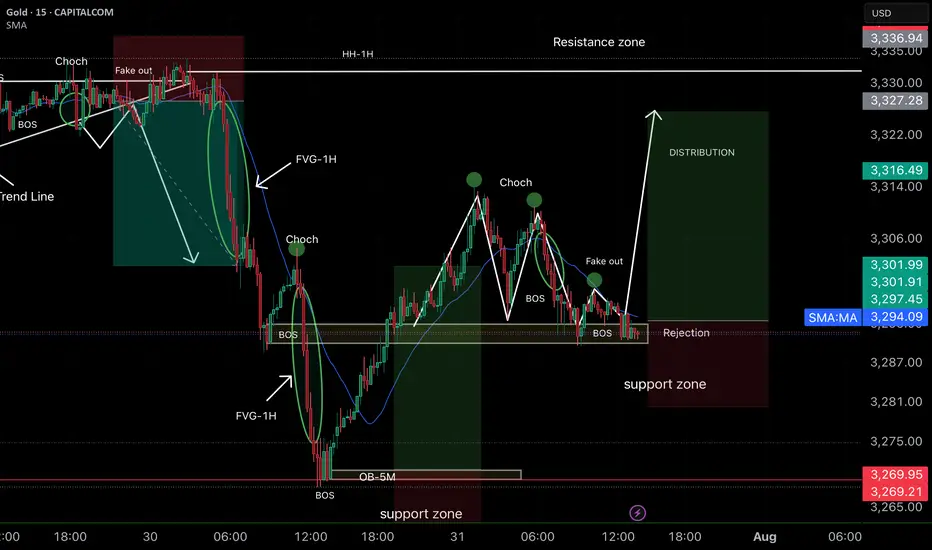
Smart Money Concepts (SMC) ✅ Analysis strengths:
• Correct identification of BOS (Break of Structure) and CHoCH, which indicate a change in direction.
• The support zone is marked and respected with rejection, reinforcing the probability of a rebound.
• The projection toward the distribution zone and HH of 1H is consistent, as there are inefficiencies (FVG) pending mitigation.
• The previous fake out clears liquidity and creates room for strong bullish momentum.
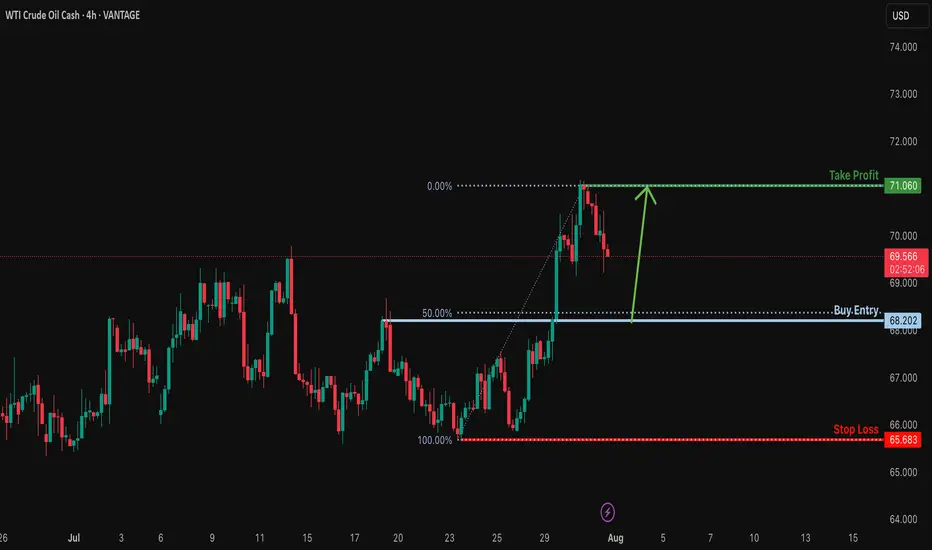
Bullish bounce off 50% Fibonacci support?USOUSD is falling towards the support levle which is a pullback support that aligns with the 50% Fibonacci retracement and could bounce from this level to our take profit.
Entry: 68.20
Why we like it:
There is a pullback support that lines up with the 50% Fibonacci retracement.
Stop loss: 65.68
Why we like it:
There is a multi swing low support.
Take profit: 71.06
Why we like it:
There is a swing high resistance.
Enjoying your TradingView experience? Review us!
Please be advised that the information presented on TradingView is provided to Vantage (‘Vantage Global Limited’, ‘we’) by a third-party provider (‘Everest Fortune Group’). Please be reminded that you are solely responsible for the trading decisions on your account. There is a very high degree of risk involved in trading. Any information and/or content is intended entirely for research, educational and informational purposes only and does not constitute investment or consultation advice or investment strategy. The information is not tailored to the investment needs of any specific person and therefore does not involve a consideration of any of the investment objectives, financial situation or needs of any viewer that may receive it. Kindly also note that past performance is not a reliable indicator of future results. Actual results may differ materially from those anticipated in forward-looking or past performance statements. We assume no liability as to the accuracy or completeness of any of the information and/or content provided herein and the Company cannot be held responsible for any omission, mistake nor for any loss or damage including without limitation to any loss of profit which may arise from reliance on any information supplied by Everest Fortune Group.
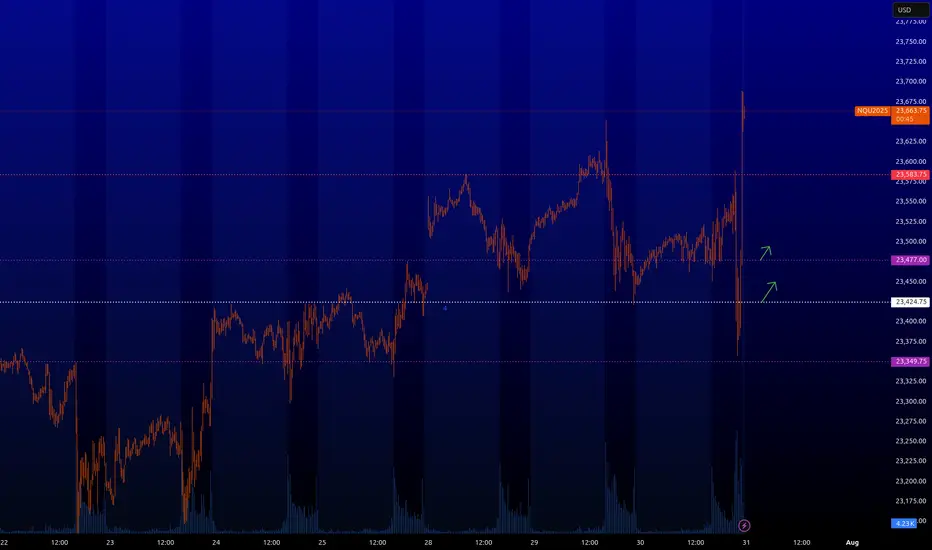
NQ : Buy levelsAll right, the stops are off like I said in my prev NQ post.
Turns out there was an important FOMC news that I didn't notice. I don't usually trade on the news.
Now the levels where the green arrows are from are back in play. You can pips, you can scalp, you can look for longer trades from them. I usually scalp them.
NQ : enormous amount of sell-stopsI have highlighted two zones where a lot of sell-stop orders are currently concentrated. Those who trade robots with fast buybacks, you can put your algorithms there. When entering these zones there will be a quick dropdown of the price if it comes to these zones in liquid time (American session).
Those who do not have robots, I will inform you when it will be possible to get some profit from these zones with limit trades.

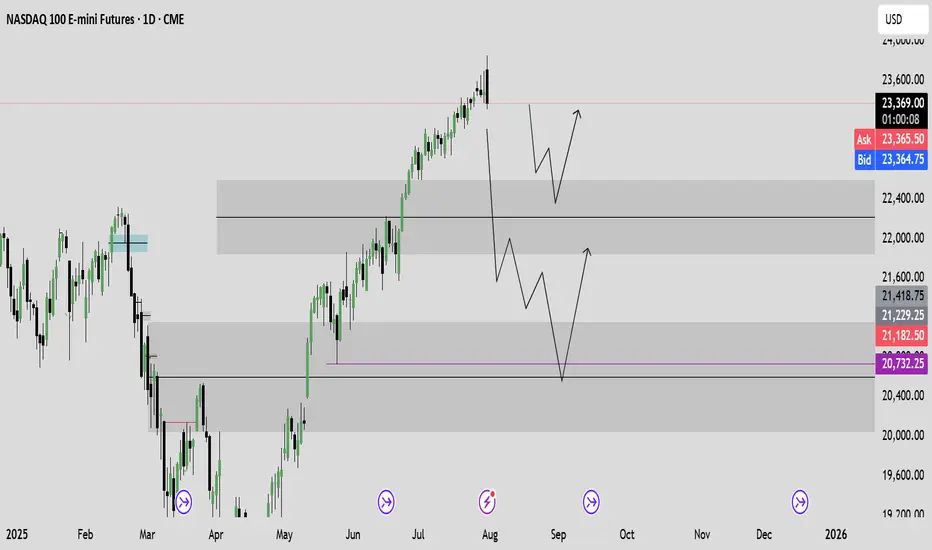
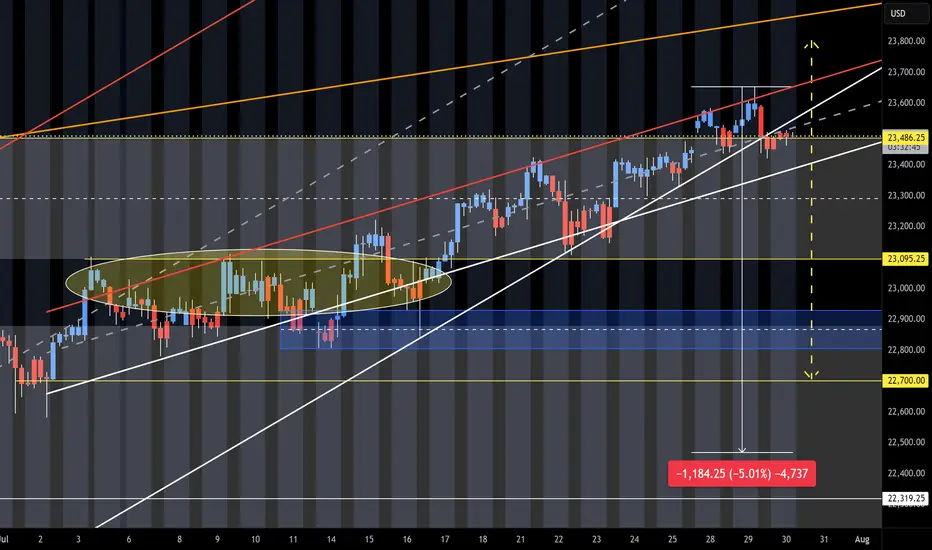
NQ Short (07-30-25)NAZ is at upper target and Turn Zone from May 12th post. Failure here should see a 5% drop test. The idea is that buyers will need some sellers in order to get higher. The sellers will help to test the level strength. Month end into a Friday-Monday Long play and a break in this long standing pattern may create the opposite. Current danger zone is the 23,486 KL. Look Long above and short below. Scalping Shorts should turn to holding shorts and scalping Longs. Expect timely Tweets and same old Tricks near or under the DZ. O/N is still The BOSS until both the O/N and Reg Session sell (on same day).
GOLD SHORT10 year bullrun is followed by a shorter term bearmarket. Gold is starting to lose its strength, which is a clear sign of weakness and the beginning of a bearish reversal.

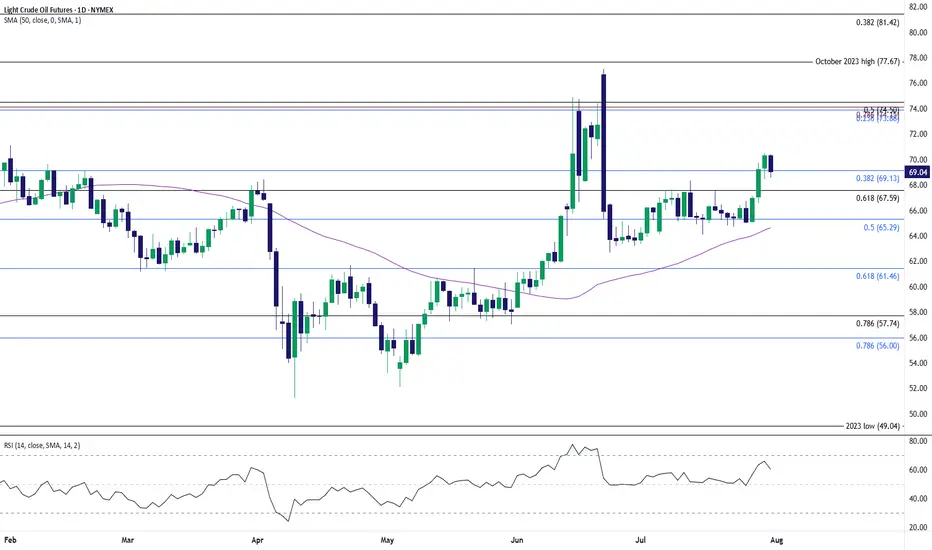
Oil Price Pulls Back to Keep RSI Out of Overbought ZoneThe recent rally in oil appears to have stalled as it struggles to extend the bullish price series from earlier this week, with the Relative Strength Index (RSI) pulling back ahead of overbought territory.
Lack of momentum to hold above the $67.60 (61.8% Fibonacci retracement) to $69.10 (38.2% Fibonacci retracement) zone may push the price of oil toward $65.30 (38.2% Fibonacci retracement), with a breach of the monthly low ($63.36) bringing $61.50 (61.8% Fibonacci retracement) on the radar.
At the same time, the price of oil may defend the advance from earlier this week should it hold above the $67.60 (61.8% Fibonacci retracement) to $69.10 (38.2% Fibonacci retracement) zone, with a move/close above the $73.90 (23.6% Fibonacci retracement) to $74.50 (50% Fibonacci retracement) region bringing the June high ($77.09) on the radar.
--- Written by David Song, Senior Strategist at FOREX.com

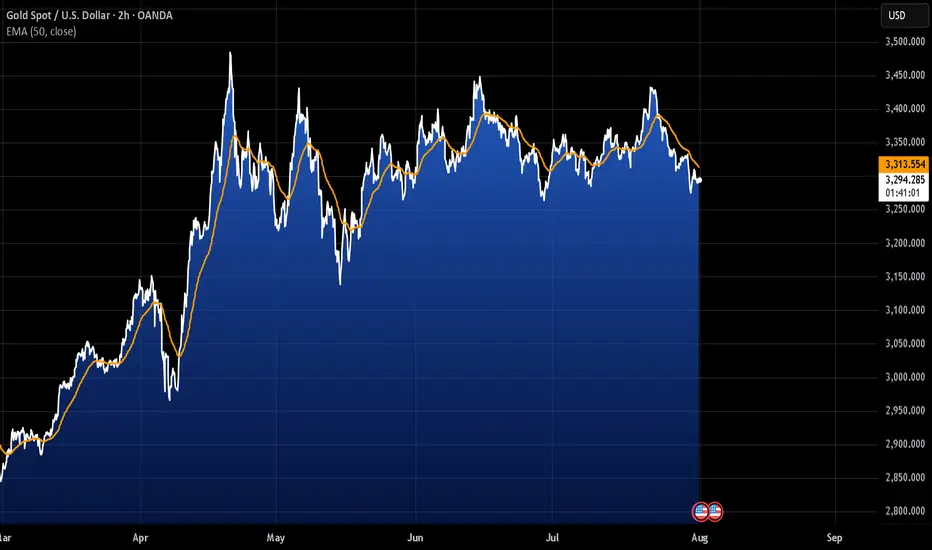
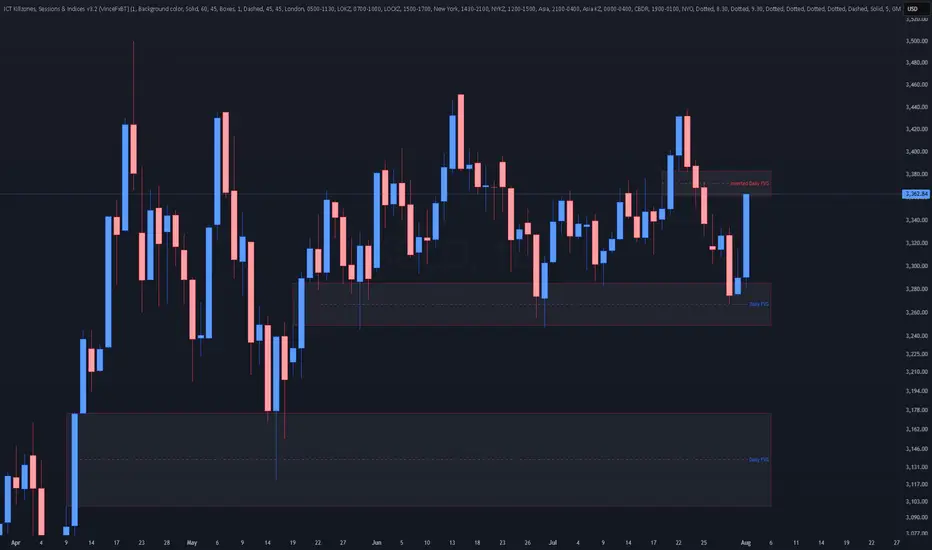
XAUUSD - Daily | More Consolidation??Gold is back in the upper range of this consolidation zone. You can see the high of the range is 3430, and the low is 3240 roughly.
Bulls:
Gold is pulling back into an Inverted FVG. If the price is bullish, then we should clear the gap with ease. Gold has just eliminated 4 days' worth of choppy bearish price action. Look for gold to give clear signs to enter a buy.
**A new daily candle should appear, creating a new FVG showing buyers are winning
Bears:
So with that said... If Gold fails to remain bullish after Friday's (Aug 1st) 700-pip jump, then the iFVG may have the price react bearishly. Watch for gold to give a clear sign of rejection before entering a sell
**Price may drop to cover Friday's gap. Doesn't mean it's bearish
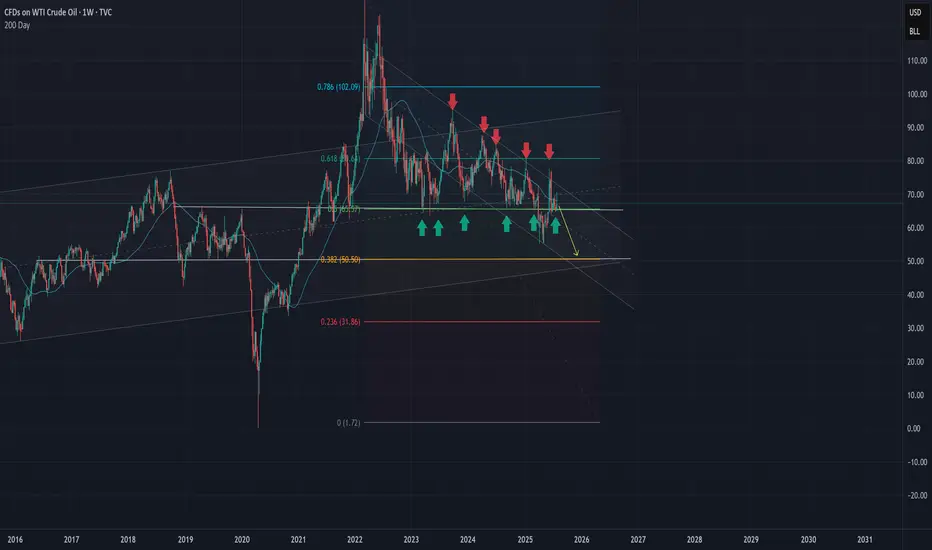
Crude OilOil will go down to %50 by EOY 2026 unless it breaks the upper bound of the downsloping parallel.