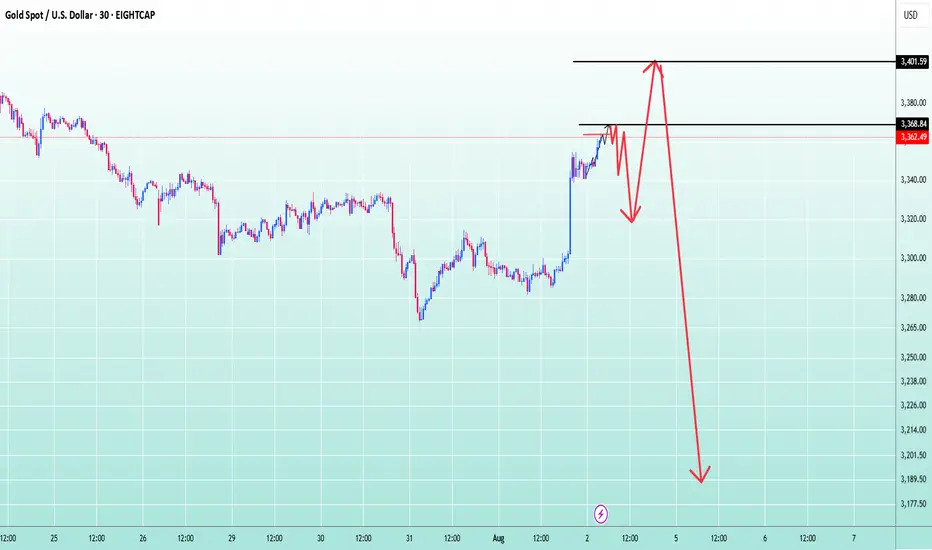
XAUUSD | Bullish Breakout Play into Supply Gold has broken out of internal structure and retested the trendline from below. Expecting a continuation into the next supply zone above 3377 and potentially 3400.
📌 Entry: 3362.89
🛑 Stop Loss: 3345.50
🎯 Targets:
• TP1: 3377.75
• TP2: 3400.39
🔁 Trade shared by @NFNCsignals on Telegram
🧠 Precision | Discipline | Community
Trade at your own risk. This is not financial advice.
Futures market

BULLISH ON GOLDLet's take a look at some key things happening with gold and why I decided to go long. The first and most convincing factor for me is the market structure shift after taking sell-side liquidity, followed by strong displacement to the upside. We also have equal highs. Additionally, there’s a 4-hour breaker, and if you look at DXY, it has broken down after running ITS buy-side liquidity. Bonds (ZBU2025) are also showing strength. Gold is still in a range market, and right now we are at the range lows. So, even if you're not bullish on gold, it doesn’t make sense to short. I also wouldn’t feel comfortable shorting because of the equal highs above.
INVALIDATION IS RECENT 4HR LOW.

XAUUSD | Weekly Fakeout → Wedge Breakout | Targeting 3508+🔔 Summary:
Reclaimed liquidity, broke wedge structure with strength, and printed continuation signs.
Expecting bullish move toward 3,508 on higher timeframe if breakout holds.
Will reassess if price closes below 3,314 (invalidates short-term momentum).
🔔 Long Version:
📝 Description:
📆 Date: 2nd August 2025
📊 Timeframe: Weekly → Multi-TF Analysis
📈 Bias: Bullish
🧠 Setup: High-volume breakout from descending wedge + weekly fakeout/liquidity sweep.
⸻
🧱 Structure
• Weekly fakeout below trendline rejected with strength
• 4H bullish engulfing candle broke through EMA stack and wedge resistance
• Price retested previous Fair Value Gap (FVG) and confirmed buyer strength
• Strong volume spike and MACD momentum shift confirmed breakout conviction
📊 Indicators
• EMAs: Price above 20/50/100/200 on H1 & 4H
• MACD: 4H flipping bullish, Weekly still holding green
• Volume: Significant bullish breakout candle, multi-timeframe confluence

BOS/chochcomment on how to catch trade after BOS?
ICT is interesting but no set rule, please share if any universal rule.

Buy Side favaourable @ XAUUSDGold has strong potential for trading on buy side if we see any correction of few 50 $ downwards.
Buy at every Dip is suggested.

SILVER: The Market Is Looking Down! Short!
My dear friends,
Today we will analyse SILVER together☺️
The market is at an inflection zone and price has now reached an area around 37.036 where previous reversals or breakouts have occurred.And a price reaction that we are seeing on multiple timeframes here could signal the next move down so we can enter on confirmation, and target the next key level of 36.788..Stop-loss is recommended beyond the inflection zone.
❤️Sending you lots of Love and Hugs❤️

Gold trend analysis!From the price level of 3368 and above, gold is expected to pull back at least until the Stochastic on the M30–H1 timeframes reaches oversold levels.
After that, a bullish continuation is likely, pushing the price up to around 3400.
This area will be a critical decision point — determining whether the market will continue its uptrend or reverse into a downtrend.
If the H4 chart prints a reversal candlestick pattern, it would indicate the beginning of a bearish trend, which could potentially lead to a downward movement of up to 20,000 points.
Still Bullish BiasOn the 4HR , there is already 2 legs down to start the month, similar to what happened in May. Markets typically has had 2 legs down before moving higher. Its August and its gonna be choppy.
We may test the tip of last years candle before we move even higher, which is another probably 80-100 points. However the hourly seems to reject this idea based on a 9 TD Sequential Count as the first alert failed and Bear continues pushing the price down. When in doubt always look at a higher timeframe. Just my thought of the probable outcome. Trade safe.

Friday's support clearly shown This is why I use the Accurate Swing Trading System (Ceyhun). Look at it in default configuration on this daily MES1! chart. I drew the red horizontal lines where the indicator line is "flat". That is what I am trying to show you. An "Emergent Quality" of the indicator. I note the line at 6,241 and the LOD at 6239.50. ( line at 6318 failed to support the price) My experience with it says it's better than Fibonacci, Camarilla etc. Where do we go from here?.....The market will show us....Let the Ceyhun show you support and resistance on shorter term charts....You will be glad you did. Happy Trades. DAP

Has a bull market started? In-depth analysis.Friday's non-farm payroll report was unexpectedly disappointing, sending gold soaring.
Data released by the U.S. Department of Labor on Friday showed that non-farm payrolls added only 73,000 jobs in July, far below market expectations of 100,000. The weak employment report quickly shifted market sentiment regarding the Federal Reserve's policy path. Market expectations for a September rate cut have soared to 75%, with another cut expected before the end of the year.
This shift has provided strong support for gold prices. Amidst persistent inflationary pressures and disappointing employment data, a Fed rate cut would be a substantial boon for gold.
Friday's data triggered a sharp rise in gold prices on the daily chart, reversing a week-long decline. This is the first sign of a pattern that breaks a weak downward trend. Following consecutive declines, the daily chart began to rise, directly reversing a week's losses. This pattern is likely to continue next week, forming a bullish pattern, with a potential second leg higher. Therefore, next week will be crucial for bullish sentiment, with key focus on whether it can break through the highs and the continuity of the bullish trend.
The bullish trend is likely to continue next week. It's also important to note that Friday's pullback to around 3340 marked an inflection point, a watershed between bulls and bears and a secondary bullish level. Since Friday's close was near resistance, it's important to watch whether the market will surge directly next week or retreat before rising again. If the rally isn't sustained in the early Asian session, a correction is likely to occur, accumulating upward momentum.
GOLD: Bulls Are Winning! Long!
My dear friends,
Today we will analyse GOLD together☺️
The recent price action suggests a shift in mid-term momentum. A break above the current local range around 3,363.50 will confirm the new direction upwards with the target being the next key level of 3,383.45 and a reconvened placement of a stop-loss beyond the range.
❤️Sending you lots of Love and Hugs❤️
Gold will continue to rise next week✅ Fundamental Analysis
Friday’s Non-Farm Payrolls (NFP) data came in significantly below expectations, with new job additions falling far short of market forecasts. This sparked a sharp rise in expectations for a Fed rate cut later this year. As a result, the U.S. dollar index declined and gold prices surged violently, rallying from the 3281 level to a high of 3362 — a single-day gain of over $85, completely erasing the week's prior losses and reestablishing a strong bullish structure.
✅ Technical Analysis
📊 Weekly Chart
Gold posted a strong bullish weekly candlestick, reversing the previous consolidation trend and signaling a structural shift in market sentiment. Bulls have regained full control. The key resistance zone lies between 3380–3400; if price breaks and holds above this level, the next upside target will be around 3430.
📊 Daily Chart
Gold stabilized at the 3281 low and surged on Friday evening following the NFP surprise, closing near the day’s high — a sign of aggressive buying. The short-term trend has clearly reversed to the upside, and any pullback is now considered a buying opportunity. The key support has moved up to around 3335, serving as a critical pivot zone. Further support is seen near 3316, a previous swing low.
📊 Hourly Chart
Price is currently trading above short-term moving averages, indicating a strong bullish bias. The key level for a potential bullish continuation is around 3355, which represents a recent support-turned-resistance area. If price pulls back to this level and holds, or breaks above it directly, it will confirm bullish strength. If gold opens with a gap higher toward 3385, beware of potential short-term volatility due to a liquidity gap. Chasing highs in such scenarios requires caution.
🔴 Resistance Levels: 3375–3380 / 3400–3430
🟢 Support Levels: 3355–3340 / 3330–3335 / 3316
✅ Trading Strategy Reference
🔺 Primary Strategy – Buy on Dips:
🔰Consider long entries around 3340–3335, with a stop-loss below 3328.
🔰If the market remains strong, a direct long near 3355 is viable, targeting 3375 and above.
🔰A deeper pullback to 3330–3335 is a favorable entry zone for mid-term longs.
🔻 Secondary Strategy – Sell on Rebounds (Short-Term Only):
🔰If gold opens Monday with a sharp spike to around 3385 but fails to break higher, a light short position may be considered, targeting a quick $10–$15 pullback.
🔰If 3385 is broken and held, abandon short setups and revert to a bullish view.
✅ Overall Outlook
Gold has completed a technical reversal following the bullish fundamental catalyst from the NFP data. The trend has shifted from bearish to bullish, and the market has clearly moved into a higher price range. The core trading logic should remain “buy on dips”, and countertrend trades should be approached with caution. Look for long opportunities near key support levels, and consider short positions only at major resistance levels and for quick intraday trades. A confirmed breakout above 3375 will likely open the door to 3400–3430 in the near term

USOIL Technical Analysis! BUY!
My dear followers,
I analysed this chart on USOIL and concluded the following:
The market is trading on 67.25 pivot level.
Bias - Bullish
Technical Indicators: Both Super Trend & Pivot HL indicate a highly probable Bullish continuation.
Target - 68.74
About Used Indicators:
A super-trend indicator is plotted on either above or below the closing price to signal a buy or sell. The indicator changes color, based on whether or not you should be buying. If the super-trend indicator moves below the closing price, the indicator turns green, and it signals an entry point or points to buy.
Disclosure: I am part of Trade Nation's Influencer program and receive a monthly fee for using their TradingView charts in my analysis.
———————————
WISH YOU ALL LUCK

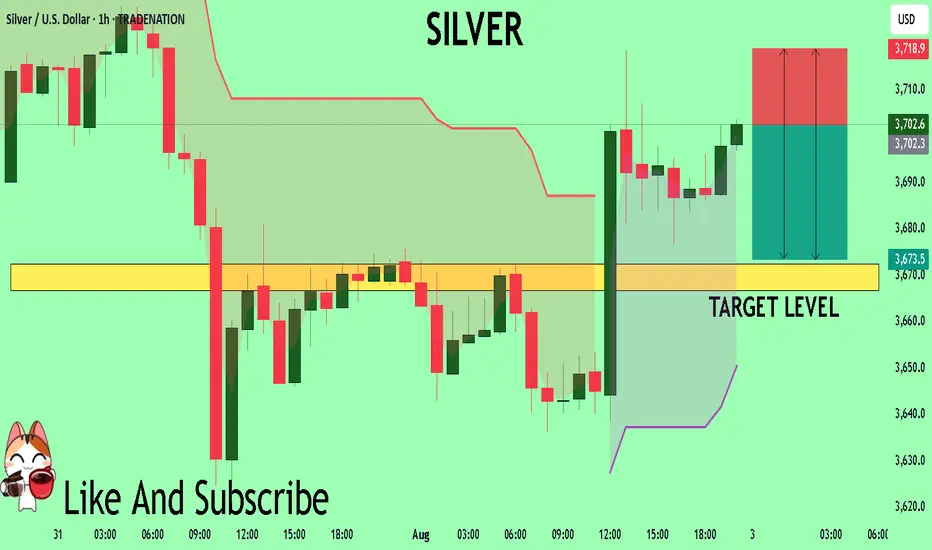
SILVER My Opinion! SELL!
My dear friends,
Please, find my technical outlook for SILVER below:
The price is coiling around a solid key level - 37.026
Bias - Bearish
Technical Indicators: Pivot Points Low anticipates a potential price reversal.
Super trend shows a clear sell, giving a perfect indicators' convergence.
Goal - 36.725
Safe Stop Loss - 37.189
About Used Indicators:
The pivot point itself is simply the average of the high, low and closing prices from the previous trading day.
Disclosure: I am part of Trade Nation's Influencer program and receive a monthly fee for using their TradingView charts in my analysis.
———————————
WISH YOU ALL LUCK
WTIWTI crude oil (West Texas Intermediate) is one of the main global benchmarks for oil pricing, alongside Brent crude. It is a light, sweet crude oil primarily produced in the United States and traded on the New York Mercantile Exchange (NYMEX). WTI is known for its high quality and low sulfur content, making it ideal for refining into gasoline and other fuels. Crude oil prices are influenced by a wide range of factors including global supply and demand dynamics, geopolitical tensions, OPEC+ decisions, US shale production, and macroeconomic trends such as inflation and economic growth.
Over the past two decades, crude oil has experienced significant volatility. Prices surged to over $140 per barrel in 2008, collapsed during the global financial crisis, and again plummeted during the COVID-19 pandemic in 2020, when demand collapsed and prices briefly turned negative for the first time in history. The years following saw a sharp rebound as the global economy reopened and supply constraints persisted. However, rising interest rates, concerns about slowing global growth, and increasing energy transitions toward renewables have put downward pressure on oil demand in recent years.
As of August 2025, WTI crude oil is trading at $66.59 per barrel, reflecting a relatively weak energy market compared to its highs in 2022. The current price suggests concerns over slowing global industrial demand, increased US oil production, and ongoing geopolitical negotiations that have stabilized some of the previous supply shocks. While energy markets remain sensitive to global conflicts, economic shifts, and OPEC+ policy decisions, WTI at this level represents a market balancing between moderate demand and ample supply. It remains a critical asset for energy traders and a key indicator of global economic health.

LIVE BTC/USD, XAUUSD TRADING, 02/08/2025 SIGNALS PRICE ACTION TRLive BTC/USD, XAUUSD TRADING, 02/08/2025 signal price action trading strategy

Silver The Week AheadKey Support and Resistance Levels
Resistance Level 1: 3756
Resistance Level 2: 3855
Resistance Level 3: 3915
Support Level 1: 3600
Support Level 2: 3544
Support Level 3: 3480
This communication is for informational purposes only and should not be viewed as any form of recommendation as to a particular course of action or as investment advice. It is not intended as an offer or solicitation for the purchase or sale of any financial instrument or as an official confirmation of any transaction. Opinions, estimates and assumptions expressed herein are made as of the date of this communication and are subject to change without notice. This communication has been prepared based upon information, including market prices, data and other information, believed to be reliable; however, Trade Nation does not warrant its completeness or accuracy. All market prices and market data contained in or attached to this communication are indicative and subject to change without notice.

Gold ready to create new all time high!!!Buy: $3447.28
Set up: wait for a breakout and hidden bullish divergence on a weekly basis.
Sl: $3183.11

Weekly Hammer Ignites Gold’s Breakout PotentialGold has been quietly consolidating for the past three months, forming a classic accumulation zone. Now, a powerful weekly hammer candlestick has emerged—hinting at a potential breakout.
In this video, I break down the technical setup:
• The structure of the accumulation range
• The significance of the weekly hammer
• Key indicators hovering near breakout confirmation
• Price levels to watch for validation or rejection
While the breakout isn’t confirmed yet, momentum is building. If you're tracking commodities or trading gold, this is a moment to pay attention. The next move could be decisive.

Trend continuation or reversal?Gold bounced strongly from the bottom of the higher time frame channel, and we should also consider that this bounce was triggered by news that was negative for the dollar on Friday. Now we need to wait and see whether this move is truly strong or if it's going to turn out to be a fake and head back down toward the bottom of the channel.

GOLD: NEW WEEK TECHNICAL BIAS (MARKET OPEN)CONTEXT
▪︎ HTFs Bias: Bullish stance remains intact until a valid structural breach occurs.
▪︎ Monthly Context: Despite consistent upper wick rejections, price continues to close above prior monthly opens — suggesting bullish resilience.
▪︎ Weekly View: Current price action reflects a Value Compression Phase (VCP) within the premium zone of the active range, implying potential buildup for a bullish Impulse Drive.
▪︎ Daily Alignment: Daily price behavior mirrors the Weekly context, supporting a continuation thesis.
Preferred Scenario: Leaning towards a Retrace Precision Entry (RPE) before the Ascend Sequence resumes. Watching:
• Point A (shallow pullback) near B/C level, or
• Point B (deep pullback) into the pending Rejection Zone (ARB).
Invalidation Trigger: A structural breach below 3336, backed by bearish momentum and microstructure shift, targets first 3280, then levels below.
Uncertainty Variable: Will price first sweep 3433.2 before retracing? Or will it retrace from market open? This remains unclear and demands a patient, reactive stance.
📌 Disclaimer: This is a strategic directional bias, not financial advice. Execute only with confirmation and proper risk management.

Gold Futures Super Strong Resistance - Price Coming Back StrongGold Future has been very strongly pushing up without filling any gapes in the short side before pushing up more further.
One unique line is probably the target super strong resistance.
In a daily chart, probably better wait until it reaches that point to try to check for strong short entries maybe.
Still arriving there it would explode up even more further to transform that line into a super strong probable support.
Keep watching!
(Do we actually have to believe that gold is secretly targeting $10,000) in the Yearly Chart?... Since February 2022 it just went berserk!)

STRONG BUY | PALLADIUM Strategy: Impulse Correction
Direction: Bullish
Moving Average: Blue above Red
Fib Retracement: 38.2 reached
MACD > 0
Support : Finding additional confluence, as the weekly bounces off a massive support structure
1st Target = 1336
2nd Target = 1419
3rd Target = 1527
Lots: 0.2 (Plan to pyramid into this one)
RISK: Tariff Wars continue to hamper global growth as supply chains feel the brunt of the disruption.
Trade 4/20
