Gold ready to create new all time high!!!Buy: $3447.28
Set up: wait for a breakout and hidden bullish divergence on a weekly basis.
Sl: $3183.11
Futures market

Weekly Hammer Ignites Gold’s Breakout PotentialGold has been quietly consolidating for the past three months, forming a classic accumulation zone. Now, a powerful weekly hammer candlestick has emerged—hinting at a potential breakout.
In this video, I break down the technical setup:
• The structure of the accumulation range
• The significance of the weekly hammer
• Key indicators hovering near breakout confirmation
• Price levels to watch for validation or rejection
While the breakout isn’t confirmed yet, momentum is building. If you're tracking commodities or trading gold, this is a moment to pay attention. The next move could be decisive.

Trend continuation or reversal?Gold bounced strongly from the bottom of the higher time frame channel, and we should also consider that this bounce was triggered by news that was negative for the dollar on Friday. Now we need to wait and see whether this move is truly strong or if it's going to turn out to be a fake and head back down toward the bottom of the channel.

GOLD: NEW WEEK TECHNICAL BIAS (MARKET OPEN)CONTEXT
▪︎ HTFs Bias: Bullish stance remains intact until a valid structural breach occurs.
▪︎ Monthly Context: Despite consistent upper wick rejections, price continues to close above prior monthly opens — suggesting bullish resilience.
▪︎ Weekly View: Current price action reflects a Value Compression Phase (VCP) within the premium zone of the active range, implying potential buildup for a bullish Impulse Drive.
▪︎ Daily Alignment: Daily price behavior mirrors the Weekly context, supporting a continuation thesis.
Preferred Scenario: Leaning towards a Retrace Precision Entry (RPE) before the Ascend Sequence resumes. Watching:
• Point A (shallow pullback) near B/C level, or
• Point B (deep pullback) into the pending Rejection Zone (ARB).
Invalidation Trigger: A structural breach below 3336, backed by bearish momentum and microstructure shift, targets first 3280, then levels below.
Uncertainty Variable: Will price first sweep 3433.2 before retracing? Or will it retrace from market open? This remains unclear and demands a patient, reactive stance.
📌 Disclaimer: This is a strategic directional bias, not financial advice. Execute only with confirmation and proper risk management.

Gold Futures Super Strong Resistance - Price Coming Back StrongGold Future has been very strongly pushing up without filling any gapes in the short side before pushing up more further.
One unique line is probably the target super strong resistance.
In a daily chart, probably better wait until it reaches that point to try to check for strong short entries maybe.
Still arriving there it would explode up even more further to transform that line into a super strong probable support.
Keep watching!
(Do we actually have to believe that gold is secretly targeting $10,000) in the Yearly Chart?... Since February 2022 it just went berserk!)

STRONG BUY | PALLADIUM Strategy: Impulse Correction
Direction: Bullish
Moving Average: Blue above Red
Fib Retracement: 38.2 reached
MACD > 0
Support : Finding additional confluence, as the weekly bounces off a massive support structure
1st Target = 1336
2nd Target = 1419
3rd Target = 1527
Lots: 0.2 (Plan to pyramid into this one)
RISK: Tariff Wars continue to hamper global growth as supply chains feel the brunt of the disruption.
Trade 4/20

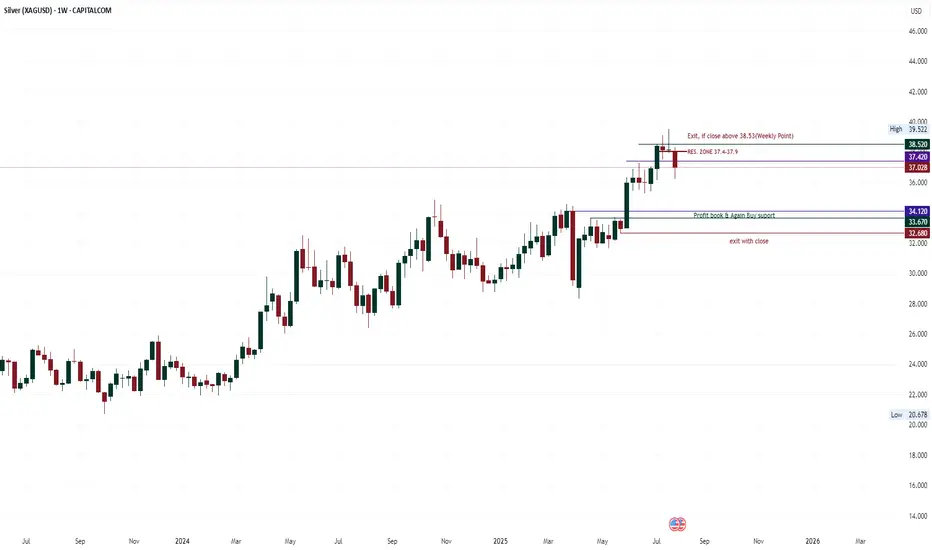
silver correction patternThere has been no close above 38.52 in the last 4 weeks, i.e. every weekend has closed below 38.52. The weekend candle of 7 July is an important candle, apart from this this week's candle has also closed below the low of 14 July, which also indicates a down sign, over all a resistance zone is shown from 37.42 to 37.95. This pattern can go down to 34.1 or 33.67. But use a strict weekend Stop loss of 38.52.
GOLD LONG TRENDAfter price correction and a downward movement that touched the 600 and 300 moving averages on the 4H chart, with a subsequent strong bullish candlestick reversal and a breakout above the MA200, we can expect the bullish trend to continue respecting the Fibonacci levels. In the coming week, upon the first touch of the 3350 price level, we may enter a long position. The price could potentially extend even beyond the specified level, reaching the 1.618 Fibonacci extension. The first target at 3396 seems the most probable scenario...

Oil (WTI) – Upcoming Buy OpportunityBased on the analysis I conducted using fractals, oil is expected to move upward and provide buyers with a 2% gain, equivalent to 140 pips.

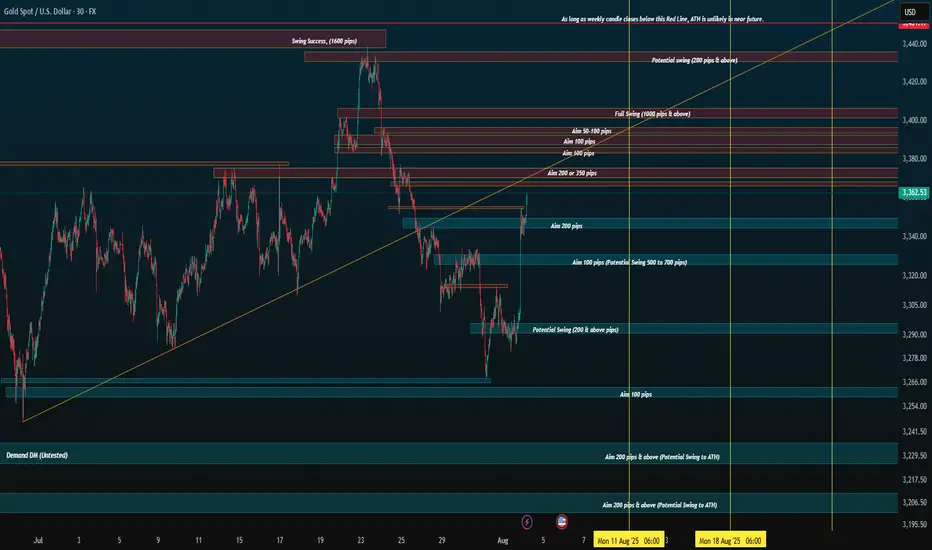
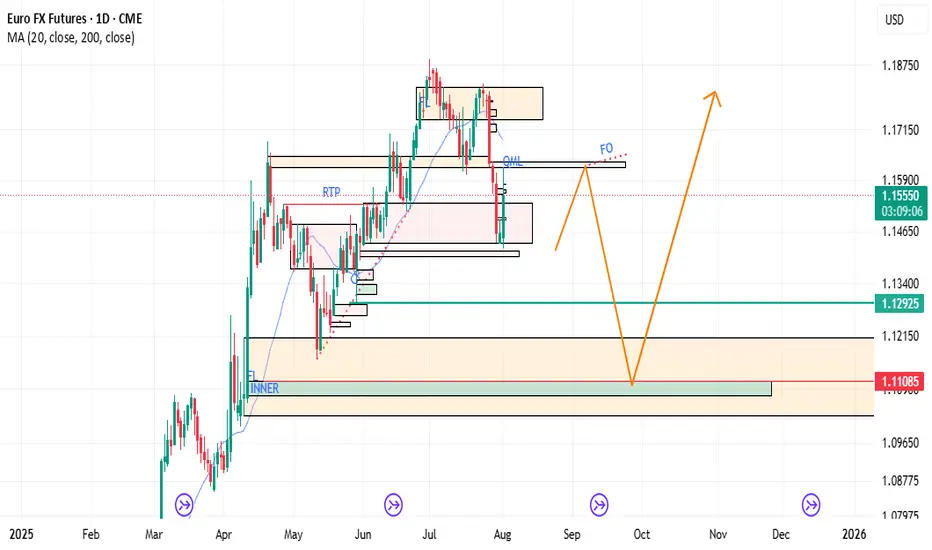
Revised and detailed zones (But messy)I'm very interested to see how August will end. If we break the red line (weekly body), then ATH is on the horizon.
I will only execute from the zones and how the price action coming towards the zone. Otherwise I will just ignore the chart.
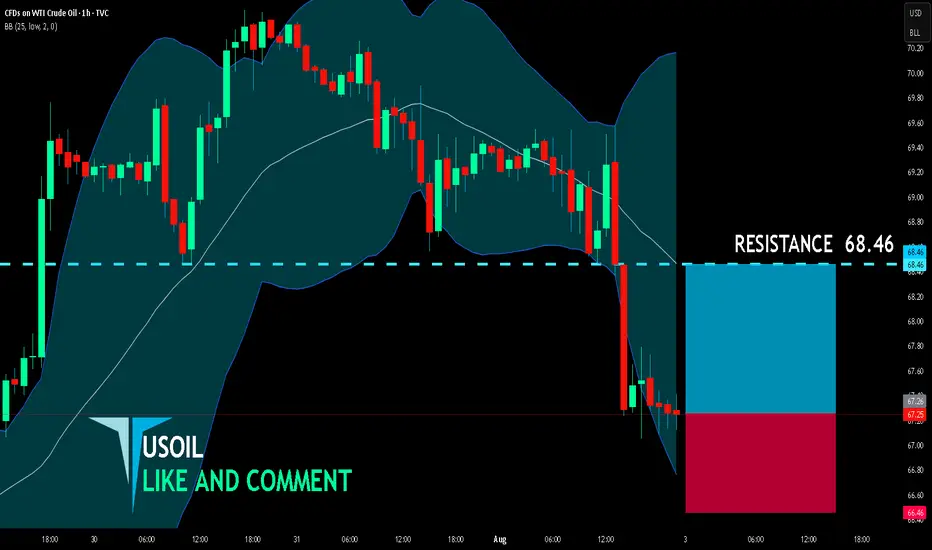
USOIL BULLS ARE STRONG HERE|LONG
USOIL SIGNAL
Trade Direction: short
Entry Level: 67.26
Target Level: 68.46
Stop Loss: 66.46
RISK PROFILE
Risk level: medium
Suggested risk: 1%
Timeframe: 1h
Disclosure: I am part of Trade Nation's Influencer program and receive a monthly fee for using their TradingView charts in my analysis.
✅LIKE AND COMMENT MY IDEAS✅
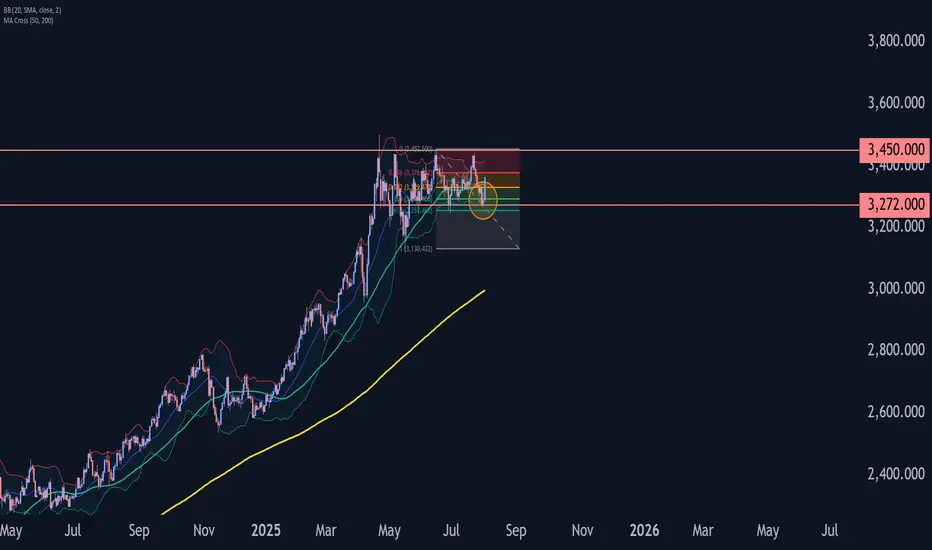
Gold Weekly Summary and Forecast 8/2/2025In monthly TF, gold has completed the full Elliot wave and it should go into a series of correction. But in 2W TF, it printed out a green bar. However, the trendline still valid. As long as the trendline is not broken, I am still bearish in gold in medium term.
Therefore, for next week, gold should first go up and should be capped at 3410. Price could quickly drop after that.
Let's see how the market plays out next week.

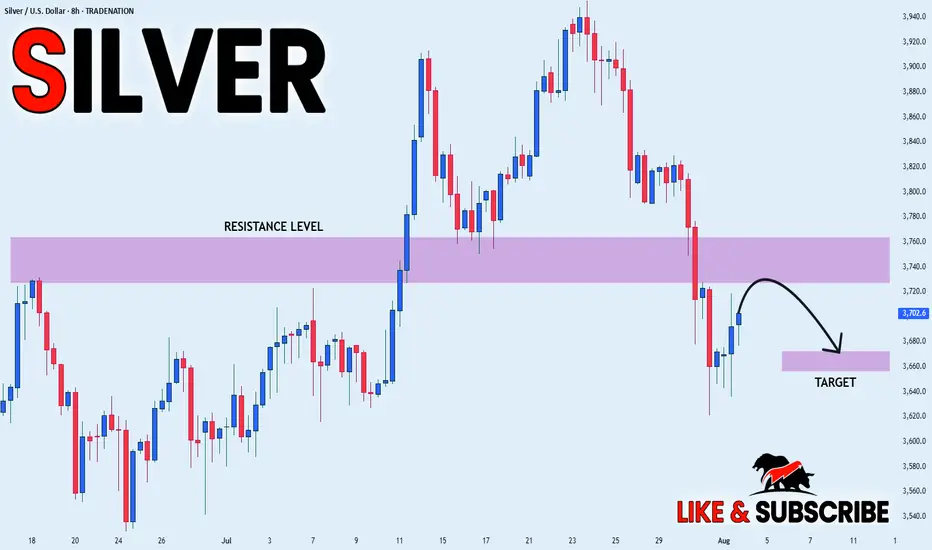
SILVER WILL FALL|SHORT|
✅SILVER is going up now
But a strong resistance level is ahead at 37,60$
Thus I am expecting a pullback
And a move down towards the target of 36,69$
SHORT🔥
✅Like and subscribe to never miss a new idea!✅
Disclosure: I am part of Trade Nation's Influencer program and receive a monthly fee for using their TradingView charts in my analysis.
#GOLD #XAUUSD Seems to have ended the correction FX_IDC:XAUUSD Gold Spot might have completed the correction as a complex 3-3-5 FLAT, and is currently turning higher in wave (ii), however this get invalidated if THE LAST LOW OF 3268.19 BREAKS. Till the pivot 3268.19 stays strong, the move should be impulsive and take us to new high near term.

Gold Wave Analysis – 1 August 2025
- Gold reversed from the support zone
- Likely to rise to the resistance level at 3450.00
Gold today reversed from the support zone between the support level 3272.00 (which has been reversing the price from the end of May), lower daily Bollinger Band and the 50% Fibonacci correction of the upward wave B from May.
The upward reversal from this support zone created the daily Japanese candlesticks reversal pattern, Morning Star.
Given the clear daily uptrend and the oversold daily Stochastic, Gold can be expected to rise to the next resistance level at 3450.00 (top of waves B and ii).
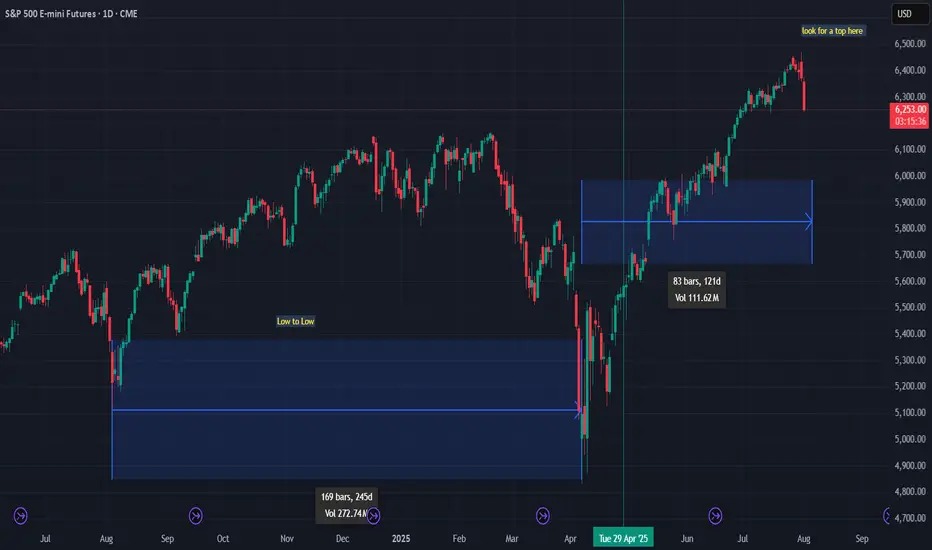
08/1/25 Trade Journal, and ES_F Stock Market analysis EOD accountability report: +440
Sleep: 6 hours
Overall health: Good
VX Algo System Signals from (9:30am to 2pm)
— 9:30 AM Market Structure flipped bearish on VX Algo X3!
— 10:12 AM VXAlgo ES X1 Buy signal
— 10:20 AM VXAlgo NQ X1 Buy Signal
—12:30 PM Market Structure flipped bullish on VX Algo X3!
— 1:00 PM Market Structure flipped bearish on VX Algo X3!
— 1:50 PM VXAlgo ES X1 Buy signal,
— 3:00 PM Market Structure flipped bullish on VX Algo X3!**
What’s are some news or takeaway from today? and What major news or event impacted the market today?
Market range expanded a lot today, we dropped over 100 points today and sometimes i forget to adjust my bracket orders to go for 10 -15 points take profits when the volatility is so high. But overall, it was a good day, I knew to be patient as market was wild and sometimes you want to just snipe a few trades and call it a day before you get caught on the wrong side.
The great thing about big moves is that it will eventually hit a major level and it will react really well, you just have to wait for it.
a great question is will the market recover? Or is going back down to April prices?
News
*STOCKS TUMBLE TO END THE WEEK, VIX SPIKES AS SOFT JOBS DATA STOKE ECONOMIC JITTERS
What are the critical support levels to watch?
--> Above 6330= Bullish, Under 6310= Bearish

Daily Orderflow on ES and NQ. 01.08.2025, NFP FridayCME_MINI:NQ1! CME_MINI:ES1!
Orderflow explanation. Sessional delivery and New York Price action

XAUUSDso Gold (XAU/USD) broke support, retested it as resistance, and is holding below. That’s a classic bearish continuation setup.
Structure: Market forming lower highs and lower lows, confirming bearish trend.
Bias: Strongly bearish while price trades under the broken support zone.
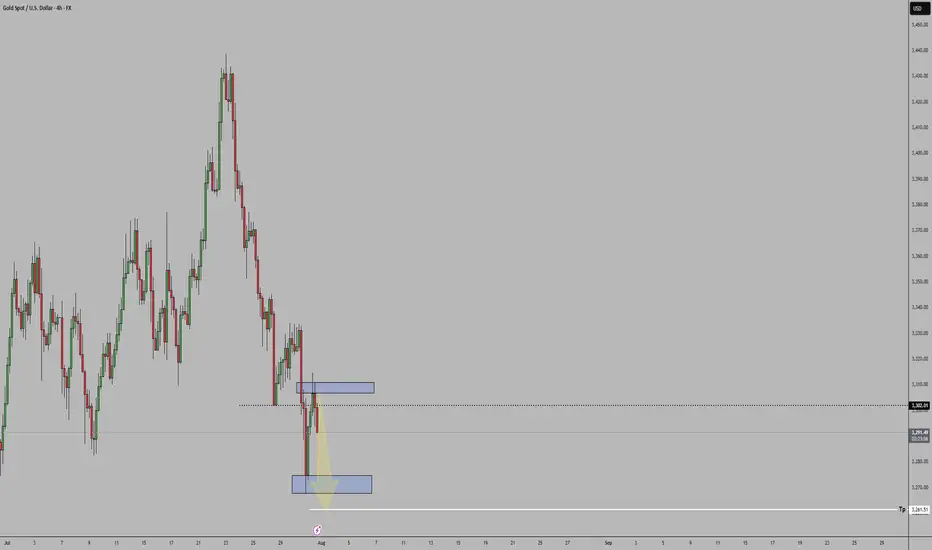

Today's Long in Gold! Perfect setup... Lower level support multiple times, Entry WITH small SL and the news followed... 3299- 3350 🚀

I think this strong rebound was a pullback I think this strong rebound was a pullback and the target is much lower.
ID: 2025 - 0158.1.2025
Trade #15 of 2025 executed.
Trade entry at 140 DTE (days to expiration).
Excellent fills this morning, well under mid. Created a GTC working order two days ago and let price come to me. No chasing. There are TONS of external liquidity voids resting below.
Target profit is 5% ROI
Happy Trading!
-kevin

looking for a possible top for SPX500 , cycle highlooking for a possible top for SPX500 , cycle high