NASDAQ Futures (/NQ) Outlook – Weekly Chart As of August 1,2025NASDAQ Futures (/NQ) Outlook – Weekly Chart
As of August 1, 2025
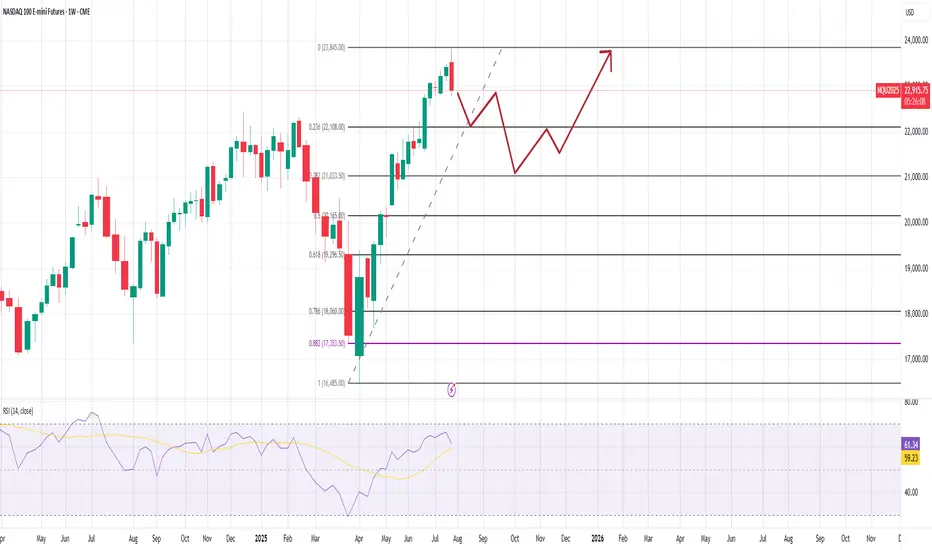
Current Price: 22,915.75
RSI (14): 61.34 – momentum remains bullish, but cooling off
🧭 Short-Term Outlook:
The recent weekly candle shows strong rejection and a -2.16% drop, suggesting a possible correction phase.
Price is now heading toward the 0.236 Fib retracement zone (~22,120) — a logical short-term support.
If this level doesn't hold, the next major support sits around the 0.382 zone (~21,045), aligning with your second expected zone (~21,000).
🛑 Support Levels to Watch:
~22,120 – Fibonacci 23.6%, prior structure zone
~21,000–21,045 – Confluence with 38.2% Fib + former resistance
~20,175 – 50% retracement, deeper retest if sentiment shifts
Mid-Term Bias (Q4 2025 Outlook):
After this pullback phase, your projected path implies:
A bullish resumption from the support levels (likely from 21k–22k zone)
Consolidation into Q4
A breakout continuation toward new highs above 24,000 into 2026
This outlook remains valid as long as 20,000 holds — a clean invalidation point for medium-term bulls.
Also, whenever the daily Candle closes above high of thid week which is the ~23845 points , this outlook become invalid too.
Futures market
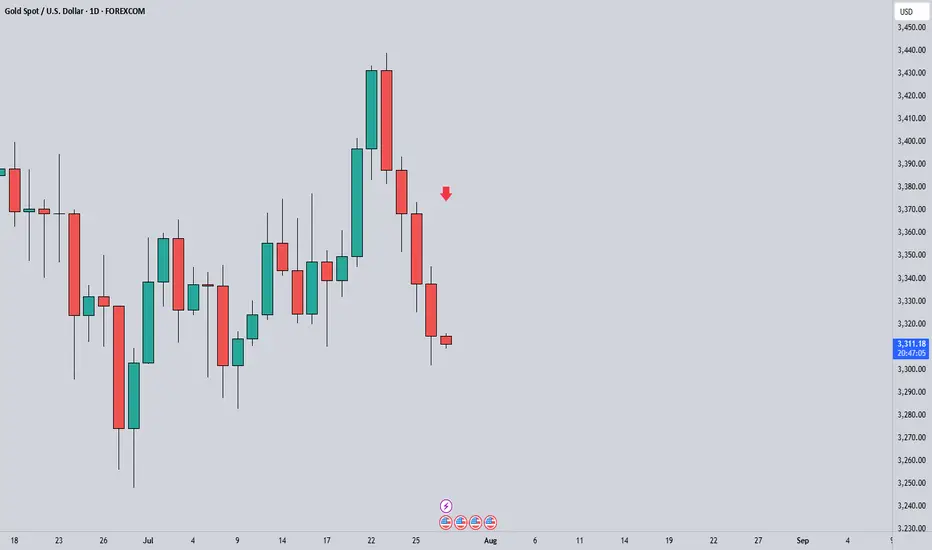
XAUUSD Short ProjectHi guys...😎
It's time to do a Short Project on XAUUSD with 3 key reasons:
1. Price Drivers: institutional shorting
2. Trend: down
3. Momentum: bearish
Action: waiting for entry on the intraday timeframe (entry will be published further)
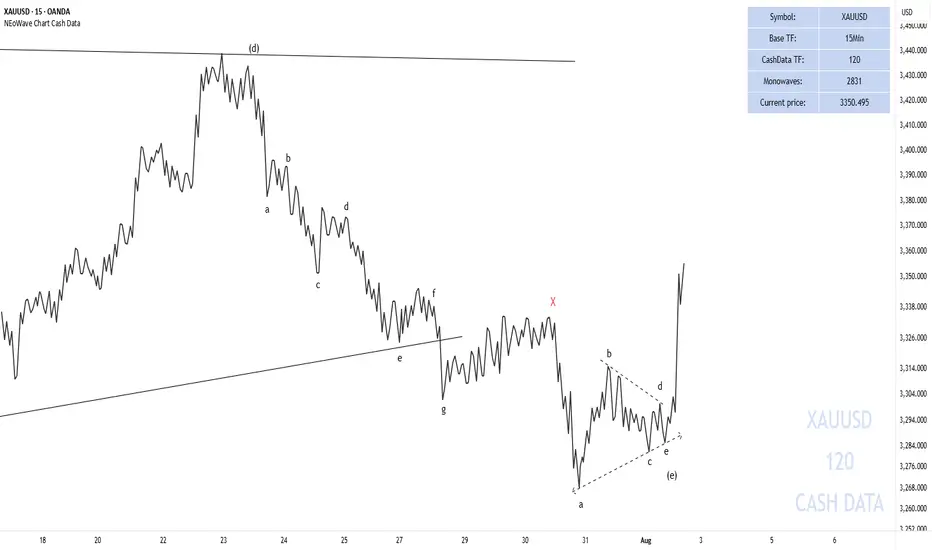
End of GOLD correction#GOLD #XAUUSD
UPDATE
As I mentioned earlier, gold was forming a contracting triangle.
The wave-(e) of the triangle has formed a double pattern diametric-X-triangle and has moved beyond my expectations (the post-pattern movement has passed ), breaking the trendline of (a)-(c). However, since it did not exceed the end of wave-(c), the contracting triangle has not been invalidated.
We expect gold to gradually rise from this range and surpass $3,500.
Good luck
NEoWave Chart
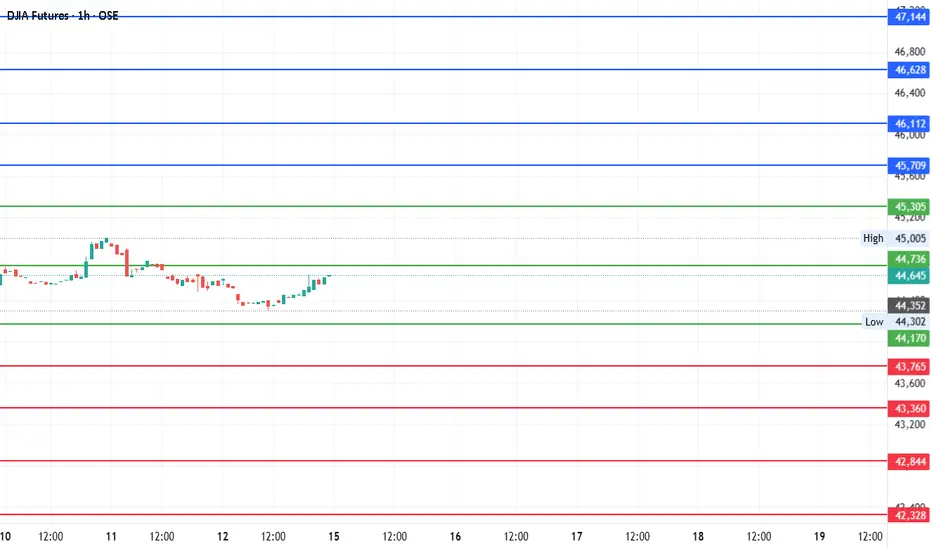
#DJI Futures Outlook: Key Levels to Watch Around Pivot 44,736Date: 14-07-2025
📊 Current Price: 44,645
📍 Pivot Point: 44,736.00
🔼 Upside / Bullish Scenario
If the price sustains above the pivot point (44,736), it could target the following resistance and bullish targets:
Immediate Resistance: 45,305.40
Target 1: 45,708.70
Target 2: 46,112.00
Target 3: 46,628.00
Target 4: 47,144.00
Bullish Bias Trigger: A break and hold above 45,305.40 increases confidence in these targets.
🔽 Downside / Bearish Scenario
If the price moves and holds below the pivot, the focus shifts to support levels and bearish targets:
Immediate Support: 44,170.04
Target 1: 43,765.02
Target 2: 43,360.00
Target 3: 42,844.00
Target 4: 42,328.00
Bearish Bias Trigger: A break below 44,170.04 opens the door to these downside levels.
#DowJones #TradingView #StockMarket #Investing #Trading #DJIFutures
#PivotPoints #DowJones #MarketOutlook #FuturesTrading
GOLD: Target Is Down! Short!
My dear friends,
Today we will analyse GOLD together☺️
The market is at an inflection zone and price has now reached an area around 3,353.10 where previous reversals or breakouts have occurred.And a price reaction that we are seeing on multiple timeframes here could signal the next move down so we can enter on confirmation, and target the next key level of 3,335.20..Stop-loss is recommended beyond the inflection zone.
❤️Sending you lots of Love and Hugs❤️

BITCOIN CME GAP IS FILLING RIGHT NOW!#Bitcoin CME Futures
Bitcoin is dipping — and all signs point to the CME gap getting filled.
Historically, these dips have been aggressively bought, so a strong bounce from here looks likely.


Understanding SMT Divergence In Trading1. Definition and Importance
SMT (Smart Money Technique) Divergence refers to a trading concept that involves identifying discrepancies between the price movement of correlated markets or instruments.
These discrepancies can signal potential market reversals or price manipulation. Specifically, it focuses on the divergence between price movements and indicators (like volume, momentum, or oscillators) in markets that typically move in sync.
In SMT Divergence, traders look for situations where two or more correlated instruments (like
Forex pairs, indices, or bonds) are moving in opposite directions. This "divergence" signals that
there may be a shift in market sentiment, liquidity manipulation, or an opportunity for price
correction.
The importance of SMT Divergence lies in its ability to detect hidden market dynamics that are
often manipulated by institutional players. By understanding these divergences, traders can
gain insights into potential market moves and position themselves accordingly.
2. The Relationship Between Correlated Markets
Understanding these relationships is crucial for identifying SMT Divergence:
Forex Pairs : Many Forex pairs have direct correlations. For example, EUR/USD and USD/JPY are often correlated in the sense that when the USD strengthens, both pairs may exhibit price movement in the same direction (EUR/USD decreases, USD/JPY increases). SMT
Divergence occurs when these pairs move in opposite directions, indicating that something
unusual is happening in the market (e.g., liquidity manipulation or market anticipation).
Indices : Stock market indices (like the S&P 500 or Dow Jones) and related instruments like futures or ETFs can show correlation. A divergence in these indices might indicate potential
trends or reversals, signaling that institutions are positioning themselves for a move in one
direction, and the market is showing resistance.
Bonds : The relationship between bond yields and currency pairs, for instance, can also show correlations. When bond yields move in one direction, certain currency pairs should
generally follow suit. Divergence in this relationship can reveal clues about market
intentions, such as shifts in interest rates or macroeconomic sentiment.
Commodities and Stocks : Commodities like oil and gold can often correlate with indices or specific stocks. For example, if oil prices rise and an energy sector index doesn’t move in the
same direction, this could be a sign of market inefficiencies or institutional positioning.
3. SMT Types
3.1. Bullish SMT Divergence
Bullish SMT (Smart Money Technique) Divergence occurs when one correlated asset forms a
higher low while another makes a lower low. This indicates that one market is showing hidden
strength, suggesting a potential reversal to the upside.
How to Spot Higher Lows in One Asset While the Other Makes Lower Lows:
1. Identify Two Correlated Markets – Choose two assets that typically move together, such as EUR/USD and GBP/USD or NASDAQ and S&P 500.
2. Look for Divergence – Observe when one asset makes a new lower low, while the other fails to do so, instead of forming a higher low.
3. Volume & Price Action Confirmation – Institutions may absorb liquidity in the weaker asset while the stronger one holds its ground.
4. Validate with Market Context – Look at macroeconomic conditions, liquidity pools, and institutional activity to confirm the setup.
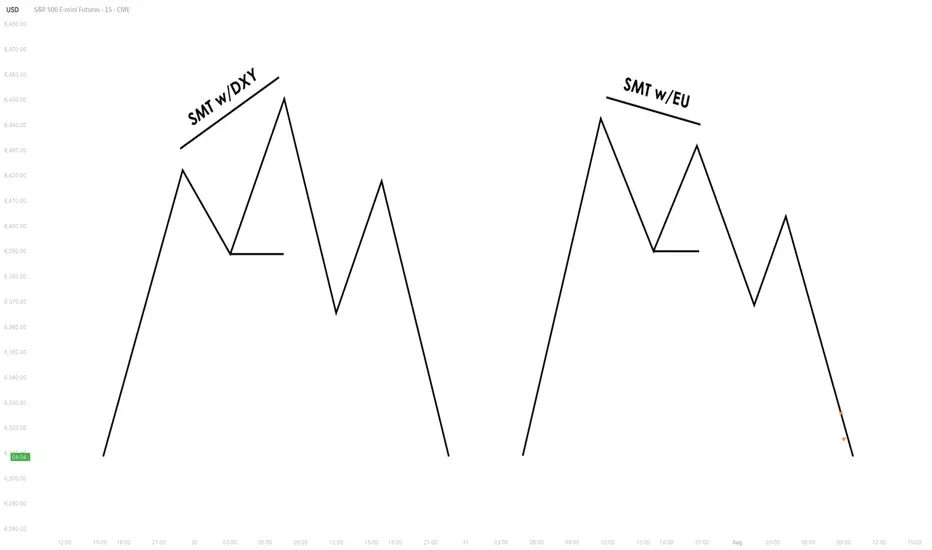
3.2. Bearish SMT Divergence
Bearish SMT Divergence occurs when one correlated asset forms a lower high while another
makes a higher high. This signals hidden weakness, indicating that the market may be setting
up for a bearish reversal.
How to Spot Lower Highs in One Asset While the Other Makes Higher Highs:
1. Find Two Correlated Markets – Common pairs include NASDAQ vs. S&P 500 or EUR/USD vs. GBP/USD.
2. Identify the Divergence – One asset makes a higher high, while the other fails to follow and forms a lower high instead.
3. Liquidity & Volume Analysis – Smart money may be using the stronger asset to attract buyers before reversing.
4. Confirm with Institutional Order Flow – Watch for liquidity grabs and imbalance zones.
3.3. Intermarket SMT
Definition : Divergence between assets from different markets, such as Forex vs. Commodities, Stocks vs. Bonds, or Indices vs. the U.S. Dollar.
Examples :
EUR/USD vs. DXY (U.S. Dollar Index) – If EUR/USD forms a higher low while DXY makes a
higher high, this suggests USD weakness and potential EUR/USD strength.
NASDAQ vs. S&P 500 – If NASDAQ makes a higher high but S&P 500 doesn’t, it can indicate
a weakening stock market rally.
Strength & Validity :
High validity because institutions hedge positions across different markets.
3.4. Intramarket SMT
Definition : Divergence within the same market (e.g., multiple Forex pairs or stock indices).
Examples :
EUR/USD vs. GBP/USD – If EUR/USD makes a lower low but GBP/USD doesn’t, it could
indicate bullish strength.
Dow Jones vs. S&P 500 vs. NASDAQ – If NASDAQ is making new highs while the Dow lags, it
may signal weakness in the broader stock market.
Strength & Validity :
Still valid but needs additional confirmation (liquidity sweeps, volume analysis).
4. SMT Divergence vs. RSI Divergence
Why SMT Is Superior to Traditional RSI Divergences
1. RSI Measures Momentum, Not Liquidity – RSI divergence is based on momentum shifts,
which institutions can easily manipulate with fake breakouts or engineered price moves.
2. SMT Focuses on Market Structure & Liquidity – SMT divergence detects institutional
positioning by comparing correlated assets, making it harder to manipulate.
3. RSI Can Remain Overbought/Oversold for Long Periods – Markets can continue trending
despite RSI divergence, while SMT divergence often provides stronger reversal signals.
How Smart Money Manipulates Classic Divergence Traders
Liquidity Sweeps – Institutions use RSI divergence to lure retail traders into premature
reversals before executing stop hunts.
False RSI Signals – In trending markets, RSI divergences often fail, while SMT divergence
provides a more contextual view of smart money positioning.
5. Using TradingView for SMT Analysis
To effectively analyze SMT divergence, traders should monitor at least two correlated assets
simultaneously.
TradingView makes this easy by allowing multiple chart layouts. Steps to Set Up Multiple Charts in TradingView:
a. Open TradingView and click on the “Select Layout” button.
b. Choose a two-chart or four-chart layout to compare correlated assets.
c. Sync timeframes across all charts for consistency.
d. Adjust scaling to ensure price action is easily comparable.
Best Pairs to Compare for SMT Analysis:
Forex : EUR/USD vs. GBP/USD, USD/JPY vs. DXY
Indices : NASDAQ vs. S&P 500, Dow Jones vs. S&P 500
Commodities & FX : Gold (XAU/USD) vs. USD/JPY
Bonds & Equities : 10-Year Treasury Yield vs. S&P 500
6. Key Takeaways
SMT divergence reveals institutional intent by showing liquidity accumulation or
distribution through correlated assets.
Bullish SMT occurs when one asset makes a lower low while the other does not, signaling a
potential reversal up.
Bearish SMT occurs when one asset makes a higher high while the other does not, signaling
a potential reversal down.
Best markets for SMT analysis include Forex pairs, indices, commodities, and bonds, where
correlations are strongest.
SMT is most effective near key liquidity levels, such as session highs/lows, order blocks, and
fair value gaps.
SMT is more reliable during high-impact news events, London & New York sessions, and
quarterly shifts, where institutional activity is highest.
SMT is superior to RSI divergence because it reflects real liquidity dynamics, whereas RSI
can produce false signals.
Combining SMT with market structure shifts like BOS and CHoCH increases trade accuracy
and reliability.
Risk management in SMT trading requires stop-loss placement beyond liquidity grabs and a
minimum 2:1 risk-reward ratio.
Mastering SMT helps traders avoid liquidity traps, improve precision, and align with smart
money moves.
SMT divergence is the footprint of smart money—where one market whispers the truth while the other follows the herd.
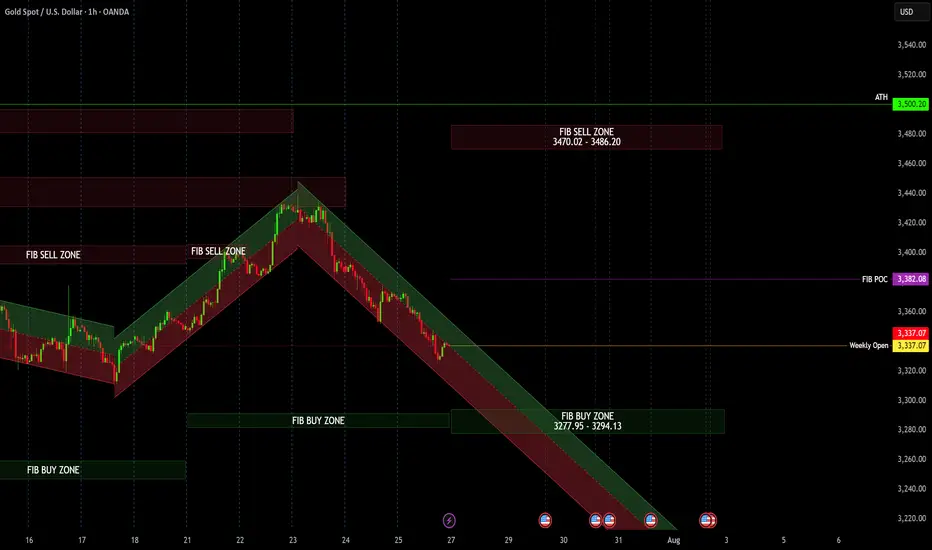
Gold weekly outlookFib Buy and Sell zones for the week ahead. Pay attention to a change in trend. Mondays are usually no trade days and just to watch the market decides.
XAUUSD
XAUUSD Updated in 30M :
The gold signal is marked on the chart based on the latest price changes and the supply and demand in the market. These points include the entry point, stop loss, and take profit.

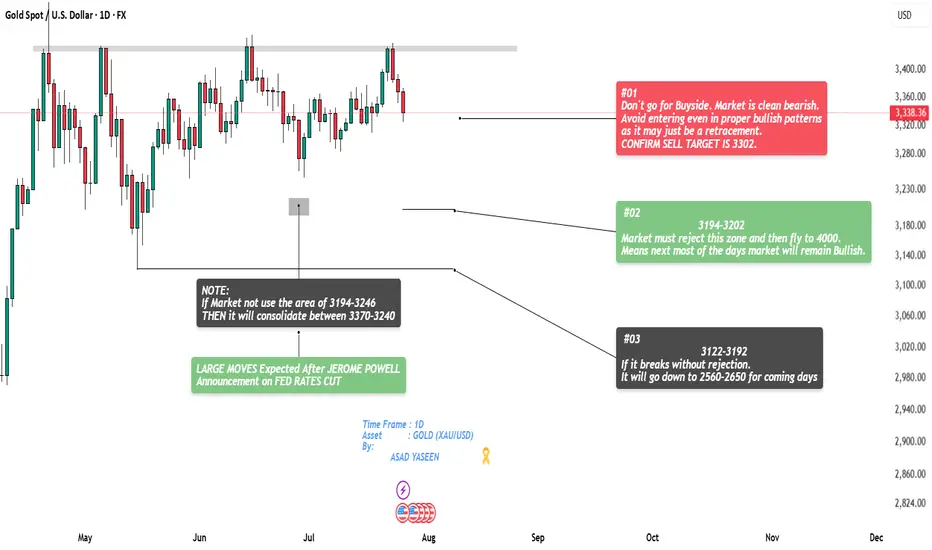
Gold at Major Turning Point – Breakdown or Reversal Incoming?🔥 GOLD (XAU/USD) Daily Analysis – July 27, 2025
By: Asad Yaseen | Timeframe: 1D
Gold is currently positioned at a crucial turning point, and price action over the next few days will determine the medium-term direction. Here's a breakdown of all possible scenarios based on key supply-demand zones and institutional behaviour:
🔴 Scenario #01 – Bearish Bias Active (Confirmed Setup)
📉 Market Structure: Bearish
The current trend is clearly bearish, with no strong signs of reversal. Even if bullish patterns appear, they are likely just short-term retracements.
confirmed short target is 3302.
going long unless deeper zones show clear rejection.
🟢 Scenario #02 – Possible Bullish Rejection Zone
📍 Key Zone: 3194 – 3202
If the market tests and rejects this demand zone, a strong upside move is expected. This could mark the start of a rally toward 4000+, indicating a shift in macro sentiment.
A bullish rejection here would favour trend reversal trades.
⚫ Scenario #03 – Bearish Expansion Below Demand
📍 Breakdown Zone: 3122 – 3192
If price breaks below this zone with no rejection, expect a deeper drop. Targets are set between 2650 – 2560 in the coming days. Setup for swing or position traders waiting for clean continuation signals.
⚠️ Neutral Consolidation Warning
If price does not engage the 3194–3246 zone, expect sideways movement between 3370 – 3240 with low momentum.
📰 Fundamental Catalyst to Watch:
Expect major volatility after Jerome Powell’s FED Rate Cut announcement.
This news event may trigger massive liquidity shifts and trend-defining moves.
💡 Reminder for Traders:
Trade with structure, not emotions. Watch how price reacts at key levels and align with macro bias.
No confirmation = no trade.
📈 If you find this analysis helpful, don’t forget to like & follow for more high-probability setups.
Drop your thoughts or questions below 👇
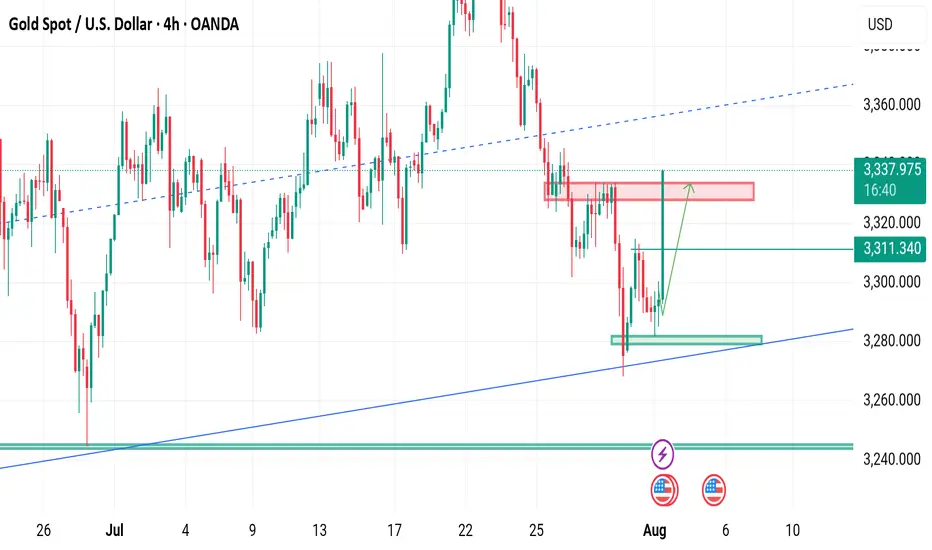
Gold Rejected 3280… What’s Next?Price tapped into the key demand zone and bounced hard—exactly what we wanted to see.
Now the question is.
Is Gold ready to reclaim the highs?

Possible Gold Reaction Scenarios to Today's Jobs ReportMarket expectations for today's nonfarm payrolls change to be 104k, with the unemployment rate projected to rise to 4.2% from 4.1%. The divergence between payroll growth and the unemployment rate is mainly due to the birth-death model used in payroll calculations and expectations for either a halt or rebound in the labor force participation rate.
Fed Chair Powell recently stated that the "main number to watch" is the unemployment rate, which raises its importance in today’s data release. If the participation rate rises sharply, the unemployment rate could even increase to 4.3%, which may put a cap on the recent rally in the dollar index.
There is also a risk that a very strong payrolls number could be released alongside a rise in the unemployment rate. This combination may trigger a volatile and uncertain market reaction with multiple direction changes.
In similar past scenarios, markets typically reacted first to the payrolls data, then shifted focus to the unemployment rate shortly after.
For gold, look for 3310 and 3288 as pivot levels that could open the door to 3342 on the bullish case and 3270 on the bearish case.

Closing all my orders in profits I mentioned throughout Today's commentary session:
My strategy is still the same – i took buy from 3290-3294
Very happy with the profits so far.
My medium-term targets remain 3335-3345 which is achieved 300 pips achieved alhumdullilah.
All I say thanks to those who followed us and made profits.
Gold Market Rejected at 3310 as Bearish Channel HoldsGold market faced rejection at 3310, failing to break above the bearish channel, as DXY strength continues to weigh on price action. The inability to sustain above key levels reflects ongoing bearish pressure, unless a clear break occurs.
🔍 Key Insight:
3310 acts as a short-term ceiling
DXY strength supports the bearish stance, follow for more insights coment and boost idea .


Gold is now buy position 40 to 50 pipsGold is now buy position 40 to 50 pips
If you wanted to learn about this analysis system fell free contrect with me .

Bearish Sentiment For GoldGold breaks daily trendline leaving a bearish engulfing pattern last Wednesday July 30, Expecting the price go down for correction. In my opinion, Gold will be BEARISH this coming August up to October. This is just my theory.

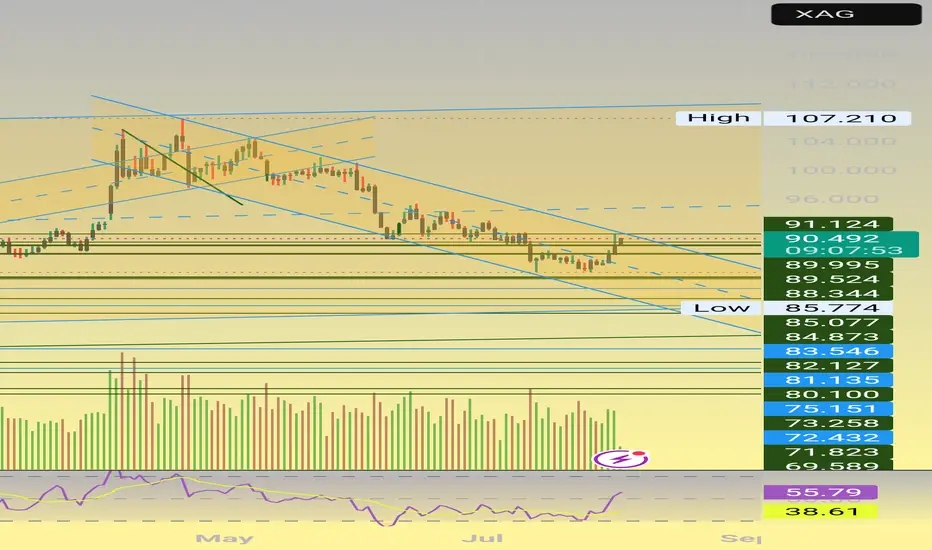
GOLD/SILVER RATIO TESTING CHANNEL BOUNDARYReasonable chance for ratio to turn lower here i.e. Silver to outperform Gold on a retracement. However, close to breaking the channel i.e. all collapses, Silver tanks.
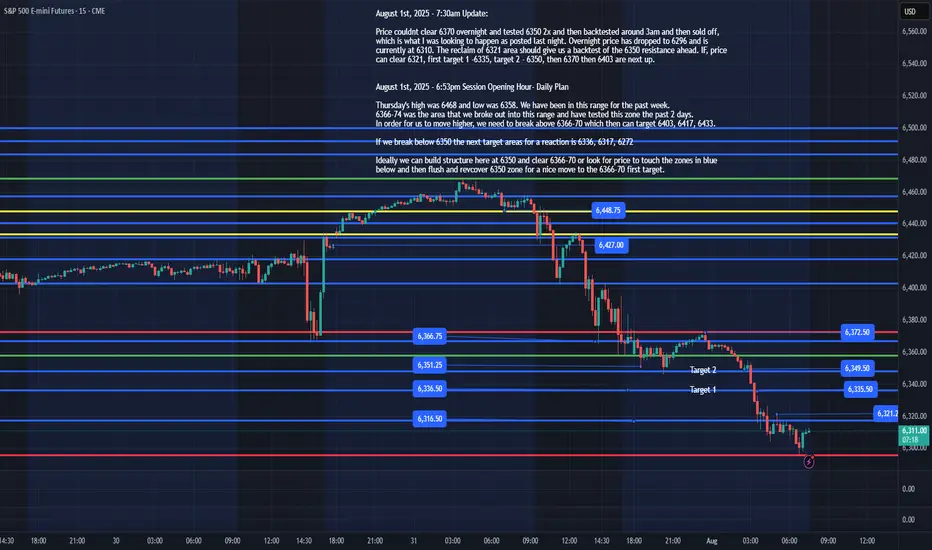
ES - August 1st Daily Plan Update - 7:35amAugust 1st, 2025 - 7:35am Update:
Price couldn't clear 6370 overnight and tested 6350 2x and then back tested around 3am and then sold off, which is what I was looking to happen as posted last night. Overnight price has dropped to 6296 and is currently at 6310. The reclaim of 6321 area should give us a back test of the 6350 resistances ahead. IF, price can clear 6321, first target 1 -6335, target 2 - 6350, then 6370 then 6403 are next up.
IF, we lose 6296, we would want to see a reclaim of it to enter a trade. IF, ES sells off today, better to get out the way and wait for price to reclaim 6296.
August 1st, 2025 - 6:53pm Session Opening Hour- Daily Plan
Thursday's high was 6468 and low was 6358. We have been in this range for the past week.
6366-74 was the area that we broke out into this range and have tested this zone the past 2 days.
In order for us to move higher, we need to break above 6366-70 which then can target 6403, 6417, 6433.
If we break below 6350 the next target areas for a reaction is 6336, 6317, 6272
Ideally, we can build structure here at 6350 and clear 6366-70 or look for price to touch the zones in blue below and then flush and recover 6350 zone for a nice move to the 6366-70 first target.
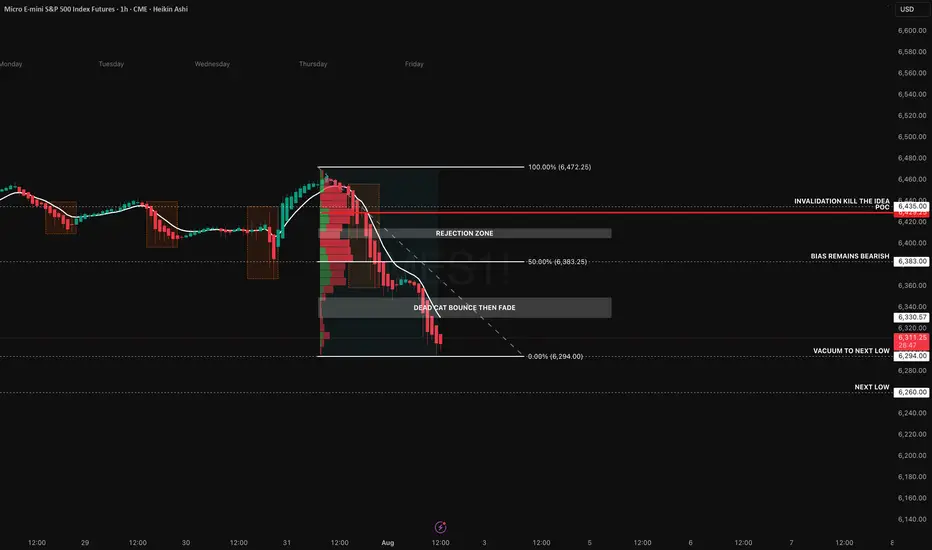
Structure Says Short… But Will News Flip the Script?Price continues to unwind following Thursday’s distribution, where we saw clear seller control above the 6420–6430 zone. Heikin Ashi candles show strong trend conviction with no upper wicks, and the EMA stack remains fully bearish. We're now pressing into the 0% Fibonacci extension at 6294, with the next low sitting around 6260 a clean vacuum zone that could fill quickly if the trend accelerates.
The volume profile from the breakdown range highlights 6429.25 as the point of control, acting as our primary rejection zone. Any pop into the 6383–6420 area will likely meet resistance. That’s our “dead cat bounce then fade” zone a textbook retracement rejection setup. Unless we reclaim 6435+ with conviction, the short bias remains intact.
We’re already short from 6306, targeting 6260. Stops are invalidated on a strong reclaim above the 6435 level.
However, today brings serious macro risk:
Trump has announced sweeping new tariffs on 92 countries, including 35% on Canada and 39% on Switzerland, triggering equity market anxiety. These surprise trade actions could cause intraday spikes or violent reversals, especially if retaliatory news drops intraday.
Amazon’s Q2 earnings missed cloud revenue expectations, putting pressure on tech futures.
U.S. Non farm Payrolls (NFP) are due at 8:30 AM ET, with expectations at +110K and unemployment ticking up to 4.2%. A strong jobs print could derail September rate cut hopes and add fuel to downside continuation or completely reverse sentiment.
We’re aware of this news risk and will adjust intraday. No stubborn bias here. But structurally, price is still in a trend, and this setup favours continuation unless macro flips the table.
My Setup Summary:
- Bias: Bearish (Trend Continuation)
- Entry: 6306 (Short)
- Target: 6260
- Invalidation: 6435 reclaim
- Confluence: POC rejection, Fib retrace, bearish EMAs, weak retrace structure
- News Risk: Tariffs, Amazon earnings miss, NFP at 8:30 AM ET
Good luck today and hope that we end the week profitable.