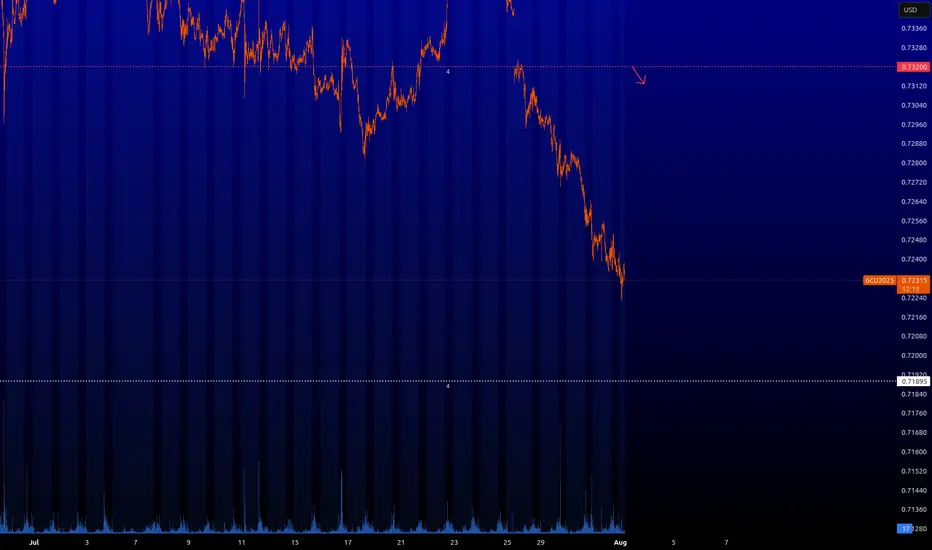
6C : Short levelIt is possible to take a short-term short from the red level with an arrow. I would recommend taking short-term trades and not sitting around waiting for huge profits. But this is already at your discretion.
⚠️ VOLATILITY WARNING ⚠️
Trading around major news can be extremely unpredictable. Trade responsibly!
Futures market
August 1, 2025 - XAUUSD GOLD Analysis and Potential Opportunity🔍 Key Levels to Watch:
• 3323 – Resistance
• 3309 – Resistance
• 3300 – Psychological level
• 3295 – Resistance
• 3283 – Key support
• 3268 – Short-term support
• 3260 – Support
• 3245 – Major support
• 3233 – Support
📈 Intraday Strategy:
• SELL if price breaks below 3283 → target 3280, then 3275, 3268, 3260
• BUY if price holds above 3286 → target 3289, then 3295, 3300, 3305
👉 If you find this helpful or traded using this plan, a like would mean a lot and keep me motivated. Thanks for the support!
Disclaimer: This is my personal view, not financial advice. Always use proper risk control.
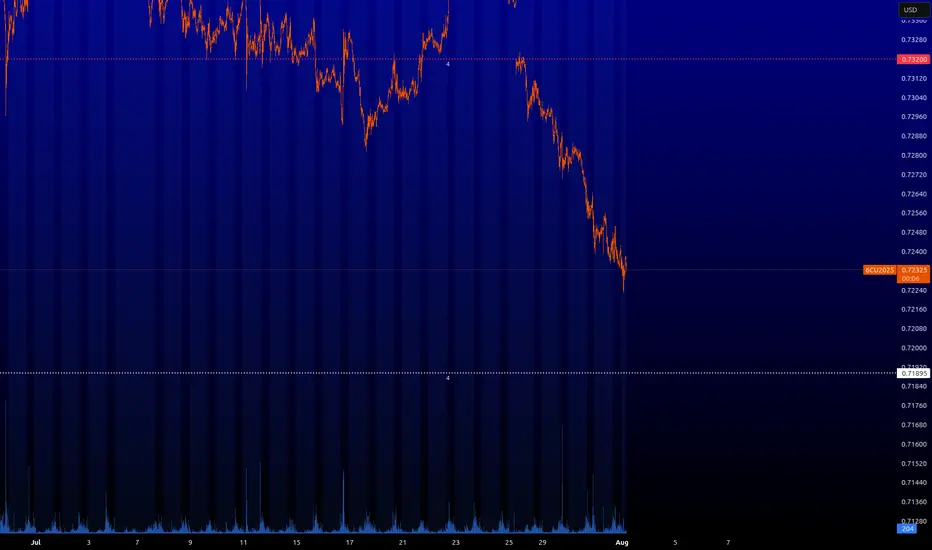
6C : Key levelsThat's the picture on this tool. This instrument will walk on other levels and will see them, but when it will be possible to trade confidently from them, I will tell you. For now you can observe and use them in YOUR trading system.
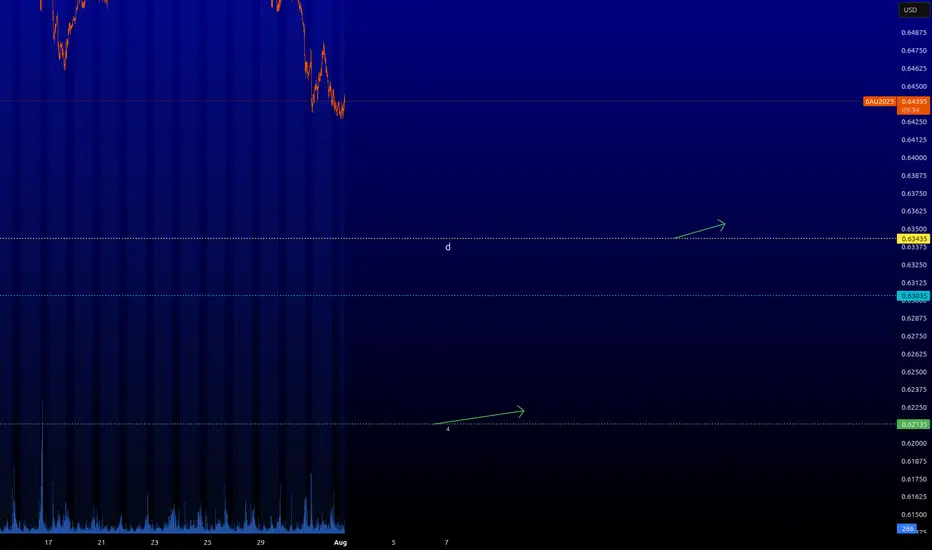
6A : Key LevelsThat's the picture on this tool. It is possible to take short-term longs from two levels with arrows. I do not recommend trading them on Forex. The spread can eat up all the profit.
⚠️ VOLATILITY WARNING ⚠️
Trading around major news can be extremely unpredictable. Trade responsibly!

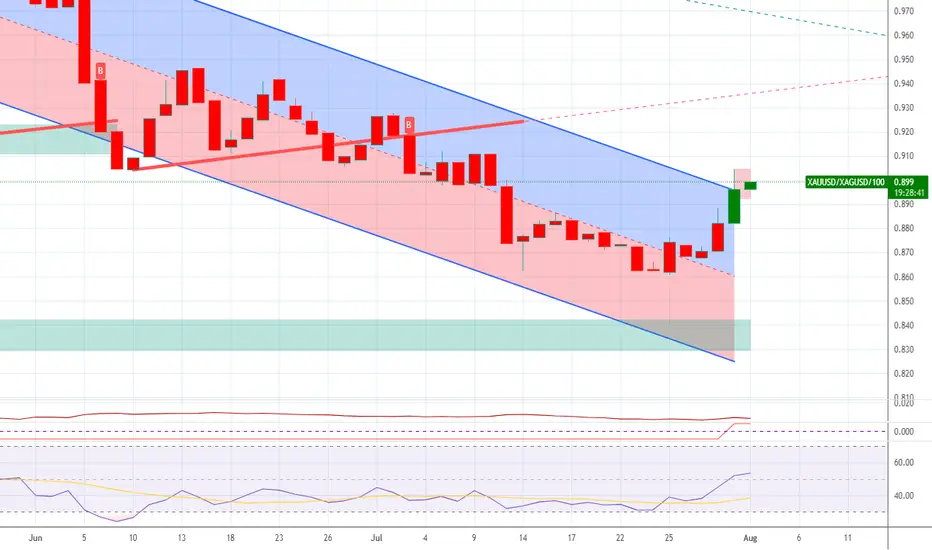
Gold vs Silver LongXAU vs SI is now net long on the regression break.
This indicates that the gold is likely to gain in value faster than Silver.
I have invert these trades.
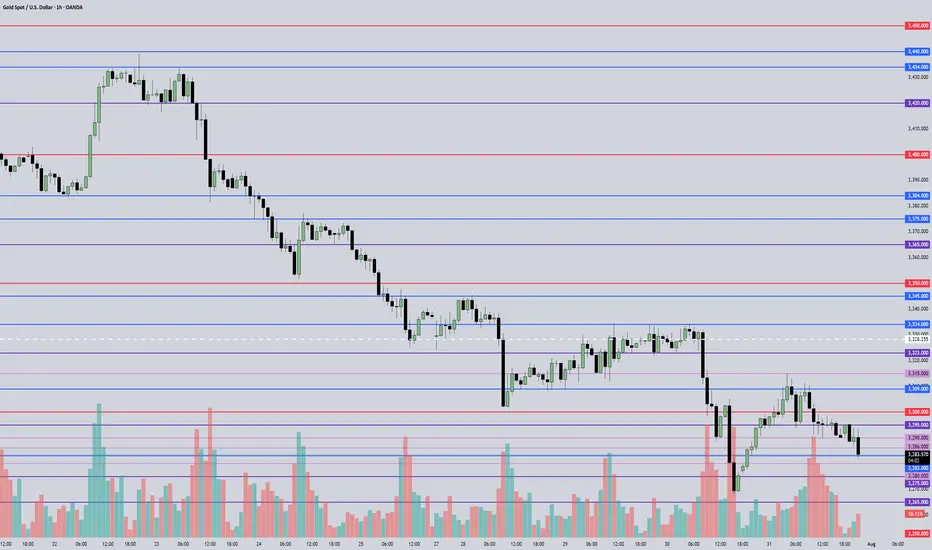
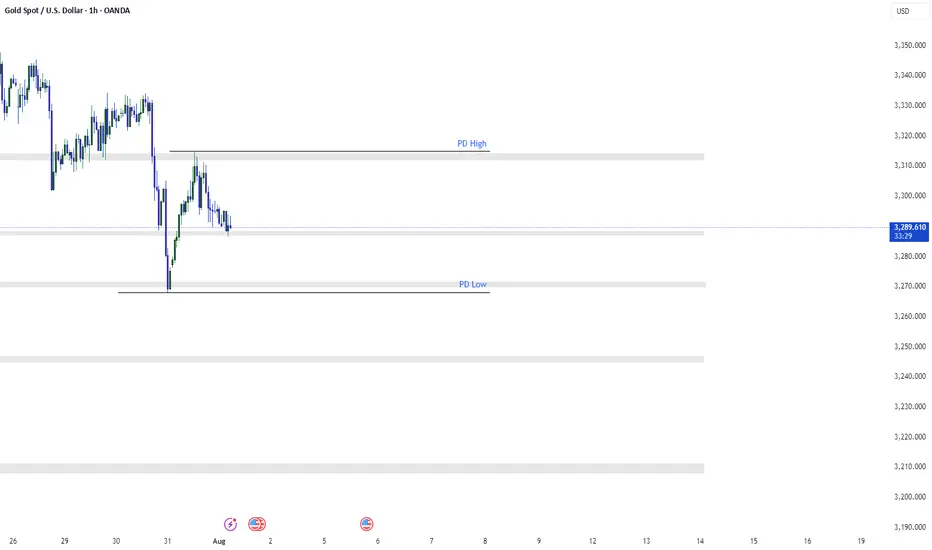
XAUUSD 1H AnalysisPrice is consolidating between PD High and PD Low after a recovery from the recent drop. No clear direction yet as market is ranging.
Key Levels:
PD High – 3315: Acting as resistance
PD Low – 3267: Acting as support
Current Price – 3290
Trade Ideas:
Sell if price rejects 3305 again, targeting 3265
Buy only on breakout and retest above 3305
Avoid trading inside 3275–3295 unless a clean setup forms
Bias: Neutral for now. Let price come to the edges and show a clear reaction.
Oil prices rebound, maintain bullish attitude
💡Message Strategy
International oil prices continued their upward trend on Thursday, closing higher for the fourth consecutive day, as concerns about growing global supply tightness abounded. Brent crude for September delivery rose 0.4% to $73.51 a barrel, while West Texas Intermediate (WTI) crude for September delivery rose 0.5% to $70.37 a barrel, while the more active Brent October contract rose 0.4% to $72.76 a barrel.
Recently, the market has focused on the statement of US President Trump, who demanded that Russia make "substantial progress" on the situation in Ukraine within 10-12 days, otherwise he would impose 100% secondary tariffs on its trading partners, significantly bringing forward the previous 50-day deadline.
Inventory data suggests a continued struggle between supply and demand. Data from the U.S. Energy Information Administration (EIA) showed that U.S. crude oil inventories unexpectedly rose by 7.7 million barrels to 426.7 million barrels in the week ending July 25, far exceeding expectations for a 1.3 million barrel drop. However, gasoline inventories fell by 2.7 million barrels to 228.4 million barrels, exceeding market expectations for a 600,000 barrel drop.
📊Technical aspects
From a daily perspective, WTI crude oil prices have closed higher for four consecutive days since rebounding from the $66 level. It is currently running stably above the integer mark of $70 per barrel. The short-term moving average system is in a bullish arrangement, and the MACD indicator remains above the zero axis, indicating that the bullish momentum is still strong.
From an hourly perspective, if the price breaks through the previous high of $70.50, it is expected to further rise to the $73.50-$75 range. Conversely, if it continues to fall below the $70 mark, it may trigger short-term profit-taking, and further support will focus on the $68.50 level. Overall, the short-term trend remains bullish.
💰Strategy Package
Long Position:68.00-68.50,SL:67.50,Target:70.50-73.00

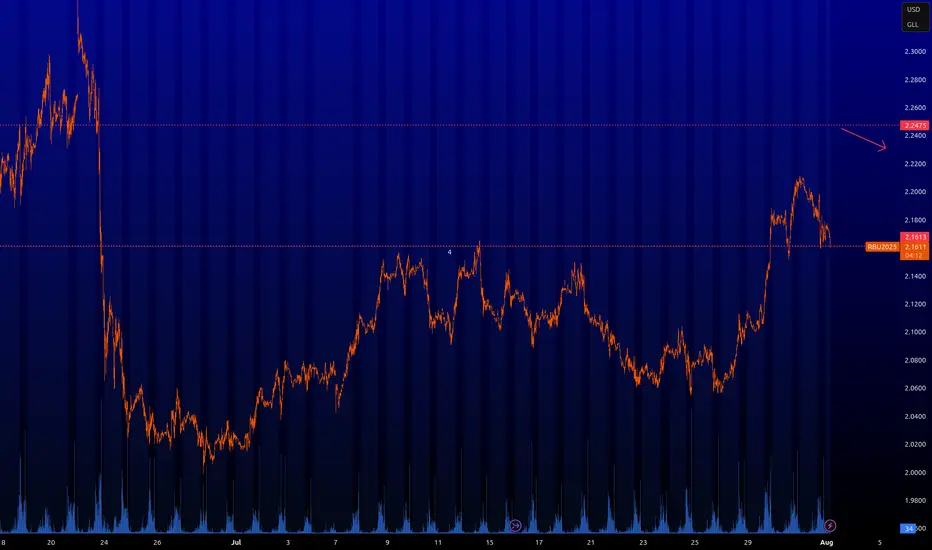
RBOB : Key levelsHere are the key levels that the market will be interested in. We can scalp from 2.2475. I have never traded this instrument, I do not know the specifics, but the level will be interesting. We can expect a bounce from it. I am more interested if it becomes inactive.
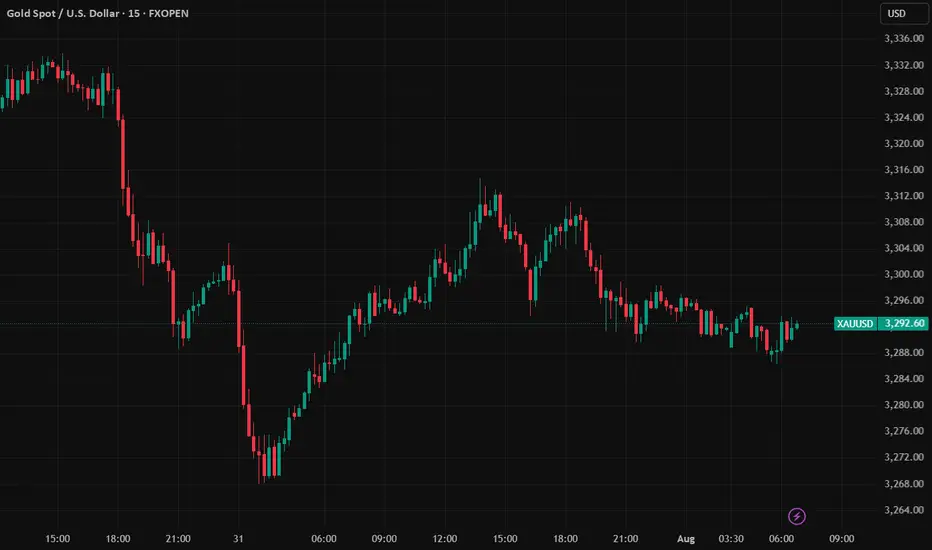
XAUUSD Quick Update Price: 3,291.33 (+1.12, +0.03%)
Range: 3,289.93 (Low) → 3,293.56 (High)
Key Takeaways:
Neutral-Bullish Bias: Price holding above 3,290.00 support, testing 3,293.56 resistance.
Breakout Watch:
BUY if price clears 3,293.56 (target 3,296.00).
SELL only if 3,290.00 breaks (target 3,288.00).
Low Volatility Alert: Tight range → Wait for confirmed momentum!
Fundamental Catalyst:
Keep an eye on USD moves (Fed speeches, NFP expectations).
Trade safe! #Gold #Forex #Trading
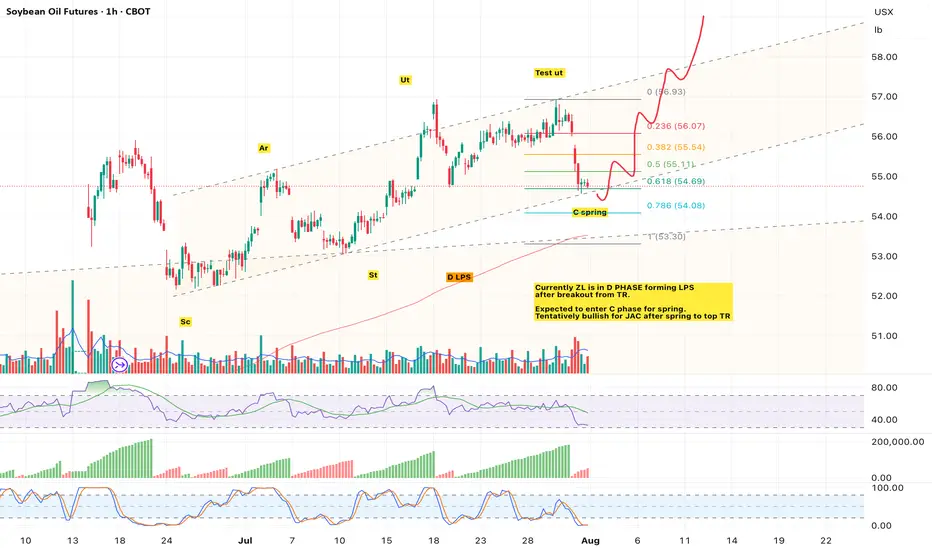
ZL ON LAST POINT OF SUPPORTExpected to enter C phase and rebound to top TR for JAC before continuing markup.
GC : Key levelsHere are the key levels that the market will be interested in. You can scalp from 3.472.
⚠️ VOLATILITY WARNING ⚠️
Trading around major news can be extremely unpredictable. Trade responsibly!
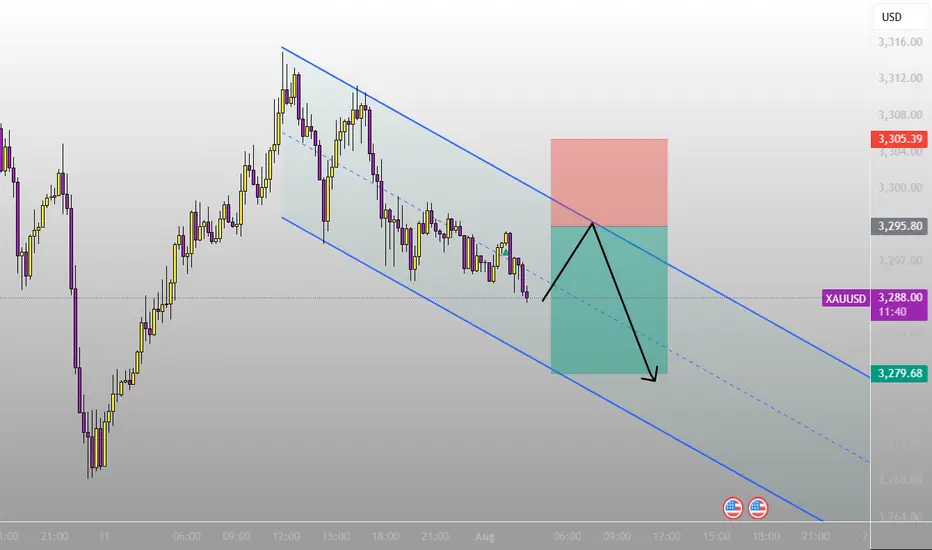
#XAUUSD Technical Analysis📈 Summary:
Gold continues to present favorable short-term opportunities within a defined range structure. During the recent session, price action dipped towards the #3,286.00 area, where it found temporary support and initiated a modest bullish bounce. My initial short positions from the #3,314.70 resistance zone delivered quick scalping profits into the lower #3,290.00 area, and from there I monitored for potential buying setups around the demand belt of #3,285.00 - #3,288.00. I executed aggressive scalps from this range and closed partials as price flirted with the #3,292.80 zone. No major continuation was seen, so I preserved capital and stayed light ahead of upcoming directional confirmation.
🔍 Technical Analysis:
Gold remains under pressure as long as the #3,314.70 - #3,320.00 zone acts as resistance. The 4H structure remains in a short-term downtrend, with lower highs and lower lows, although price is attempting to stabilize around key support at #3,285.00. This is an inflection area, as failure to hold could push Gold further down into the #3,250.00 monthly support target.
Upside scenarios remain valid only if we see a clean break and 4H candle close above #3,302.00 followed by #3,314.70. In that case, a potential test towards #3,331.00 - #3,333.70 resistance zone becomes viable. Until then, price remains trapped in a corrective channel with overlapping price action.
Bearish Continuation Path:
Break below #3,285.00 support would likely trigger stops and drive price down to #3,270.00 and ultimately #3,250.00, completing a full correction leg.
Bullish Reversal Path:
Sustained trading above #3,302.00 with momentum above #3,314.70 would invalidate immediate bearish bias and shift short-term trend to bullish with target zones at #3,331.00 and #3,333.70.
Conclusion:
Gold is in a wait-and-react zone. Bias remains slightly bearish under #3,302.00 but ready to flip should bulls regain control above #3,314.70. Key volatility expected as fundamental catalysts (Fed, NFP, geopolitical tension) are still unfolding.
📌 Disclaimer:
Forex and commodity markets carry significant risk and are not suitable for all investors. Past performance is not indicative of future results—trade wisely and always use proper risk management
YM : Key levelsHere are the key levels that the market will be interested in. From the green zone it is ideal to look for longs. As it will be possible to enter somewhere by limitation and take some profit, I will inform you.
⚠️ VOLATILITY WARNING ⚠️
Trading around major news can be extremely unpredictable. Trade responsibly!
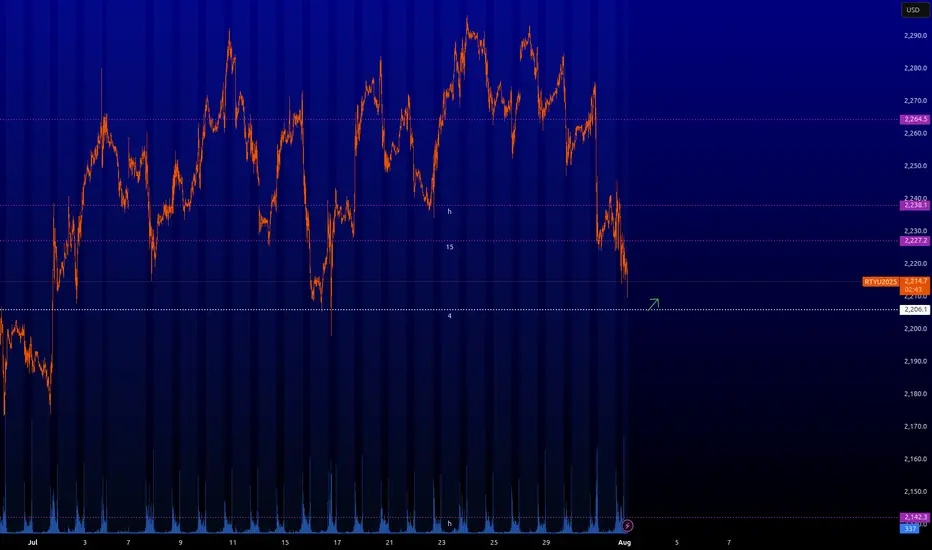
RTY : Key levelsHere are the key levels that the market will be interested in. From ~2.206 you can take scalping longs. Also interesting longing levels are forming now. I will let you know when they are formed and when they will be in play.
⚠️ VOLATILITY WARNING ⚠️
Trading around major news can be extremely unpredictable. Trade responsibly!
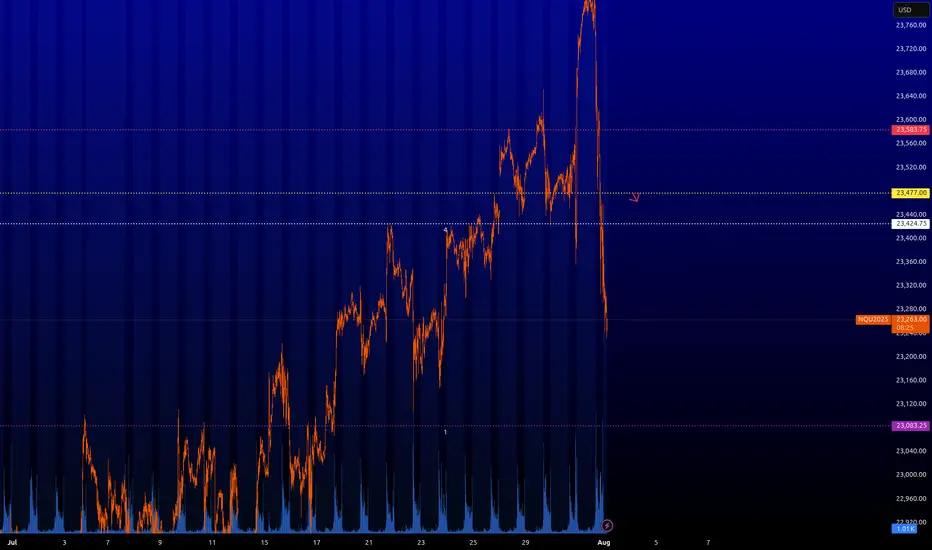
NQ : Key levelsHere are the key levels that the market will be interested in. From the yellow level ~23.477 you can already look for shorting trades. However, I would be careful with shorts on US indices. The other levels are still risky for limit order trading.
⚠️ VOLATILITY WARNING ⚠️
Trading around major news can be extremely unpredictable. Trade responsibly!
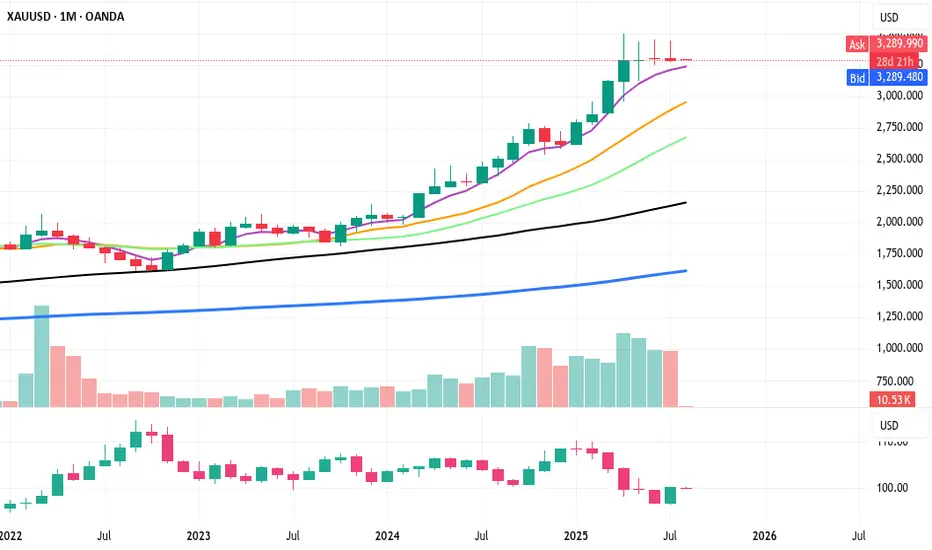
XAUUSD: Correction in Progress, Patience is Key for the Success GOLD (XAUUSD) -Monthly Analysis & Trading Plan (Aug 2025)
Title: XAUUSD: Correction in Progress, Patience is Key for the Next Move
**Chart:** XAUUSD Monthly (1M)
**Analysis Type:** ICT/SMC, Price Action, & Moving Average
Summary:
After a historic and powerful bull run that saw Gold (XAUUSD) breach all-time highs in the first half of 2025, the market has entered a significant corrective phase. The massive red candle in June signaled a strong reversal of momentum, and the current July candle confirms that sellers remain in control, albeit with less intensity. This is a critical juncture for long-term traders, and a strategic approach is required.
**Key Observations & Analysis:**
1. **Price Action & Market Structure:** The move from late 2024 through May 2025 was a textbook "impulsive leg." The sharp reversal in June 2025, with a powerful bearish candle, likely acted as a **liquidity grab** or a **high-volume distribution event**, trapping late buyers. The market is now in a clear **break in market structure (BOS)** to the downside on this long-term timeframe, suggesting the correction is not over.
2. **ICT/SMC Concepts:**
* **Imbalance/Fair Value Gap (FVG):** The rapid bullish move created significant imbalances on the monthly chart. Price often returns to fill these gaps. The current correction is likely heading to fill or test these inefficiencies.
* **Order Block (OB):** The massive bullish move in late 2024/early 2025 likely created a strong bullish order block. The current sell-off is heading toward this potential institutional demand zone.
* **Liquidity:** The lows from late 2024 and early 2025 will be key liquidity pools. Smart money will likely be targeting these areas for a potential reversal or accumulation.
3. **Moving Average Analysis (MMA):**
* The price is currently trading above both the purple and yellow moving averages, which are still pointing upward. This confirms the long-term trend remains bullish, and the current move is a correction within that trend.
* The **purple moving average** is a key support level to watch. A test of this level would be a high-probability event, and its reaction will be crucial for the next major move.
**Suggested Entry & Exit Levels:**
**1. Aggressive Entry (Short):**
* **Rationale:** The bearish momentum, though slowing, is still the dominant force. An aggressive trader could look for a continuation of the short-term bearish trend.
* **Entry:** A short entry could be considered on a pullback to the recent highs around **$3,400 - $3,500** if a strong bearish candlestick pattern forms on a lower timeframe (e.g., weekly or daily).
* **Stop Loss:** A tight stop-loss placed just above the recent high, for example, **$3,600**. This is a high-risk entry, so position sizing should be small.
* **Target:** The first major target would be the **moving average support level**, roughly in the **$3,000 - $3,100** zone. The ultimate target for a full correction would be the order block from late 2024, around **$2,800**.
**2. Conservative Entry (Long):**
* **Rationale:** The long-term trend is still bullish. The current move is a correction. The most prudent approach is to wait for a high-probability long entry at a key support level.
* **Entry:** Wait for price to reach the **purple moving average support zone (around $3,000 - $3,100)**. Look for a clear reversal signal on this level, such as a large bullish "pin bar" or "engulfing candle" on the monthly or weekly chart. This would be a high-probability demand zone for a reversal.
* **Stop Loss:** A stop-loss should be placed below this key support level, perhaps around **$2,850 - $2,900**, giving the trade room to breathe.
* **Target:** The first target for a new bullish leg would be the recent swing high around **$3,800**. The ultimate long-term target would be a new all-time high above **$4,000**.
Conclusion
The Gold market is in a crucial phase. The bullish party from earlier in 2025 is over for now, and a healthy correction is underway. **The most logical and safe approach is to wait for the market to complete its corrective move.** Do not attempt to catch a falling knife. Instead, be patient and wait for price to reach a key institutional demand zone (our moving average support or the late 2024 order block) and show a clear sign of reversal. This will present a high-probability, low-risk long entry for the next impulsive move up.
Disclaimer
This is not financial advice. Please perform your own due diligence and risk management. Trading involves a significant risk of loss.
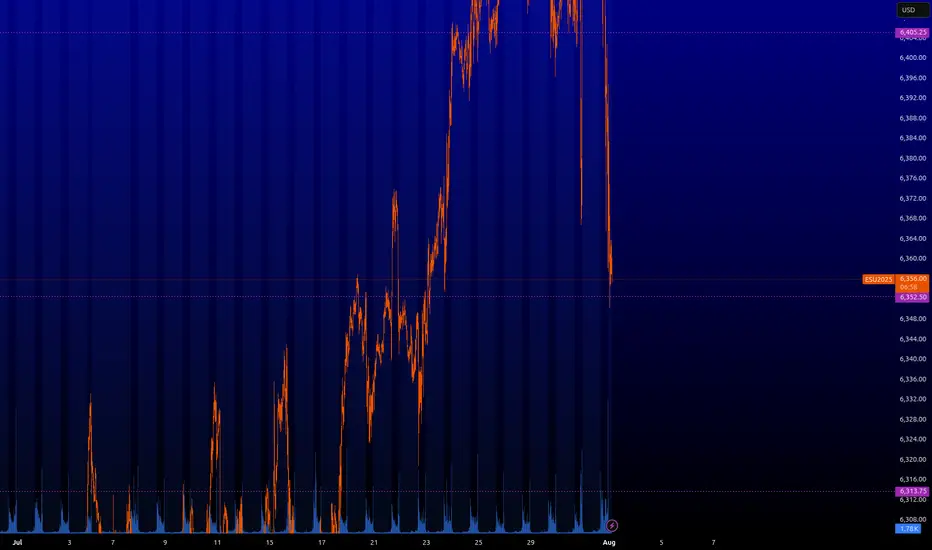
ES : Key levels⚠️ VOLATILITY WARNING ⚠️
Trading around major news can be extremely unpredictable. Trade responsibly!
Here are the key levels that the market will be interested in. So far, the green level of ~6.263 is likely to bounce, but it is old. I'd wait for something fresher.
From the minor timerframe, we can soon go long from ~6.352. If I'm at my computer and everything works out at this level as it should, I'll let you know.

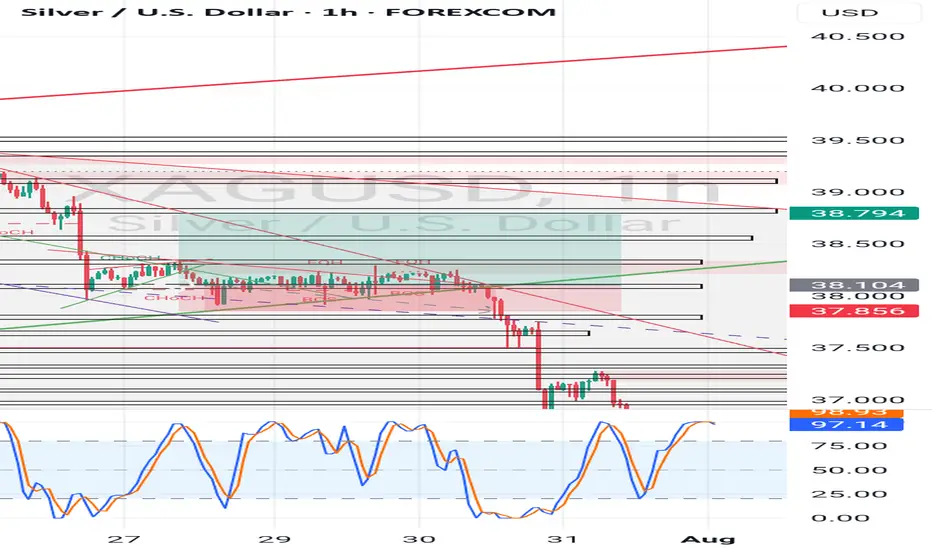
XAG USD LONG RESULT Silver price consolidated in the symmetrical triangle and on the major Support Trendline until it broke down and dumped hitting our sl.
XAUUSD
XAUUSD Updated in 5M :
The gold signal is marked on the chart based on the latest price changes and the supply and demand in the market. These points include the entry point, stop loss, and take profit
The market is concernedThe structure of the S&P 500 daily chart implies a market that is concerned. Although many of the fundamentals released on Thursday were basically meeting market expectations, there is concern about the impact of the tariffs there is concern about geopolitical factors and there is concern about how the market will absorb Friday's economic numbers. Sellers are here but will they have a reason to follow through to the downside as we go into the weekend.

ES - August 1st, 2025 - Session Opening HourAugust 1st, 2025 - 6:53pm Session Opening Hour- Daily Plan
Thursday's high was 6468 and low was 6358. We have been in this range for the past week.
6366-74 was the area that we broke out into this range and have tested this zone the past 2 days.
In order for us to move higher, we need to break above 6366-70 which then can target 6403, 6417, 6433.
If we break below 6350 the next target areas for a reaction is 6336, 6317, 6272
Ideally, we can build structure here at 6350 and clear 6366-70 or look for price to touch the zones in blue below and then flush and recover 6350 zone for a nice move to the 6366-70 first target.
I will update the plan based on overnight price action by 8am EST, Friday August 1st, 2025
