ES : Key levels⚠️ VOLATILITY WARNING ⚠️
Trading around major news can be extremely unpredictable. Trade responsibly!
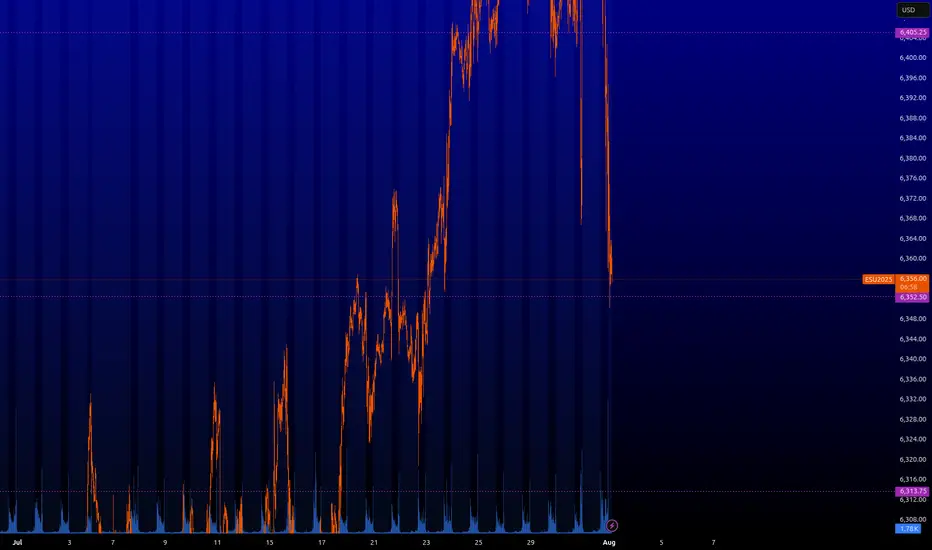
Here are the key levels that the market will be interested in. So far, the green level of ~6.263 is likely to bounce, but it is old. I'd wait for something fresher.
From the minor timerframe, we can soon go long from ~6.352. If I'm at my computer and everything works out at this level as it should, I'll let you know.
Futures market

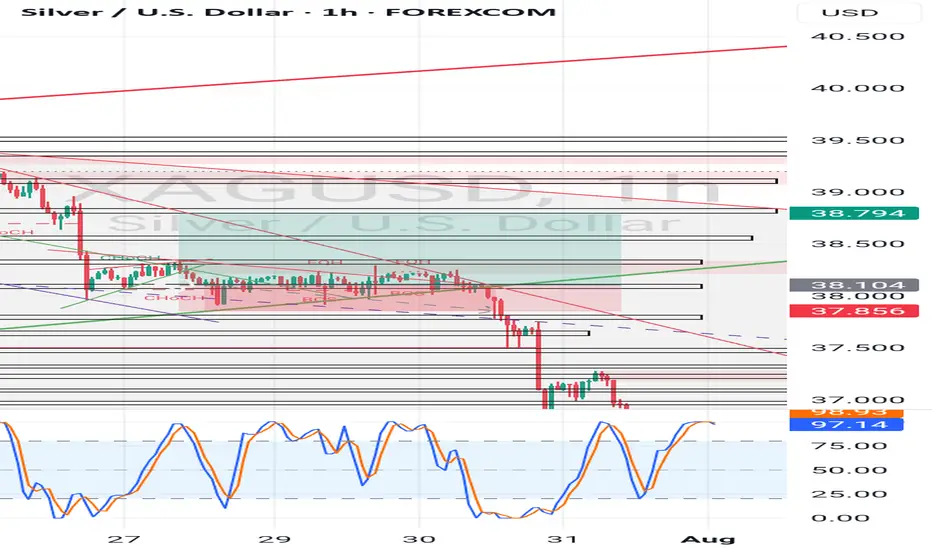
XAG USD LONG RESULT Silver price consolidated in the symmetrical triangle and on the major Support Trendline until it broke down and dumped hitting our sl.
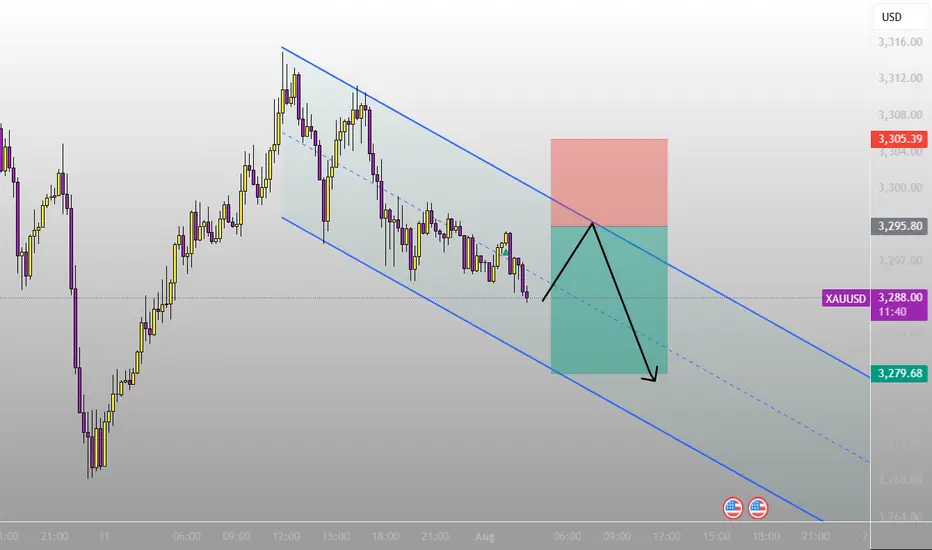
XAUUSD
XAUUSD Updated in 5M :
The gold signal is marked on the chart based on the latest price changes and the supply and demand in the market. These points include the entry point, stop loss, and take profit
The market is concernedThe structure of the S&P 500 daily chart implies a market that is concerned. Although many of the fundamentals released on Thursday were basically meeting market expectations, there is concern about the impact of the tariffs there is concern about geopolitical factors and there is concern about how the market will absorb Friday's economic numbers. Sellers are here but will they have a reason to follow through to the downside as we go into the weekend.

ES - August 1st, 2025 - Session Opening HourAugust 1st, 2025 - 6:53pm Session Opening Hour- Daily Plan
Thursday's high was 6468 and low was 6358. We have been in this range for the past week.
6366-74 was the area that we broke out into this range and have tested this zone the past 2 days.
In order for us to move higher, we need to break above 6366-70 which then can target 6403, 6417, 6433.
If we break below 6350 the next target areas for a reaction is 6336, 6317, 6272
Ideally, we can build structure here at 6350 and clear 6366-70 or look for price to touch the zones in blue below and then flush and recover 6350 zone for a nice move to the 6366-70 first target.
I will update the plan based on overnight price action by 8am EST, Friday August 1st, 2025

XAUUSD
XAUUSD Updated in 5M :
The gold signal is marked on the chart based on the latest price changes and the supply and demand in the market. These points include the entry point, stop loss, and take profit

RTY & YM DOWNMVP SYSTEM
MOMENTUM- The RSI broke below the uptrend line
VOLUME- large volume bearish candle
PRICE - multi top, rounded
ES & NQ also have bearish engulfing candles but the rsi has not broken the uptrend channel. When that occurs, all of the MVP rules will be met for a down position.
So people say not to play the vix but cmon it’s so low right now. If all of the indices break to the downside… a small lotto could be a worthwhile play.

**07/31/25 Trade Journal, and ES_F Stock Market analysis **
EOD accountability report: +
Sleep: 5.5 hours
Overall health: Good
** VX Algo System Signals from (9:30am to 2pm) **
— 9:00 AM Market Structure flipped bullish on VX Algo X3
— 9:30 AM VXAlgo ES X7 Sell signal
— 9:32 AM Bullish market structure got cancelled
— 11:40 AM VXAlgo NQ X1 Buy Signal
— 12:40 PM VXAlgo NQ X1 Sell Signal
— 1:00 PM Market Structure flipped bullish on VX Algo X3!
— 1:22 PM if we lose 6415 and stayy under it . Bullish Market structure is cancelled.
— 1:55 PM VXAlgo NQ X1 Buy Signal
What’s are some news or takeaway from today? and What major news or event impacted the market today?
Today marked the 4th day of the structure signals being iffy as they try to tip the volumes bullish just to cancel it right afterwards.
I was starting to get a bit tilted today as I had a bunch of orders at area that didn't get filled and eventually just gave up trying to have a green day and walked away.
looking at some of the other charts, i also we are getting a doji on the longer time frames and it is starting to look like bear's wet dream.
However, Mag 7 stock earnings were really great, the only downside was rate cut isn't happening.
News
*U.S. STOCKS END LOWER, VIX JUMPS AS S&P 500, NASDAQ RETREAT FROM RECORDS DESPITE MONSTER META AND MICROSOFT EARNINGS
What are the critical support levels to watch?
--> Above 6415= Bullish, Under 6403= Bearish

NQ GC ES, Daily Orderflow and Weekly OutlookCME_MINI:NQ1! COMEX:GC1! CME_MINI:ES1!
Time for the final AMDX

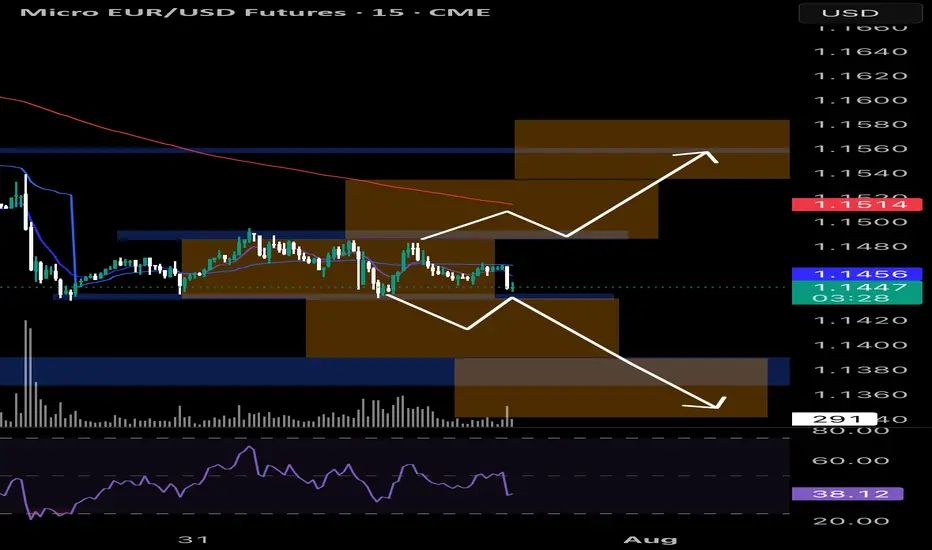
EUR/USD Futures – Key Decision ZonePrice is consolidating between 1.1430 and 1.1485, forming a range near previous value areas.
A breakout is likely imminent. Watching for:
📈 Bullish scenario: Break and retest of 1.1490 → targeting 1.1570 supply zone.
📉 Bearish scenario: Sweep of 1.1430 lows with strong volume → targeting 1.1370 demand.
Volume is decreasing, RSI under 40, and we’re sitting at the mid of a low-volume node → stay patient and reactive, not predictive
Xausd techinical analysis.Xausd techinical analysis.next move posibale at h1 time frame not finchinal advice.

Journey of silver buy at support sell at resistance There is Up trending channel, follow the channel and make money since silver is long term bullish atleast.
Not mentioning the levels do the math follow the channel and find the support

Retail Used Indicators. You Used Structure. You Got Paid.MES printed a textbook quant setup today, delivering a high-confidence breakdown that played out almost mechanically. Price action first broke down from a well-respected rising trend channel, then pulled back into the 50% Fibonacci retracement zone at 6,426.75, drawn from the recent swing high at 6,457.50 to the low at 6,395.75.
The retracement also aligned with a heavy volume node, which acted as a clear supply zone. What followed was a rounded retest structure that resembled a teacup formation not as a bullish setup, but rather as a liquidity bait, luring in breakout buyers before delivering a clean rejection from the equilibrium zone.
This type of structure a trend line break + fib pullback + rounded retest + expansion move is one of Staakd’s high-probability short patterns, historically completing the measured move back to 0% (6,395.75) over 70% of the time. That target has now been hit, and with price currently consolidating below the broken structure and inside a low-volume area, we could now see a secondary move toward 6,375 if 6,395 fails to hold. If instead we see a relief bounce, the optimal re-entry zone sits between 6,410 and 6,420, just beneath the broken fib and previous channel floor.
This is one of those trades where structure, volume, and historical probability all lined up. The teacup retest served its purpose: trap liquidity, reject from the midpoint, and release pressure into the lower range. Unless MES reclaims 6,430, the bias remains firmly bearish.
These setups tend to show up 9–14 times per year on MES alone, especially during high-volume NY sessions or post-news volatility. What you’re looking for is a strong, clean trending structure that finally breaks then watch for a pullback to the 50–61.8% retracement zone, ideally aligning with a volume node or prior support. Often, this retest forms a rounded “teacup” shape a trap zone that attracts late buyers just before the breakdown. Once that zone rejects with momentum, price tends to expand cleanly toward the 0% fib level, or even extend further.
Track this pattern. Log it. It’s one of the most repeatable, mechanical moves we see in futures and when it shows up, it usually pays.
My recommendation is simple: ditch the clutter. Most retail traders are buried under recycled YouTube strategies, lagging indicators, and overcomplicated systems. The truth? Price structure, volume, and basic fib geometry are more than enough to build consistent trades. Go back to basics. Read the chart, not the noise. You'll be surprised how quickly your trading improves when you stop outsourcing your bias to indicators and start trusting clean, mechanical setups like this.

Gold’s Compression Coil Looks Ready to DetonateMGC continues to reject the 50% Fibonacci retracement level from the $3,386.5 swing high, currently trading at $3,347.3. Price has now spent multiple candles trapped under this level, unable to reclaim $3,355, with clear upper wicks and no bullish follow-through.
This is classic midday NY session compression, often setting up a late-day directional move. All signs currently point to continuation lower toward $3,306.2, completing a textbook measured move.
Staakd Probability Model
Based on historical setups where MGC pulls back to 50% and stalls mid-NY:
Scenario Probability
- Continuation down to $3,306.2 68% High-probability path if $3,347 breaks
- Sweep to $3,355–$3,360 before drop. 26%. Possible liquidity grab
- Break and hold above $3,360 6% Invalidation of the short idea
Key Levels
Level
- 100% Fib High $3,386.5 - Swing high
- Supply Zone $3,347–$3,355 - Rejection area + equilibrium zone
- Current Price $3,347.3 - Compression below fib midpoint
- Target Zone $3,306.2 - Measured move / demand structure
- Invalidation $3,360.0+ - Break above this invalidates the short
Trade Idea (Pending Trigger)
- Bias: Bearish
- Entry Zone: $3,345–$3,350
- Target: $3,306.2
- Invalidation: Above $3,360
- Reward-to-Risk: 2.2R–2.5R depending on entry execution
This is shaping into a high-probability continuation setup. NY session has done the heavy lifting: a weak bounce, heavy rejections, and no reclaim of structure. Unless we see a sudden reclaim of $3,355 or a spike in late NY volume, this looks ready to break and expand lower. Keep it simple. Trust the structure. Let price walk itself to the target.

GOLD Short OANDA:XAUUSD / TVC:GOLD Short Trade, with my back testing of this strategy, this highlighted zone is key area of exact prices shared.
Price will bounce in this
Note: Manage your risk yourself, its risky trade, see how much your can risk yourself on this trade.
Use proper risk management
Looks like good trade.
Lets monitor.
Use proper risk management.
Disclaimer: only idea, not advice
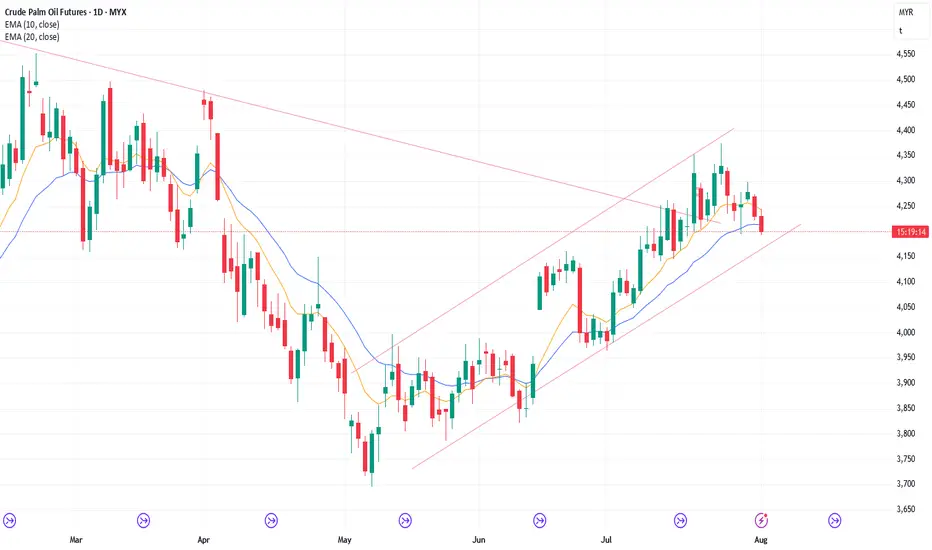
1/8/25 Will Weekly Candlestick Close Near Low or Long Tail Below
Thursday’s candlestick (Jul 31) was a bear bar closing near its low.
In our last report, we said traders would see if the bears could create a strong retest of the July 29 low, or if the market would trade slightly lower, but find support around the 20-day EMA instead.
The market traded lower and continued down in Thursday night's session, testing the 20-day EMA. The monthly candlestick closed in its upper half with a prominent tail above.
The bulls want any pullback to lack follow-through selling, similar to the last few pullbacks (July 7, July 11, July 15, and July 22).
They see the current move as a two-legged pullback.
They want the 20-day EMA or the bull trend line to act as a support level.
They want a double bottom bull flag with the July 29 low.
They want another strong leg up to form the wedge pattern, with the first two legs being Jun 20 and July 24.
The bears want a reversal from a large wedge pattern (May 15, Jun 20, and Jul 24) and an embedded wedge (Jul 14, Jul 18, and Jul 24).
They see Tuesday (July 30) as a pullback and want at least a small second leg sideways to down, retesting the July 29 low. The second leg sideways to down is underway.
Previously, the bears were unable to create follow-through selling in the last four selloff attempts (July 7, July 11, July 15, and July 22).
They need to create consecutive bear bars closing near their lows and trading below the 20-day EMA to show they are back in control.
Production for August may be flat or down.
Refineries' appetite to buy looks decent recently.
Export: Perhaps down -7% in July.
So far, the buying pressure is slightly stronger than the selling pressure, but not in an overwhelming way yet (no strong consecutive bull bars closing near their highs).
However, the move up has lasted a considerable amount of time. The market may have to form a pullback before it moves higher again. The pullback phase is still underway.
Traders will assess the strength of the pullback to determine whether it will be a minor correction or a more significant event. So far, the pullback appears to be minor.
The bears need to create follow-through selling to show they are back in control, something they couldn't do in the last few pullbacks (July 7, July 11, July 15, and Jul 22).
For tomorrow (Friday, Aug 1), traders will see if the bears create a strong follow-through bear bar closing near its low. If they do, the weekly candlestick will close near its low, which will increase the odds of next week trading at least a little lower.
Or will the market trade lower, but close with a long tail below or a bull body instead?
Andrew
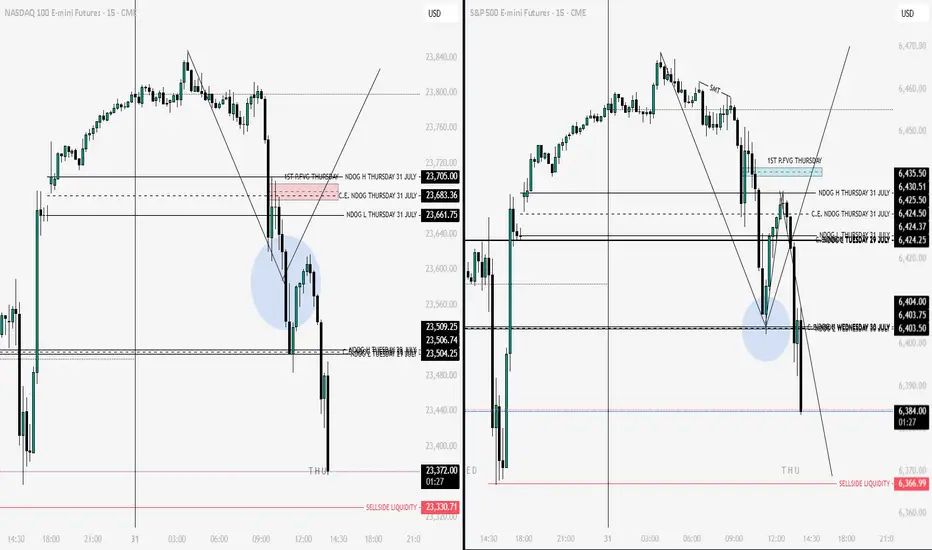
Nq & Es Key Levels 31-07 After PredictionsThe price resisted the point indicated before but the price did not continue upwards. Not good Analysis Today...
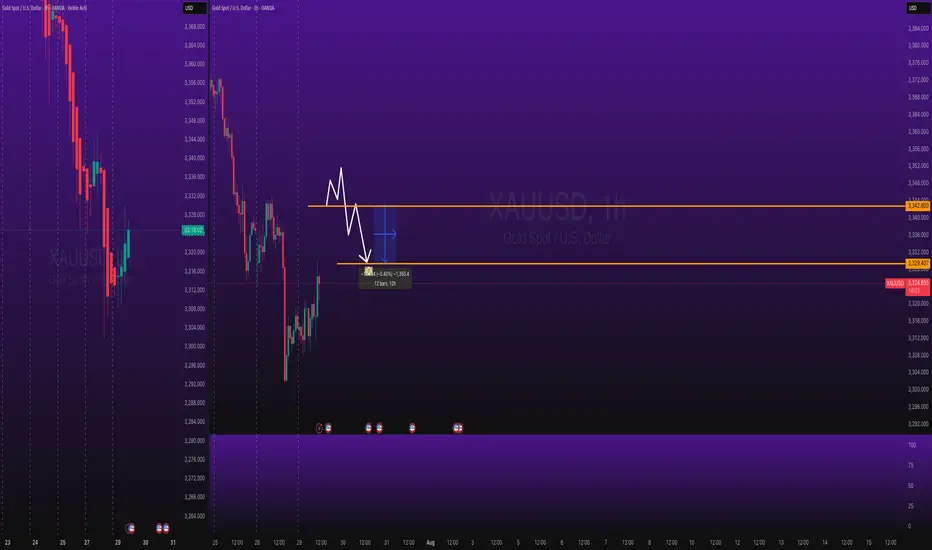
GC AnalysisWith stability signs appearing the gold is loosing its shine. With GC trading in a range.

Gold consolidates on softer safehaven demand
Fundamental View
The Federal Reserve opted to keep interest rates unchanged with a hawkish tilt at its latest policy meeting which gave the USD a boost. Meanwhile, gold’s upside remains limited due to reduced safehaven demand, a stronger USD and a de-escalation in global trade tensions. Elevated US inflation figures and robust economic performance have continued to support the dollar, thereby limiting gold’s attractiveness.
Technical View
XAUUSD remains in a consolidation phase as long as it holds above the $3,285–$3,300 support zone. A decisive break above $3,355 could signal a resumption of bullish momentum, while a move below current support levels may open the door to further downside pressure.
By Terence Hove - Senior Financial Markets Strategist at Exness

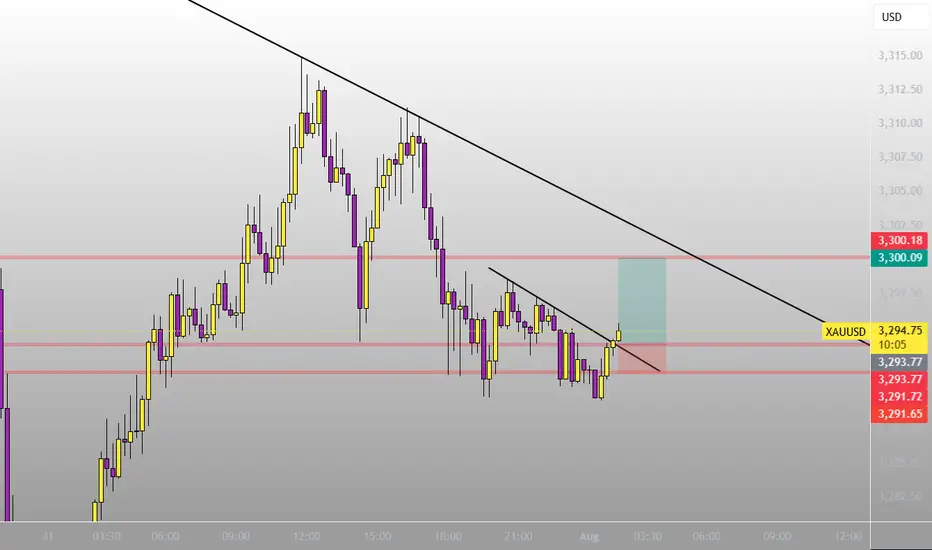
XAUUSD GOLD The XAUUSD Gold price is approaching our target zone, where it will find strong support in EMA 100 if it does not comply with LSOB in small timeframes. In the 4H timeframe, the price has been making lower lows so far, so I recommend waiting a little and entering based on the daily timeframe from the lower zone.

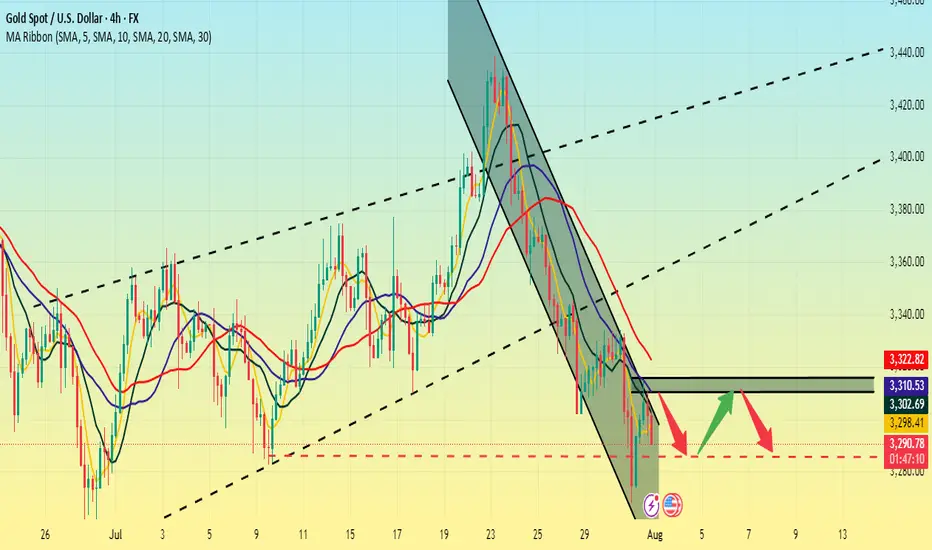
The US dollar is strong. Be wary of gold.The US dollar index rose, now above 100, before retreating slightly and fluctuating slightly, reaching 100 for the first time in two months. After a sharp drop to around 3270 on Wednesday, gold rebounded sharply today. With the US dollar breaking through 100 and the USD/JPY pair breaking through 150, gold is now struggling to maintain its position.
Thus, Quaid believes it's not appropriate to be overly bullish on gold for now. A significant decline is likely.
The 4-hour chart shows that the upper moving average resistance is currently around 3310-3315. If it breaks through 3315, it could potentially move towards 3325.
Conversely, if it fails to break through 3315 today, it could continue to consolidate in the 3315-3285 range. Waiting for new data to guide its trend.