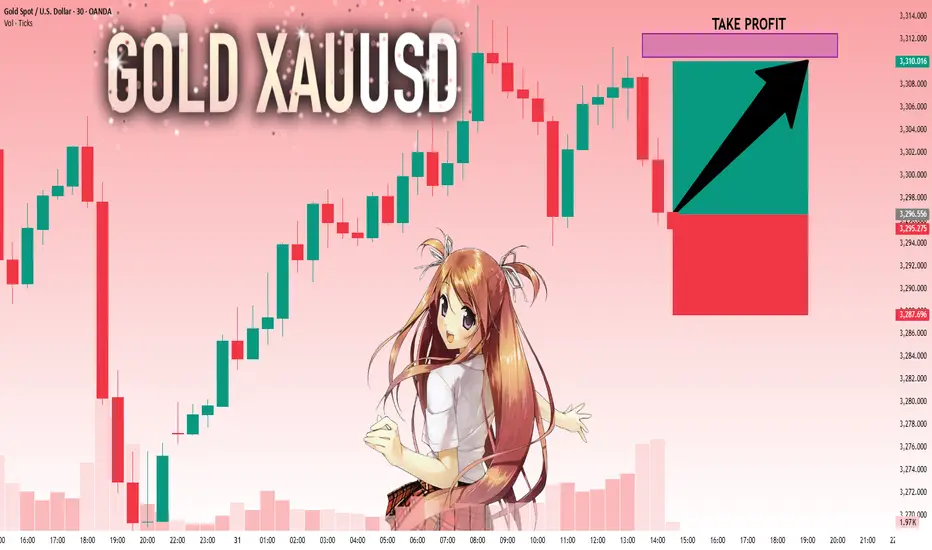
XAUUSD: BUYThere are some good trading opportunities in the market. That's when to buy. Gold prices haven't fallen further since falling back to 3390. There's no further negative news. Therefore, there won't be a significant short-term decline. Our focus will be on tomorrow's non-farm payroll data update. This is a crucial factor that can cause gold prices to rise or fall significantly in the short term.
I'll update you with real-time buy and sell opportunities. This is based on research from the Swing Trading Center. It's highly authoritative. Don't miss out! Remember to stay tuned.
XAUUSD: BUY 3292-3282 TP 3320. SL 3265
Futures market

XAUUSD GOLD The XAUUSD Gold price is approaching our target zone, where it will find strong support in EMA 100 if it does not comply with LSOB in small timeframes. In the 4H timeframe, the price has been making lower lows so far, so I recommend waiting a little and entering based on the daily timeframe from the lower zone.

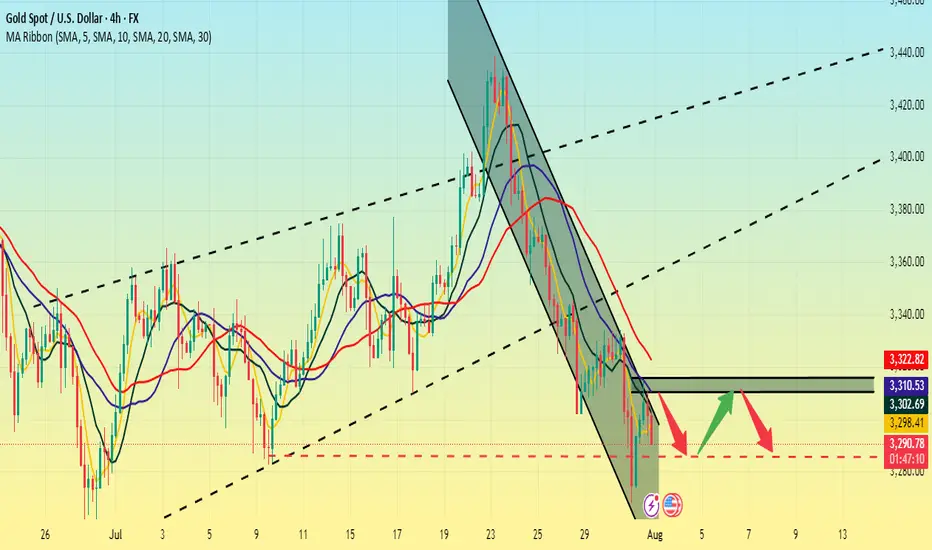
The US dollar is strong. Be wary of gold.The US dollar index rose, now above 100, before retreating slightly and fluctuating slightly, reaching 100 for the first time in two months. After a sharp drop to around 3270 on Wednesday, gold rebounded sharply today. With the US dollar breaking through 100 and the USD/JPY pair breaking through 150, gold is now struggling to maintain its position.
Thus, Quaid believes it's not appropriate to be overly bullish on gold for now. A significant decline is likely.
The 4-hour chart shows that the upper moving average resistance is currently around 3310-3315. If it breaks through 3315, it could potentially move towards 3325.
Conversely, if it fails to break through 3315 today, it could continue to consolidate in the 3315-3285 range. Waiting for new data to guide its trend.
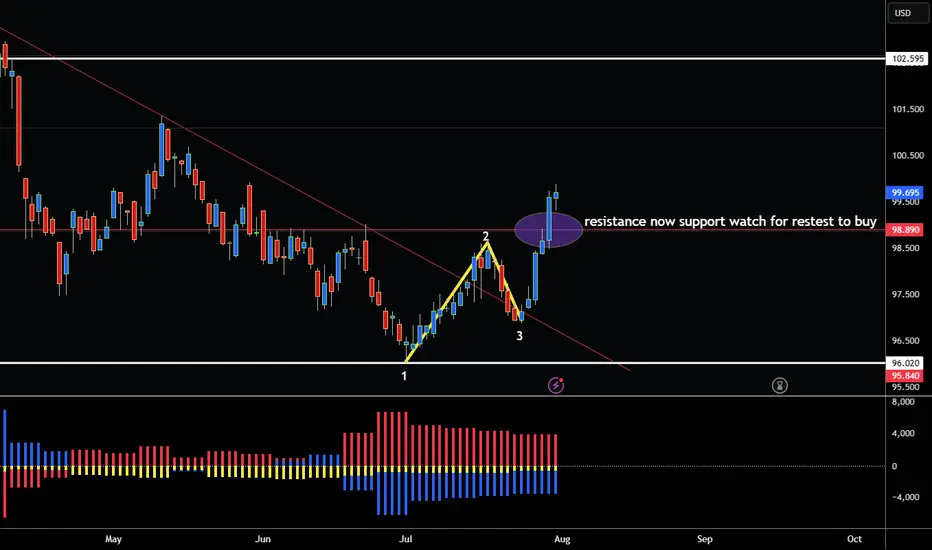
US DOLLAR BREAKS ABOVE RESISTANCE 98.99 BOTTOM CONFIRMED! Hey Traders so today looking at the US Dollar and as of today there is now a 123 bottom on the charts that has been confirmed by breaking above the 2 point.
Sees like fundamentally the US Dollar has now become bullish so with this breakout now confirmed does this mean we are in the beginning of Bull Market for the USD?
Well no one knows for sure but without any interest rate cuts and lots of tarriffs coming through it seems to be that way. Only time will tell of course if this becomes a new uptrend in USD so now we have a breakout whats next?
The way you trade the 123 bottom is wait for the market to break above the 2 point. Then alot of times there will be a retest of that zone at 98.89
Watch for the retest then consider selling Euro, Pound, Cad, Australian, Gold, Commodities etc...
Against the USD.
If you however you are bearish USD I would wait until market has daily close under 3 point that way you know for sure market has turned.
I will now start to include COT Report in my Analysis so we can see institutional positioning.
Currently Large Specs are Short the USD.
Good Luck & Always use Risk Management!
(Just in we are wrong in our analysis most experts recommend never to risk more than 2% of your account equity on any given trade.)
Hope This Helps Your Trading 😃
Clifford
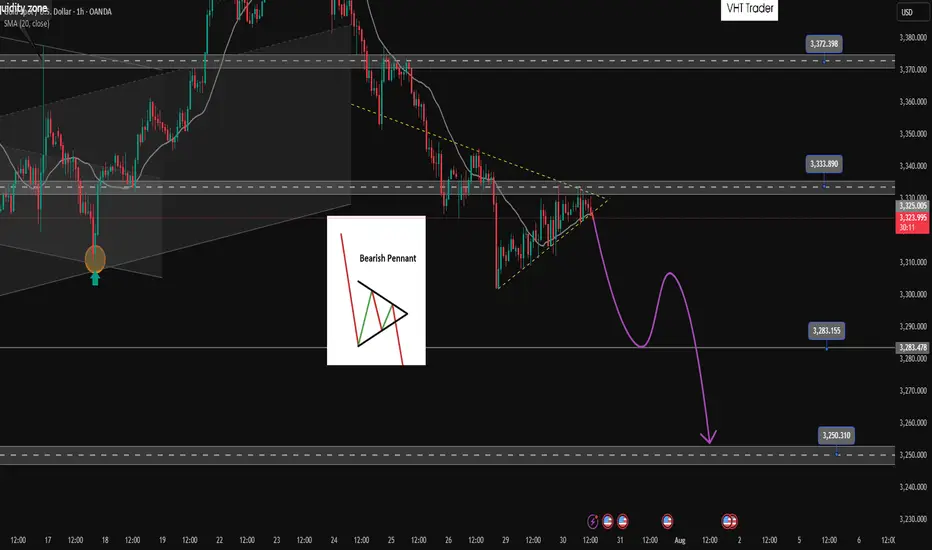
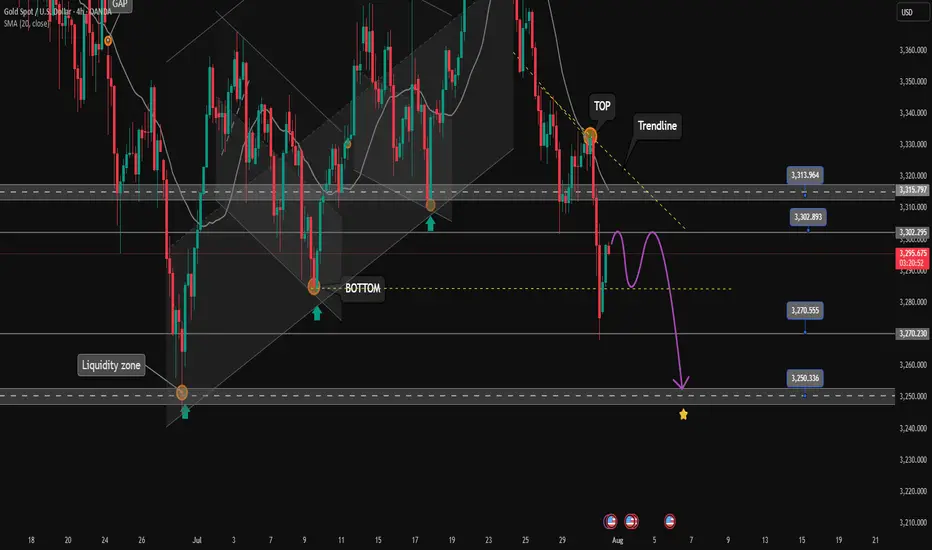
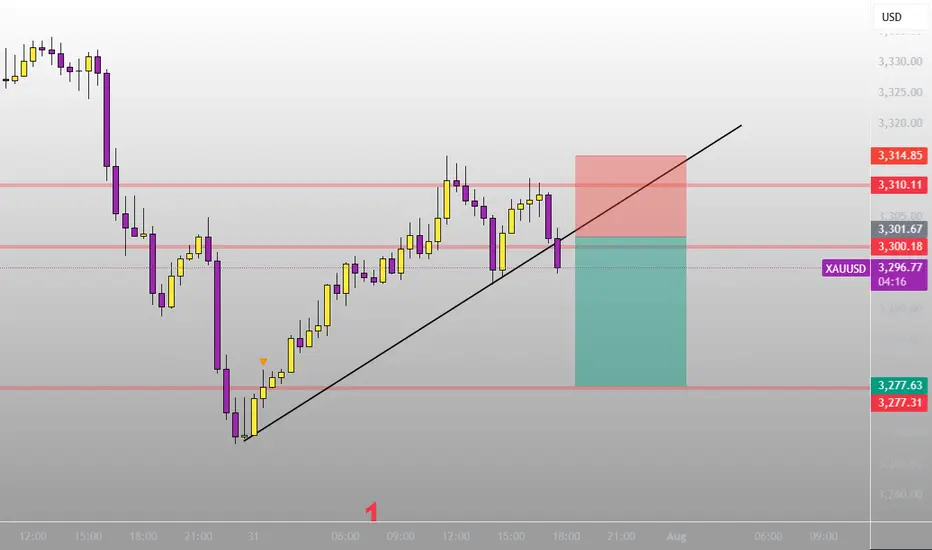
Bearish pennant pattern active. Active SELL✏️Gold price is forming a triangle accumulation pattern. That shows the hesitation of investors at the moment, they may be waiting for important economic indicators of the US this week. Just an impact that makes Price break out of the triangle border can create a strong FOMO trend. The price line is quite similar to the bearish pennant pattern and heading towards really strong support areas.
📉 Key Levels
SELL Trigger: Break bottom line 3324
Target 3285, lower is the 3250 area
BUY Trigger: Break and trading above 3333
BUY Trigger: Rejection and confirmation of candle at 3285
Leave your comments on the idea. I am happy to read your views.
Follow master candle for today's SELL strategy✏️ OANDA:XAUUSD has continued a strong downtrend. Yesterday's D1 candle closed with a 60-price decrease, forming a master candle that determines the market trend. With the market having a master candle, pay attention to the 25% or 50% candle zones to trade in the direction of the trend. Today's main trading strategy will be to SELL according to the master candle. The BUY strategy will only be implemented when the 3313 zone is broken.
📉 Key Levels
Support: 3285-3270-3250
Resistance: 3301-3312-3333
SELL Trigger. Rejection 3301, 3312
Target 3250
Leave your comments on the idea. I am happy to read your views.
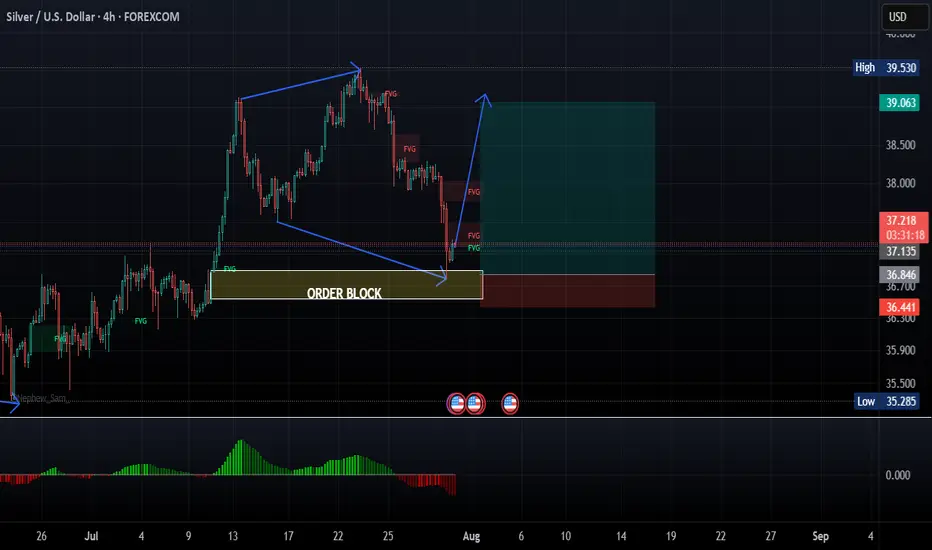
XAGUSD/SILVER LONG 1:5 RReason for entry:
1. Expanding flat structure
2. Order block reaction
3. 5th wave in play
4. 4 HR engulfing candle
Entry: 37.204
Stop loss: 36.454
Take Profit:39.073
Strategy: Wait for engulfing candle to enter
Place trade at break even at 1:2R or move stop loss to 1:1 R when in PROFIT
EURUSDEURUSD - Still has potential either now or in the future to go up to 1.3726.
Off futures has potential to go below 0.95 based on analysis only.
Confluence:
Futures Analysis - Can go both ways based on todays price action.
Forex Analysis: Still in a downtrend based on the longer term perspective, down->consolidation->up...
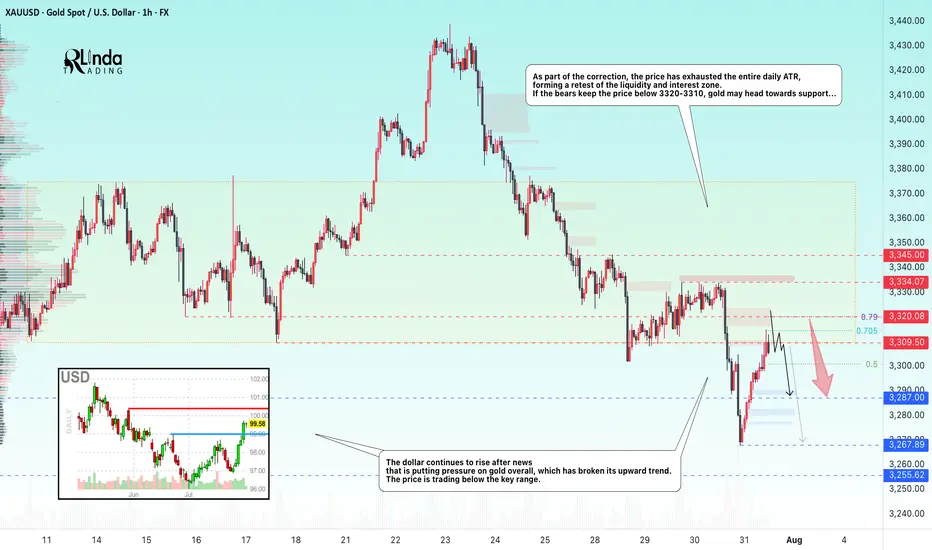
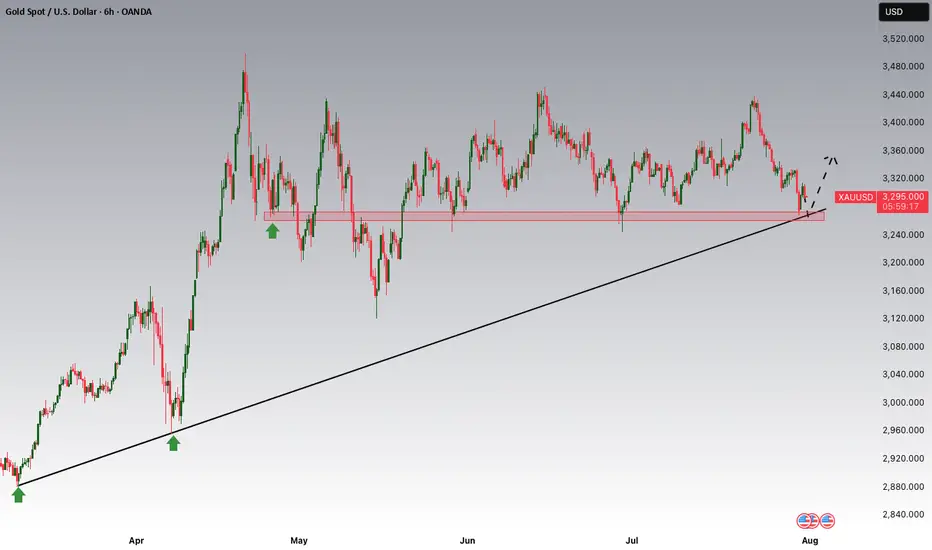
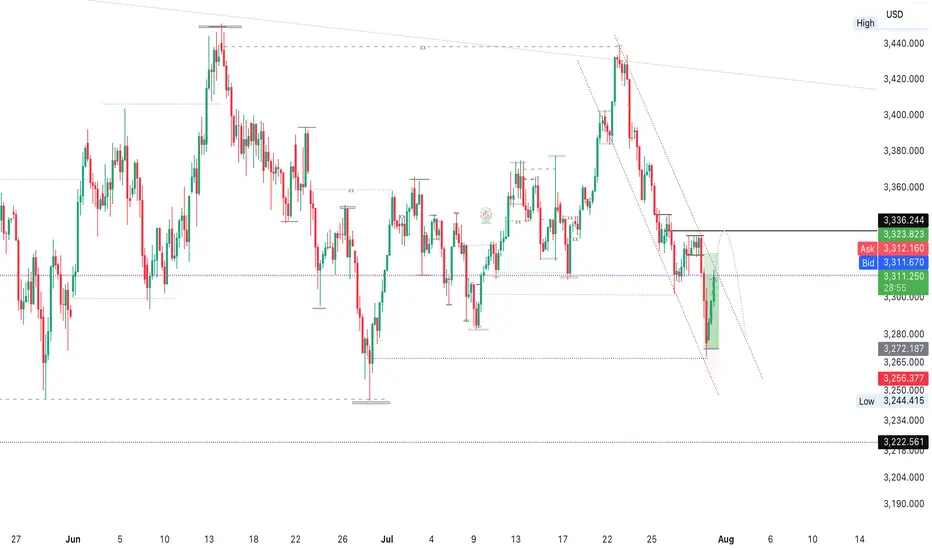
GOLD → Retest of resistance within a bearish runFX:XAUUSD breaks through the upward trend support amid a rallying dollar. Since the opening of the session, the price has been testing the zone of interest, but bears are quite aggressive...
Gold is partially recovering after falling to $3,268, a monthly low caused by the Fed's hawkish tone. The Central Bank kept its rate at 4.25–4.5% (9 votes to 2), highlighting uncertainty due to Trump's tariffs. Markets now estimate the probability of the rate remaining unchanged in September at 58% (previously 35%). The dollar's rise slowed amid concerns about the extension of the US-China trade truce and profit-taking ahead of key US employment data (after strong ADP and GDP reports). The nearest drivers are labor market statistics and trade news, while the technical picture for gold remains bearish.
Technically, on D1, the price is breaking key support zones, including the trend line, which overall only increases selling pressure on the metals market...
Resistance levels: 3310, 3320, 3334
Support levels: 3287, 3267, 3255
As part of the correction, the price has exhausted the entire daily ATR, forming a retest of the liquidity and interest zone. If the bears keep the price below 3320-3310, gold may head towards support...
Best regards, R. Linda!
Gold Potential UpsidesHey Traders, in today's trading session we are monitoring XAUUSD for a buying opportunity around 3,270 zone, Gold is trading in an uptrend and currently is in a correction phase in which it is approaching the trend at 3,270 support and resistance area.
Trade safe, Joe.
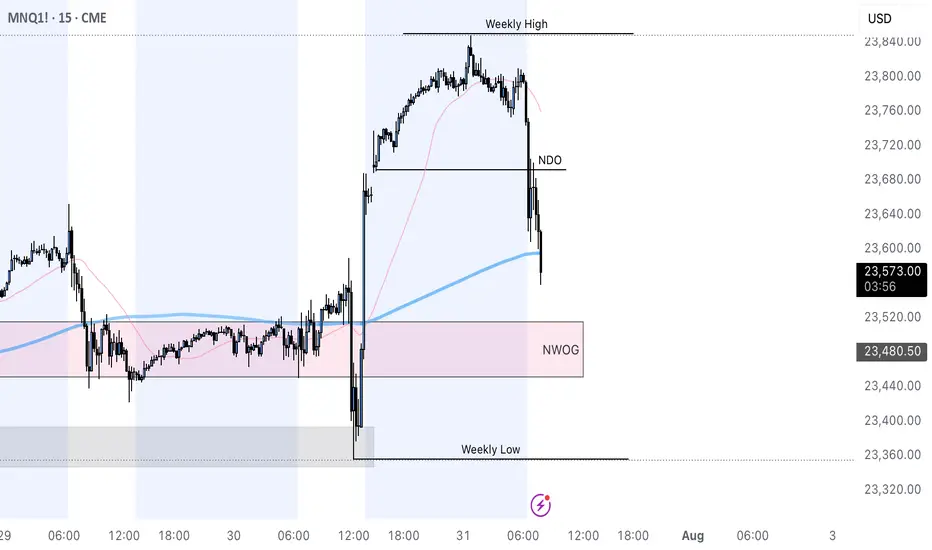
MNQ Short @robby.tradez price looking to fill imbalance from yesterdays late New York session
- what inspired the trade?
I run a checklist of confluences when trading this asset, it is either I compare it with CME_MINI:MES1! or DXY
as of now MNQ is below my daily open so it lets me know sellers are in control as well as using the volume profile gives me more confirmation, also pairing it with DXY then we have more reason why I took the trade \\
RR 1:4 I generally aim for 4% on a trade like this because it passes as a high probability trade A SETUP
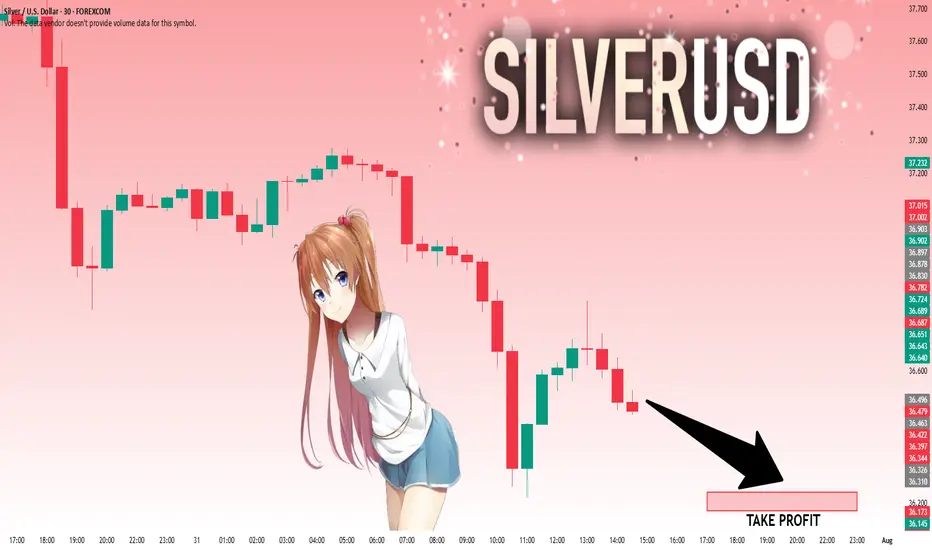
SILVER: Will Go Down! Short!
My dear friends,
Today we will analyse SILVER together☺️
The market is at an inflection zone and price has now reached an area around 36.490 where previous reversals or breakouts have occurred.And a price reaction that we are seeing on multiple timeframes here could signal the next move down so we can enter on confirmation, and target the next key level of 36.231..Stop-loss is recommended beyond the inflection zone.
❤️Sending you lots of Love and Hugs❤️
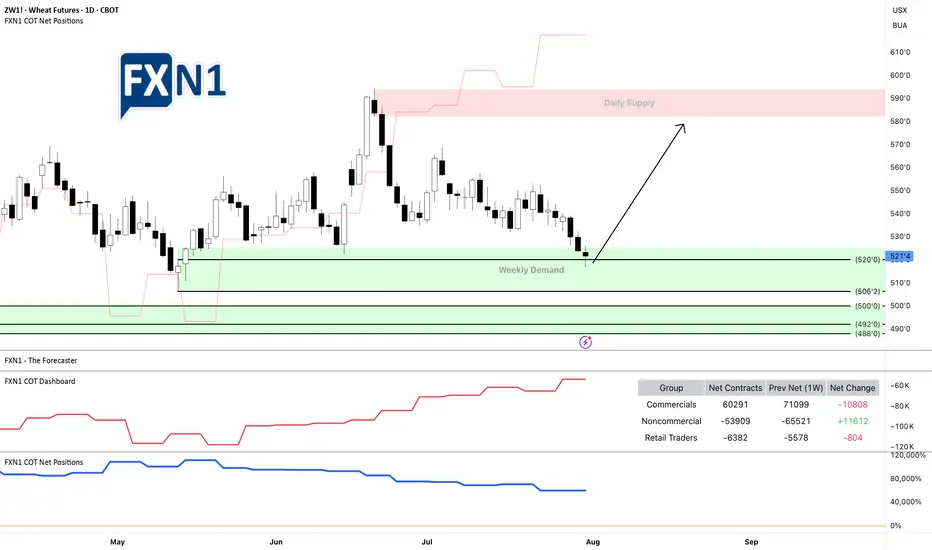
Is Wheat ZW1 Ready for a Long Trade? Key Demand Area InsightsThe futures of Wheat ZW1! are reaching a weekly demand zone, where we observe non-commercials going long and retail traders holding short positions. This could present a potential setup for a long trade. Note: There is another demand area below, but the positions of commercials are less clear compared to non-commercials and retail traders.
Always manage your risk carefully if you agree with my analysis, and be sure to develop your own trading plan.
✅ Please share your thoughts about ZW1! in the comments section below and HIT LIKE if you appreciate my analysis. Don't forget to FOLLOW ME; you will help us a lot with this small contribution.
LNG and Weather Factors: We Expect Moderate Storage IncreaseThe natural gas market enters Week 31 with a sense of equilibrium, as prices hold steady and storage levels continue to climb. The expiration of Contract Q aligned with the 15-year median, while Contract U trades near the median, and 2025 fall contracts remain within the interquartile range, slightly above median levels. However, Winter 2026-27 contracts persist above the upper quartile, hinting at lingering supply and weather concerns. A projected 39 BCF storage increase for Week 30 (July 21-27) keeps inventories above the five-year median, supported by robust injection rates. Yet, a sharp rise in the supply-demand differential, driven by increased power generation and industrial consumption, signals evolving market dynamics as LNG exports dip. Weather stabilization and regional trends further shape this outlook, which we explore in detail below.
Current prices compared to price dispersion 10 days before expiration by month since 2010
The expiration of contract Q was in line with the median for the last 15 years. Contract U is trading close to the median. The prices of subsequent contracts have not changed significantly. The 2025 fall contracts are trading slightly above the median values on the expiration date, while remaining within the interquartile range. The 2026 and 2027 winter contracts continue to be above the upper quartile.
Forward curve compared to 2020-2024
(Lower graph on the right)
Despite the fact that prices for 2025 contracts with delivery in three years have approached the levels of similar contracts for 2023 and 2024, there remains a pronounced skew in the forward curve in segments with the nearest (1–2 years) and most distant (5–6 years) deliveries.
Current stocks and forecast for next week compared to 2019-2024
For week 30 (July 21-27), we expect an increase in storage of 39 BCF. The fill rate remains firmly above the median for the previous five years. Injection rates are maintaining positive momentum. If the current supply and demand conditions remain unchanged, peak levels similar to those seen in 2024 are possible. Weather and seasonal phenomena in the second half of summer and early fall remain a limiting factor.
Weekly HDD+CDD total based on current NOAA data and forecast for the next two weeks compared to 1994-2024
In the current week 31, despite expectations of HDD+CDD growth, the weather stabilized and reached the 30-year median. The following week (32) is forecast to be at the median level. The seasonal peak in weather has practically passed, and a decrease in HDD+CDD values is expected going forward.
(The graph on the left)
Explanation of the graph: the candles represent quantiles for 30 years from 1994 to 2024. Red dots represent 2024, green dots represent 2025, and blue dots represent the 2025 forecast.
Weekly HDD+CDD total based on current NOAA data and forecast for the next two weeks compared to 1994-2024 by region
(The graph at top right)
Looking at the regional breakdown, we can see moderate HDD+CDD levels in weeks 31-32 in virtually all regions except WS CENTRAL and MOUNTAIN.
Weekly total supply/demand difference compared to 2014-2024
In the current 31st week, the difference between supply and demand rose sharply above the median. With a slight decline in LNG exports, consumption for power generation and industrial production rose sharply.

GOLD: Strong Bullish Sentiment! Long!
My dear friends,
Today we will analyse GOLD together☺️
The recent price action suggests a shift in mid-term momentum. A break above the current local range around 3,296.556 will confirm the new direction upwards with the target being the next key level of 3,310.375 and a reconvened placement of a stop-loss beyond the range.
❤️Sending you lots of Love and Hugs❤️
XAUUSD
XAUUSD Updated in 15M :
The gold signal is marked on the chart based on the latest price changes and the supply and demand in the market. These points include the entry point, stop loss, and take profit.
XAUUSD-4HXAU/USD – 4H Technical Analysis
Gold (XAU/USD) is currently testing the upper boundary of a descending channel on the 4-hour chart. The overall trend remains bearish, and this resistance zone may act as a potential reversal point.
If price fails to break above the channel resistance, a downward move toward the lower boundary is likely.
🔹 Trend: Bearish
🔹 Entry Zone: Near channel resistance
🎯 Target: 3250
🛑 Stop-Loss: 3221
Traders should watch closely for bearish price action signals at the top of the channel. A confirmed rejection could offer a shorting opportunity.

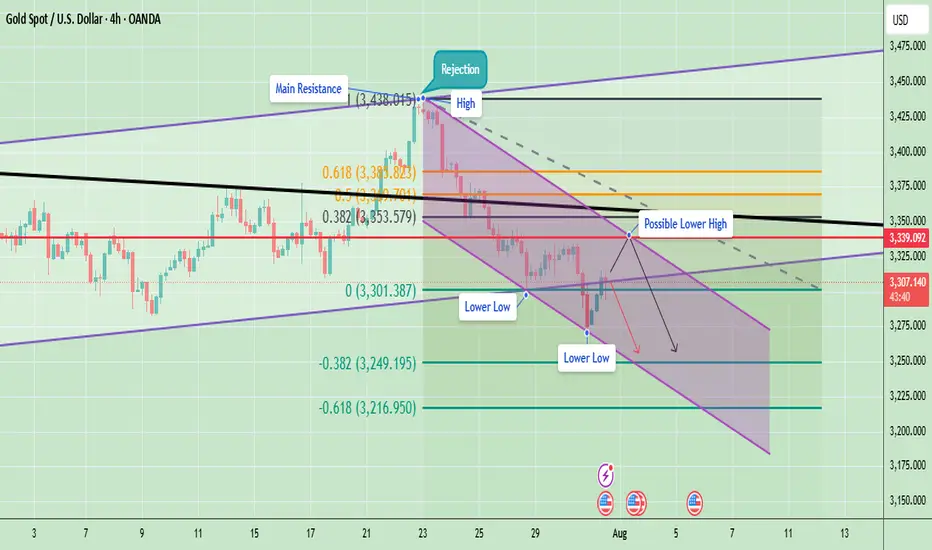
Gold Struggles at Resistance – Indicates Lower Lows AheadGold has been in a clear downtrend after facing a strong rejection around the 3,438 level (main resistance zone). Price is currently moving within a descending channel, confirming the formation of lower highs and lower lows – a classic bearish market structure.
Currently, Gold is trading near 3,306, facing resistance at 3,339 (marked as a possible lower high). If price fails to break above this level and sustain, there is a strong probability of continuation towards 3,249 and even 3,216.
Key Technical Highlights
- Immediate Resistance: 3,339 – 3,353
- Support Levels: 3,301 (short-term), 3,249, and 3,216
A rejection near 3,339 can lead to another leg down targeting 3,249 and 3,216. However, a strong breakout above 3,339–3,353 could temporarily shift momentum towards 3,394.
Note
Please risk management in trading is a Key so use your money accordingly. If you like the idea then please like and boost. Thank you and Good Luck!
Repeated pattern?We have to wait and see whether gold is going to repeat the same pattern or if this time it manages to rise from that level.
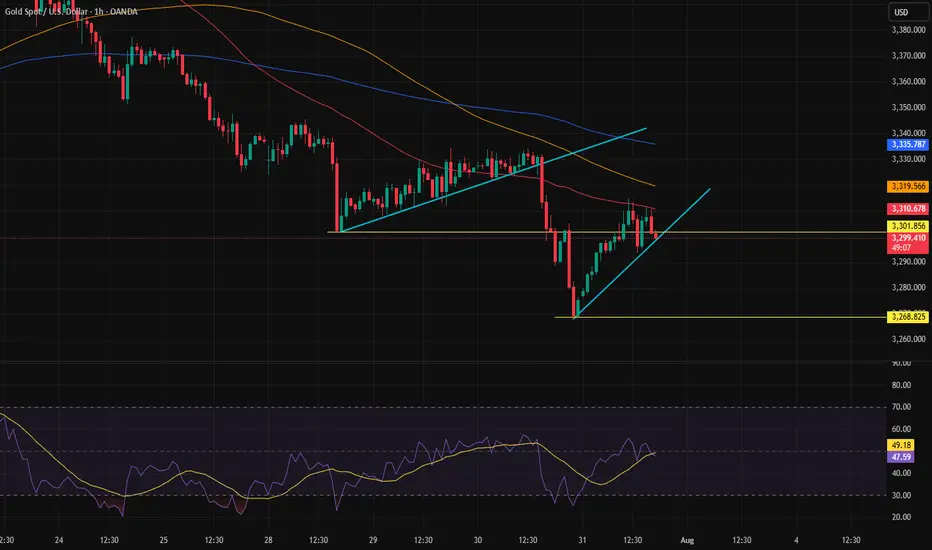
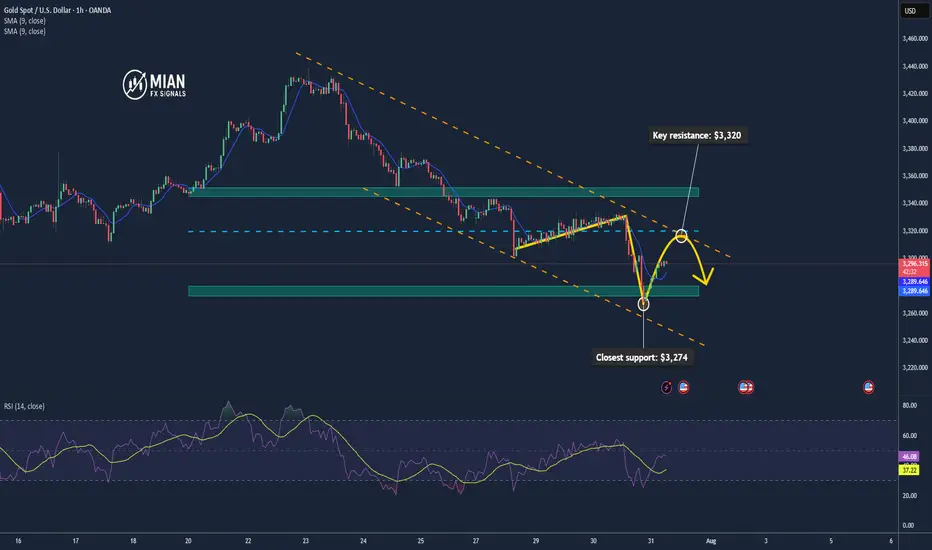
Gold May Rise Technically after Testing the $3,300 Zone📊 Market Overview:
Spot gold is trading around $3,295–$3,301/oz, influenced by slightly lower U.S. Treasury yields and a softer dollar tone. Analyst consensus from Reuters projects gold likely to stay above $3,220/oz through 2025 and possibly hit $3,400 in 2026 amid continued safe-haven demand
📉 Technical Analysis:
• Key resistance: $3,320 / $3,345
• Closest support: $3,274 – $3,280
• EMA09: Price is currently below the 9 period EMA on H1, indicating a short-term bearish bias.
• Candlestick / volume / momentum: There was a minor bounce from the support zone around $3,274, but volume remains low. RSI isn't oversold, suggesting room for technical pullback.
📌 Outlook:
Gold may experience a technical rebound if it holds above $3,280. A breakout above $3,320 would likely require clear catalyst—such as weak U.S. data or a dovish Fed tone.
💡 Suggested Trading Strategy:
SELL XAU/USD: $3,320 – $3,323
🎯 TP: 40/80/200 pips
❌ SL: $3,326
BUY XAU/USD: $3,279 – $3,282
🎯 TP: 40/80/200 pips
❌ SL: $3376
Gold Market Eyes Daily Demand Zones at 3270–3315Gold market aligns with daily candle formation, seeking to mitigate substantial demand zones between 3270 and 3315. This area may provide the necessary liquidity for a potential bullish reaction, pending confirmation. follow for more insights , comment and boost idea
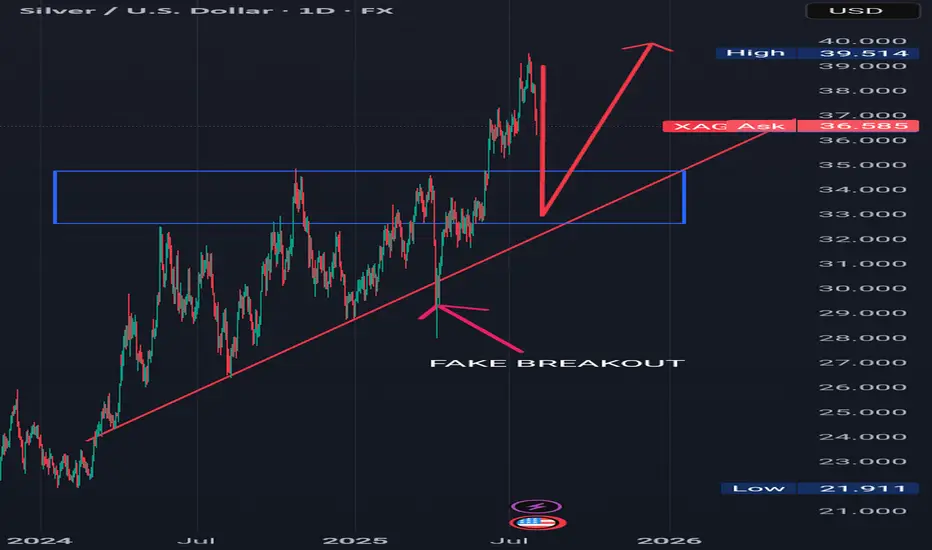
BUY AFTER THE PULLBACK Analyzing the daily time frame of silver, we can see that silver is in a bullish uptrend.
The price of silver is respecting a rising trend line which is acting as support in the past, only for some few times in the past did it exhibit a fake breakout which is indicated with an arrow.
I see the price of silver from its current price actions selling to our required point of interest and looking for buy liquidity to buy at our confluence which is both previous resistance which was broken to the upside which I indicated with a blue rectangle and a rising trend line.
Please look for buys at the previous broken resistance which is indicated with a blue rectangle in confluence with a rising trendline.
.............,...........................................
Please kindly share your thoughts on silver
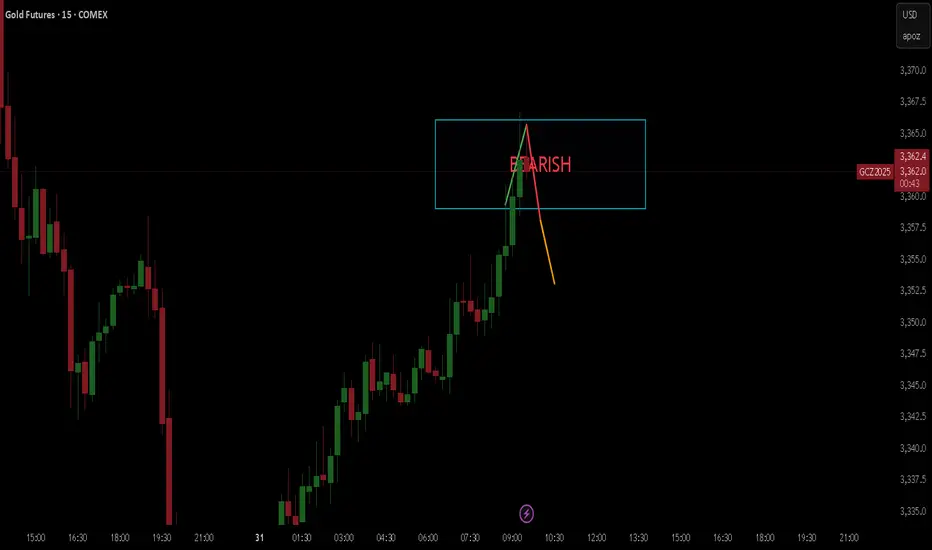
GOLD BEARISHHello,
I hope you are well.
I have an excellent opportunity for you on gold.
I see a 90% chance that gold will start to fall, so get your strategies and money management ready!