Gold Spot / U.S. Dollar Analysis (15-Minute Chart)Key Levels
Support Levels:
Immediate: 3,294.000 (S/L level)
Next: 3,280.000
Resistance Levels:
Immediate: 3,304.000 (Entry level)
Next: 3,308.000, 3,316.250, 3,320.000
Profit Targets:
Tiered levels up to 3,328.000 (highest target).
Price Action & Trends
Current Trend:
The price is bullish (+0.84% today) but hovering near the entry level (3,299.000) and testing 3,302.700.
The presence of multiple profit targets above suggests a bullish bias in the trade setup.
Critical Observations:
Price recently dipped to 3,294.000 (S/L) but rebounded, indicating buying interest at support.
The 3,304.000 level (entry) now acts as resistance. A breakout above could target 3,308.000+.
Volume & Momentum:
Not visible in the screenshot, but the upward movement suggests moderate bullish momentum.
Trade Setup Analysis
Entry: 3,299.000
Stop-Loss: 3,294.000 (5 USD below entry)
Profit Targets:
3,304.000 (Breakeven+)
3,308.000 → 3,328.000 (Scalping opportunities).
Risk-Reward Ratio:
If targeting 3,328.000, the RR is ~5:1 (29 USD profit vs. 5 USD risk).
Actionable Insights
Bullish Scenario:
Hold if price sustains above 3,304.000 (entry resistance).
Next target: 3,308.000.
Bearish Caution:
If price falls below 3,294.000 (S/L), exit to limit losses.
Watch for rejection at 3,304.000 (potential reversal).
Market Context:
Gold is sensitive to USD strength and geopolitical events. Monitor broader trends for confirmation.
Futures market

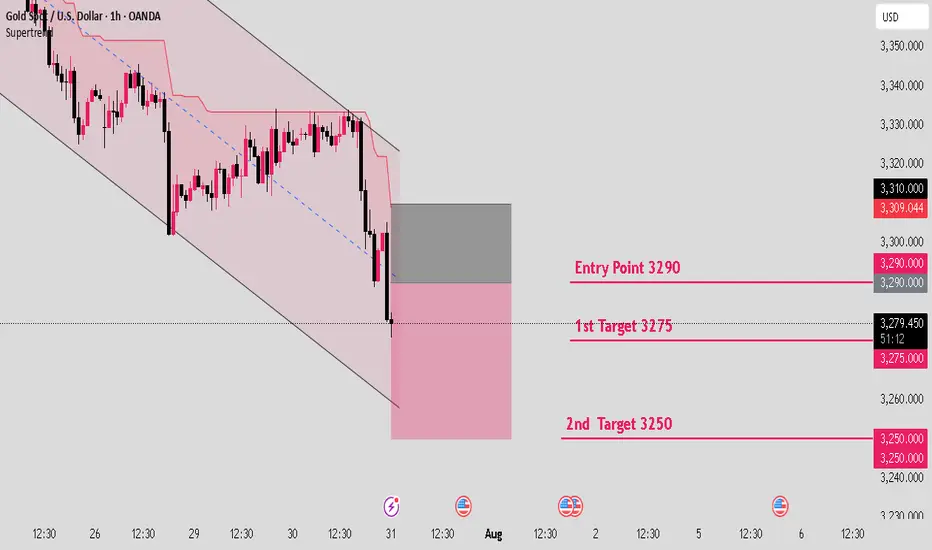
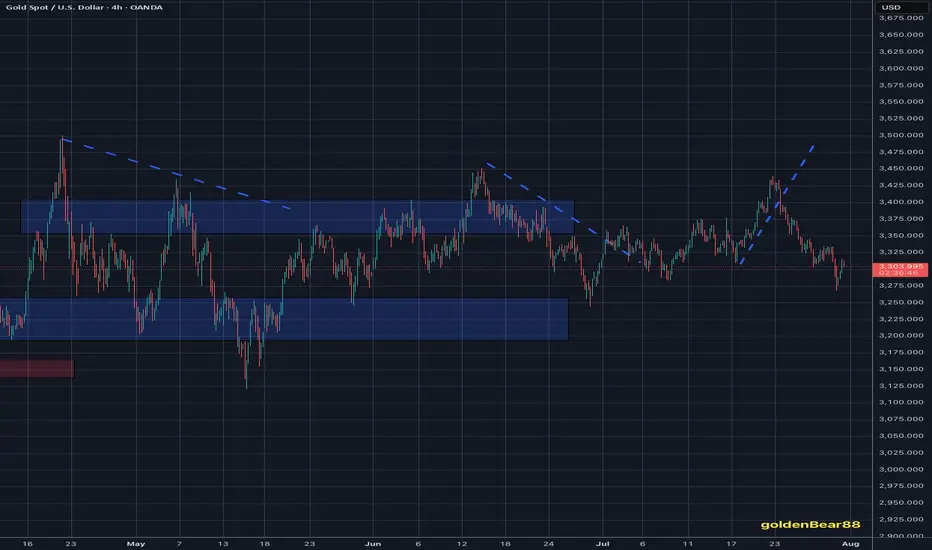
Gold will drop like rain till 3250.Hello IGT FOLLOWER'S
Here is my gold overview, According to me Gold is currently facing resistance around the 3290–3310 zone. This setup anticipates a rejection from this area, with bearish momentum expected to push price downward. A break above 3310 would invalidate the setup, so risk management is key.
Key points:
Entry point: 3290
1st target : 3275
2nd target: 3250
Follow me for more latest updates and signals
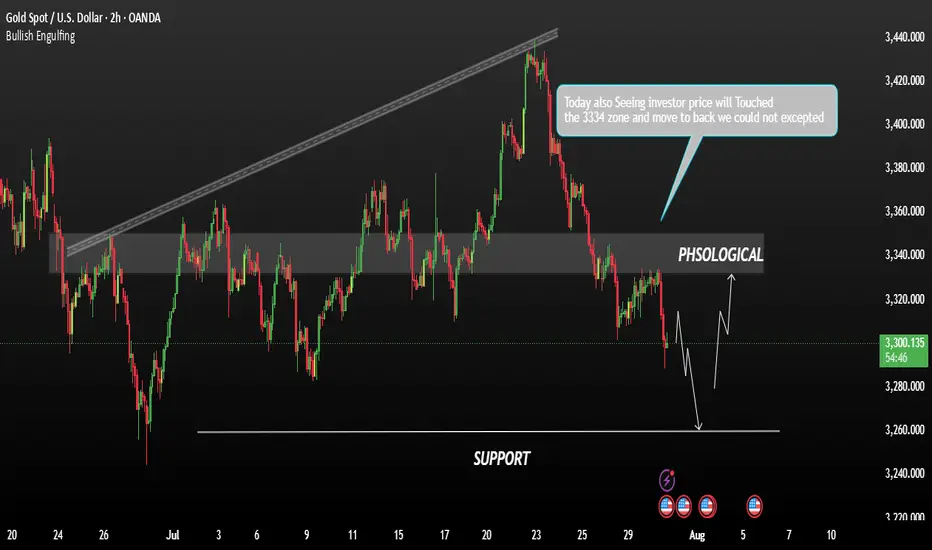
XAUUSD – Bearish Outlook Ahead of FOMCGold is currently under bearish pressure as markets await the highly anticipated FOMC meeting, scheduled to begin in less than an hour. Investors are closely watching the Fed's interest rate decision and the release of the meeting minutes, which could trigger sharp volatility across the forex and commodities markets.
Technical Outlook:
From a technical perspective, the price action suggests a potential continuation of the bearish trend. If the FOMC event leads to a stronger U.S. dollar or a hawkish tone from the Fed, gold prices may decline further.
Resistance Zone; 3315 / 3330
Support Levels: 3282 / 3260
You May find more details in the Chart.
Trade wisely Best Of Luck Buddies.
Ps: Support with like and comments for better insights Thanks for understand.
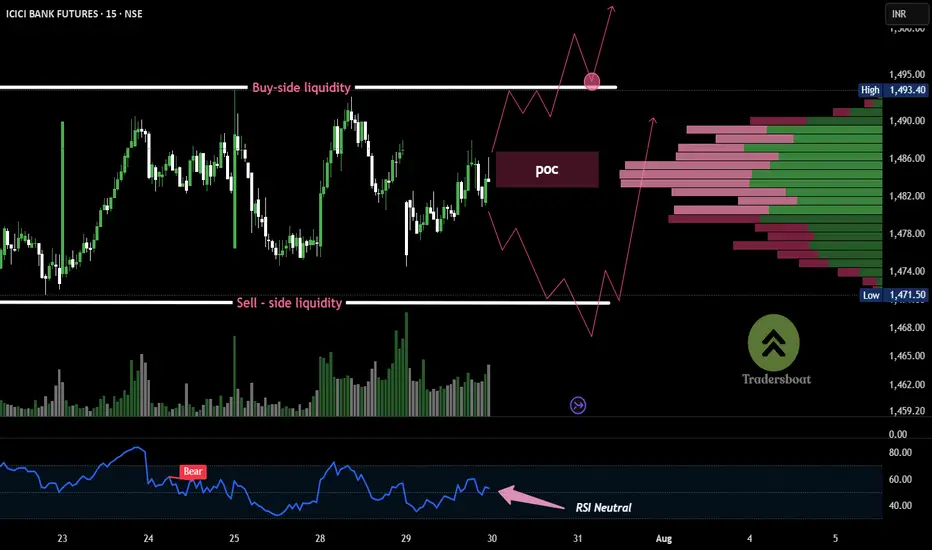
ICICI BANK -15MIN Volume bulge at ₹1485 = decision pointICICI Bank Futures is consolidating in a tight range between ₹1462 and ₹1493, building both buy-side and sell-side liquidity. This structure typically precedes a strong breakout.
The volume profile shows a concentration around ₹1484–₹1486, indicating it as a decision zone. RSI remains weak below 50, suggesting short-term bearish control, but a breakout in either direction could trigger momentum.
HDFC BANK -1H Breakout or fakeout?HDFC Bank Futures is forming a classic ascending triangle pattern, typically a bullish continuation setup. With multiple rejections at the ₹2038 zone and a series of higher lows, a breakout above resistance could trigger momentum buying. Volume profile indicates heavy interest near ₹2000–₹2020 zone, acting as a strong base.
RSI is slowly rising, showing buildup of strength.

Excellent Selling opportunities deliveredGold delivered excellent re-Sell opportunities and as soon as DX started gaining value after GDP numbers, I was confident in Selling direction. I have Sold Gold on #3,324.80 towards #3,318.80 first, then #3,310.80 extension. Then I have Bought Gold (aggressive set of Scalping orders from #3,302.80 - #3,303.80 belt) closed on #3,306.80 and pre-Fed set of Selling orders on #3,294.80 - #3,296.80 closed below on #3,280's. Final order was #3,270.80 Buy which I kept towards #3,292.80 Resistance. All in all spectacular session for me and my Traders.
Technical analysis: As discussed, as long as #3,300.80 - #3,305.80 former Resistance holds, I was aware that Gold was more likely to push towards #3,270’s for a #2-Month Low’s test, still however within the Hourly 4 chart’s Buying accumulation zone. This week was / is packed with Fundamental announcements and real trend should be revealed (as today’s session Fundamental catalyst interfered and was already digested by markets), since today’s Price-action delivered the session High test around #3,300.80 benchmark and most likely market will close above it, triggering most of the late Sellers Stop-losses and as Bond Yields reversed and DX printed another series of Bullish candles above the Hourly 4 chart’s Support, Gold again reversed above #3,300.80 psychological barrier and is comfortably seen Trading above it. This shows how unstable market has become and that I should expect side Swings on Short-term, but those are not cause for an alarm as underlying Medium-term trend remains Bullish and I am there ready with my key entry points to Profit on this perfect Price-action for my current Trading model.
My position: I do not expect Gold to continue soaring with DX on such numbers and my practical suggestion is to Sell every High's that Gold deliver (in & out as I prefer to do).

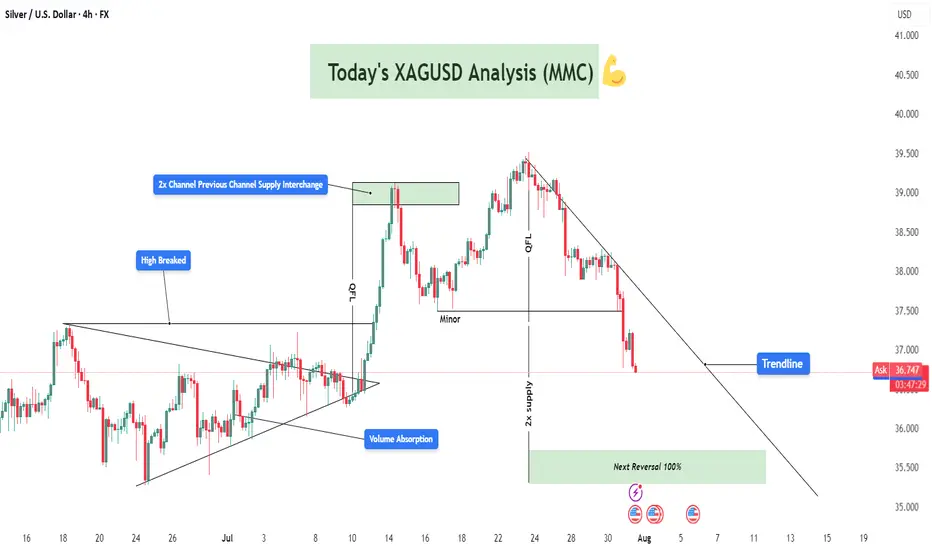
XAGUSD Analysis : Bearish Setup 2x Supply to Next Reversal Zone🔍 Market Context & Technical Overview
Silver (XAGUSD) has recently gone through a sharp corrective phase after breaking above a key structural high and retesting previous resistance. The current price action reflects a clean MMC-patterned behavior, including volume absorption, QFL trap, and interaction with a descending trendline that has now become critical for further directional bias.
🧠 Key Observations Based on MMC Principles
🔵 1. Volume Absorption at the Triangle Breakout
After a prolonged consolidation phase inside a triangle pattern, volume absorption took place—indicating hidden accumulation.
A breakout above the structure was confirmed with momentum (also breaking a previously established “High Breaked” level).
This breakout led to a vertical move towards the 2x Channel Supply Interchange Zone, where price reversed sharply.
🟥 2. Supply Interchange Zone (2x Confirmed)
Price encountered resistance at the green supply block, which acted as a 2x supply zone—a critical confluence where previous sellers re-engaged.
This area had previously served as the channel boundary, creating a supply interchange effect.
⚠️ 3. QFL Zone Trap (Fake Momentum)
The price printed a QFL structure, where it created a flat base, faked a move up, and quickly reversed.
The QFL base acted as a trap for late buyers, which aligned with the start of a bearish phase that is still ongoing.
📉 4. Downtrend & Trendline Respect
Price has respected a strong descending trendline since the reversal at supply.
Each retest has resulted in a lower high, confirming the bearish structure is intact for now.
Currently, the price is trading below this trendline, reinforcing short-term bearish sentiment.
📦 Key Levels to Watch
Zone/Level Type Role
38.70 – 39.20 2x Supply Zone Strong resistance, reversal origin
37.40 – 37.60 Minor Level Short-term support turned resistance
36.00 – 35.40 Next Reversal Zone ✅ High-probability long area, MMC expects reaction
Trendline Dynamic Structure control, needs break for bullish shift
🔁 Scenarios Based on Structure
📈 Scenario 1: Bullish Reversal from Green Demand Block
Price is approaching the next MMC reversal zone (green box below 36.00).
MMC logic suggests a 100% probability of bullish reaction based on:
Volume cycle completion
Downward exhaustion
Proximity to previous institutional accumulation zones
Expected move: bounce toward trendline retest and minor resistance at ~37.50.
📉 Scenario 2: Break Below Green Zone = Panic Sell
If the green zone fails to hold:
A panic drop toward 34.80–35.00 is possible.
However, based on MMC mapping, this is less likely without a major macro catalyst.
💡 Strategic Thoughts (MMC Traders’ Lens)
We’re observing a classic MMC Phase 3 correction following Phase 2 expansion.
The current cycle favors reaccumulation, especially if a wick or engulfing candle forms inside the green zone.
Price action traders should wait for confirmation (e.g., break of trendline, bullish structure on 1H) before entering.
📌 Educational Trade Plan (Not Financial Advice)
Setup Entry Zone Stop Loss Target 1 Target 2
Reversal Long 35.80 – 36.20 35.40 37.50 38.70
Trendline Break Long Above 37.10 36.40 38.00 39.00
Bearish Continuation Below 35.40 36.10 34.80 33.90
🧾 Conclusion & Final Note
Silver is trading at a make-or-break point as it approaches a high-probability reversal zone, identified through MMC methodology. Watch the price action near 36.00 closely—it holds the key to whether we begin a new bullish phase or extend this bearish cycle.
✅ MMC traders will stay reactive, not predictive, and align with structure.
🚨 Patience is key—let the market show its hand before commitment.
GOLD BUY M15 Gold (XAUUSD) 15-Min Chart Analysis – July 31, 2025
The chart shows a clear bullish structure after a confirmed Change of Character (ChoCH) and Break of Structure (BOS) on the lower time frame. Price has broken above previous resistance zones, indicating strong buying momentum.
Entry Zone:
Price is currently retesting a demand zone (highlighted in pink).
Ideal buy entry was taken after the bullish ChoCH.
Stop Loss:
SL: 3397, placed just below the demand zone for risk protection.
Targets / Resistance Levels:
1. First Resistance: 3308
2. Second Resistance: 3311
3. Third Resistance: 3316
4. Final Target: 3325
Bias:
Bullish, expecting higher highs as long as price holds above the demand zone.
Break and retest strategy is forming, suggesting continuation toward the final target.

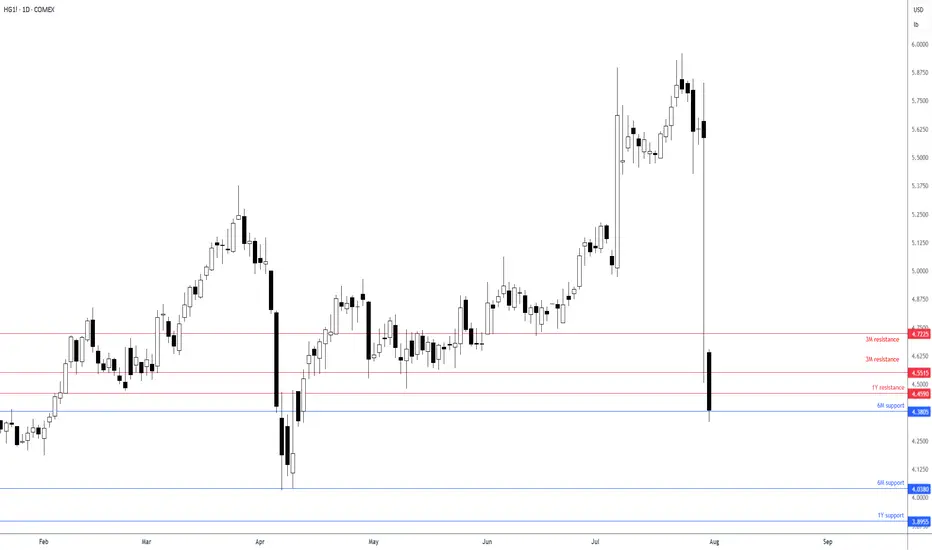
Copper testing support!Following the surprise announcement that the US administration is exempting tariffs on refined metals, the price of copper has tanked and connected with a 6M support from US$4.3805. Notably, directly above, we have a 1Y resistance level from US$4.4590 and a 3M resistance level at US$4.5515, while a breakout south could lead the base metal to as far south as 6M support at US$4.0380.
Given the downside momentum, a breakout lower could serve to add to the current bearish flow and potentially see sellers pyramid positions.
Written by the FP Markets Research Team
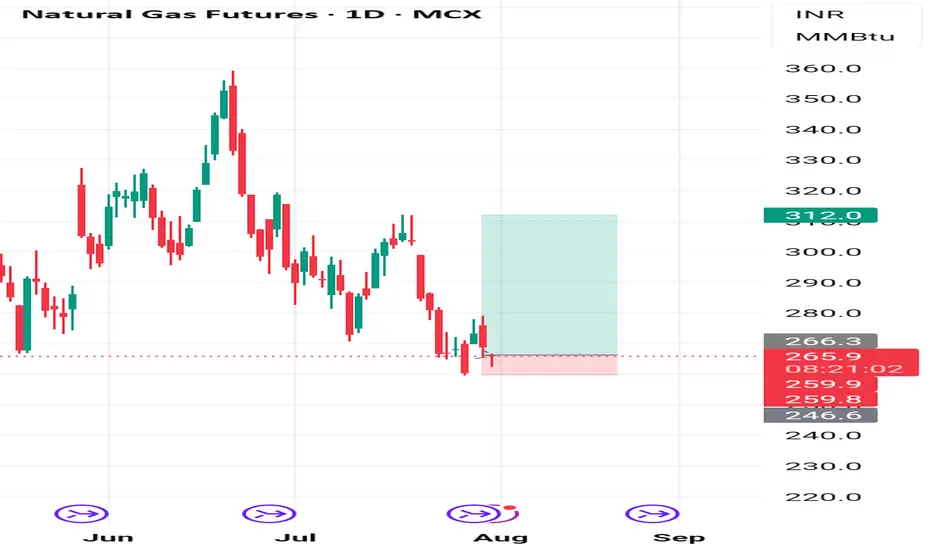
NatGas short term long opportunity Natgas MCX future may go upside target of 300+ from Cmp - 265 , SL - 259. If Buyer Accumulate and sustain level of 265 . Time horizon - 4-6 weeks
Report - 31 jully, 2025Summary
Initial optimism following the historic US–EU trade agreement has swiftly eroded as France and Germany openly criticized the deal, warning it undermines EU sovereignty and economic stability. The euro fell sharply, carmakers led equity declines, and political fractures within the bloc widened. While the deal averted a full-blown trade war, concerns over inflation, competitiveness, and regulatory submission have shifted sentiment. The perception of European capitulation under pressure from Trump has reignited transatlantic tensions and injected fresh volatility into global markets.
This retreat in EU support underscores the precarious nature of transatlantic cooperation under Trump’s economic nationalism. Meanwhile, signs of tech decoupling, tariff expansion beyond the EU, and deferred retaliation signal a fractured global trade order. European fiscal policy, particularly Germany’s defense-driven deficit expansion, is now under heightened scrutiny amid market volatility and FX pressure.
Market Reactions
Equity markets across the EU opened higher on tariff relief expectations but reversed course as Germany’s Chancellor Merz and France’s Prime Minister Bayrou denounced the deal. The DAX fell 1.1%, CAC 40 slipped 0.4%, and eurozone auto stocks plunged 1.8%. The euro lost over 1% against the dollar in its second-largest daily drop this year, reflecting concern over structural imbalance and political subordination.
In contrast, semiconductor stocks surged, with ASML and BE Semiconductor rising over 4% as the tech sector escaped tariffs. Wall Street remained relatively stable, buoyed by optimism around defense, energy, and tech sectors gaining from the deal. The dollar index (DXY) rose 0.9%, reflecting both euro weakness and expectations that inflationary tariffs could keep Fed rates elevated.
Fiscal and Political Implications
The backlash from Berlin and Paris lays bare deep fractures within the EU regarding its posture toward Washington. Chancellor Merz’s warning of "considerable damage" and Bayrou’s reference to EU “submission” cast doubt on Ursula von der Leyen’s negotiation strategy. The deal’s imposition of a 15% baseline tariff—triple the pre-deal weighted average—exposes Europe to substantial cost increases without achieving reciprocal liberalization.
Internally, the European Commission is accused of caving to U.S. pressure while undermining its own credibility. Documents and diplomatic leaks suggest that more aggressive retaliatory planning was watered down due to fears of a broader security rupture, particularly concerning NATO and U.S. arms support to Ukraine. This reinforces the EU’s strategic dependency, limiting its ability to resist U.S. economic coercion.
Germany’s effort to shield its auto industry via offset schemes largely failed, while Brussels’ “trade bazooka” was shelved in favor of “strategic patience.” This perceived capitulation may embolden further unilateral action from the U.S., especially as Trump eyes tariffs on pharmaceuticals and rest-of-world imports up to 20%.
Strategic Forecasts
Europe's short-term economic outlook has darkened. The tariff burden—especially on high-margin exporters like German autos—raises inflation risks while lowering competitiveness. Political backlash could destabilize Commission leadership and provoke calls for more aggressive economic sovereignty.
Expect further euro weakness, sectoral underperformance in autos and industrials, and possibly downgrades to GDP forecasts across the eurozone. On the U.S. side, Trump’s success with transatlantic leverage may embolden him to expand tariff threats to Asia and Latin America. The Fed will likely face a more inflationary policy environment, with fiscal and protectionist stimulus prolonging higher rate expectations.
Simultaneously, China's relief from U.S. tech export freezes—designed to secure a Xi-Trump summit—adds complexity to the strategic tech rivalry. The suspension of chip export controls could spur near-term capital inflows to Chinese AI firms while igniting concern in U.S. defense circles.
Risks and Opportunities
Risks
Breakdown in EU cohesion and trust in Commission leadership
Expansion of U.S. tariffs to rest of world (ROW), escalating global trade friction
Retaliation by China if U.S. chip diplomacy reverses
Drag on European industrial profits and inflation-driven ECB recalibration
Fed rate path upwardly skewed due to structural tariff-driven inflation
Opportunities
U.S. defense and energy sectors benefit from guaranteed EU purchases
Semiconductors remain shielded, with valuation support in ASML, TSMC, Nvidia
Dollar strength provides tactical trades in EURUSD, GBPUSD
Select EM exporters (e.g. Brazil) benefit from re-diversified trade flows
AI hardware and chip infrastructure (Samsung–Tesla deal) gains strategic momentum
Key Asset Impact – Outlook
XAUUSD (Gold):
Gold holding firm around $3,340. With fresh political discord and rising protectionist inflation, gold remains a hedge. If Fed signals rate hold, expect a push to $3,400.
Bias: Bullish
S&P 500:
Resilient, driven by defense, energy, and AI. But prolonged strong dollar and tariff-induced input cost pressures are risk factors.
Bias: Moderately Bullish
Dow Jones:
Benefiting from defense and dividend-heavy mix, but under pressure from industrial drag.
Bias: Neutral to Bullish
DXY (US Dollar Index):
Strengthening on euro weakness and policy divergence. However, long-term Fed autonomy concerns and political volatility could reverse trend.
Bias: Bullish short-term, Neutral longer-term
USDJPY:
Little movement today. BoJ still cautious, yen capped unless Fed shifts dovish or global risk-off resumes.
Bias: Range-bound
EURUSD:
Second-largest single-day drop YTD. Political backlash and export headwinds limit upside.
Bias: Bearish
Crude Oil (WTI):
Flat to slightly higher, supported by EU commitment to U.S. energy, but demand data remains soft.
Bias: Neutral
Stoxx Autos:
Heavy selloff (-1.8%) despite tariff reduction, reflecting margin pressure.
Bias: Bearish
ASML / BE Semiconductor:
Relief rally on tariff exclusion. Long-term tailwinds from open AI infrastructure and Samsung–Tesla chip deal.
Bias: Bullish
Following the signing of a landmark trade deal between the U.S. and the European Union, immediate relief in financial markets has quickly given way to political and economic backlash within the EU. France and Germany, two of the bloc’s largest economies, have openly criticized the agreement, warning it will damage their industrial competitiveness and economic sovereignty. German Chancellor Friedrich Merz labeled the 15% blanket tariff “damaging” for both Europe and the United States, while French Prime Minister François Bayrou called it a “dark day” for EU autonomy. Despite avoiding a full-blown transatlantic trade war, the nature of the deal — seen by critics as submission under U.S. pressure — has sharply divided European leaders and exposed internal fractures in Brussels' negotiation strategy.
Market reactions reflect this shift in sentiment. The euro recorded its second-largest single-day drop this year, falling 1.1% against the dollar as investor confidence in European political resolve weakened. Equity markets, particularly in Germany and France, reversed earlier gains. The DAX fell 1.1%, the CAC 40 dropped 0.4%, and the Stoxx Europe 600 Auto Index declined by 1.8%, led by steep losses in Volkswagen, BMW, and Mercedes-Benz. While semiconductor stocks bucked the trend — with ASML and BE Semiconductor rising over 4% after escaping tariffs — the overall message was one of fading optimism and growing policy disarray. On the U.S. side, the dollar strengthened, aided by expectations that tariff-driven inflation will keep Federal Reserve interest rates elevated.
President Trump, emboldened by what many perceive as a successful economic power play, has signaled that he may impose tariffs of up to 20% on countries outside the deal framework — effectively targeting much of the global economy. Sectors such as pharmaceuticals and biotechnology appear to be next in line, with chip exports already under scrutiny. This expands the sphere of tariff risk, placing emerging markets and global exporters on high alert. If implemented, these levies could spark renewed capital flows into U.S. assets and exert further downward pressure on global growth forecasts.
The European Union’s failure to mount a credible retaliatory response has amplified the perception of its weakened position. Brussels initially suspended its response to U.S. tariffs in April and internal discord among member states diluted the EU’s “trade bazooka.” While a €93 billion retaliatory package was drafted, the effective threat fell to only €9 billion of actionable tariffs after exemptions were carved out for politically sensitive sectors like Irish whiskey and Italian beef. Critics argue that this strategic retreat undermined the bloc’s negotiating leverage. Strategic dependence on U.S. security guarantees — particularly for eastern and northern EU states — contributed to Brussels' caution, as did fears that escalation could prompt Washington to cut off military aid to Ukraine or withdraw from NATO commitments.
Simultaneously, the U.S. has quietly frozen certain export restrictions on China to facilitate a potential trade accord with Beijing and secure a meeting between Presidents Trump and Xi Jinping. The move, which includes halting a ban on Nvidia’s H20 chip, has drawn criticism from over 20 U.S. national security officials who warn that the chip could enhance China's military and surveillance capabilities. Despite these concerns, the Commerce Department has been instructed to avoid further provocative actions for now. This provides a temporary tailwind for Chinese tech equities and hardware manufacturers, though the strategic rivalry between Washington and Beijing remains unresolved.
In the private markets, a notable structural shift is underway. Private equity investors are increasingly opting to cash out of continuation vehicles — special funds used to extend ownership of portfolio companies — rather than roll over their stakes. Liquidity has become paramount as traditional exits via IPOs and trade sales remain scarce. Data from Houlihan Lokey shows that over 85% of investors chose to exit such vehicles in 2025, up from 75% last year. This underscores broader risk aversion and signals a waning appetite for illiquidity and long-duration exposure in uncertain macro conditions.
Overall, the global strategic landscape is growing more fragmented. Europe is politically divided and economically exposed. The U.S. is leveraging its market dominance to enforce strategic compliance, while China is benefiting from a temporary softening in U.S. export policy. Capital is flowing toward liquidity, defensives, and tech infrastructure — and away from uncertainty and regulatory entanglement. Investors should remain attuned to central bank reactions, retaliatory threats, and sudden shifts in geopolitical posture over the coming weeks.


Gold (XAU/USD) Analysis:Following yesterday's Fed statements regarding the economic impact of tariffs and the decision to keep interest rates unchanged, gold prices dropped to $3,268, before rebounding today to retest the $3,310 zone. The short-term trend remains bearish.
1️⃣ A break and hold below $3,300 may push the price toward $3,280, and potentially $3,260.
🔻 A confirmed break below $3,260 could lead to a deeper decline toward a strong support zone near $3,245.
2️⃣ On the other hand, if bullish momentum appears and the price breaks above $3,310, it may open the path to $3,330 — a key level that could trigger a bearish rejection.
📈 However, if the price holds above $3,330, the next target would be $3,350.
⚠️ Disclaimer:
This analysis is not financial advice. It is recommended to monitor the markets and carefully analyze the data before making any investment decisions.

Long - Buy Tata Motors Target 900Tata motors is in buy mode and in few months you will see price reaching to 900/-.

Crude Oil: Buying Pressure StrengthensFenzoFx—Crude Oil maintained its bullish trend with an ideal dip for entry on July 25. Stochastic and RSI 14 indicate overbought conditions, suggesting intensified buying pressure. A breakout seen yesterday reinforces the bullish bias.
Our projection remains optimistic, targeting a move toward the Fair Value Gap zone, extending to $73.8. However, if Oil closes below the $69.3 support, the bullish outlook will be invalidated.

Analysis on the Elite PairsYou can follow us for more Analysis(Images and Videos) with Precise definition of the Financial Market.ENJOY!!!

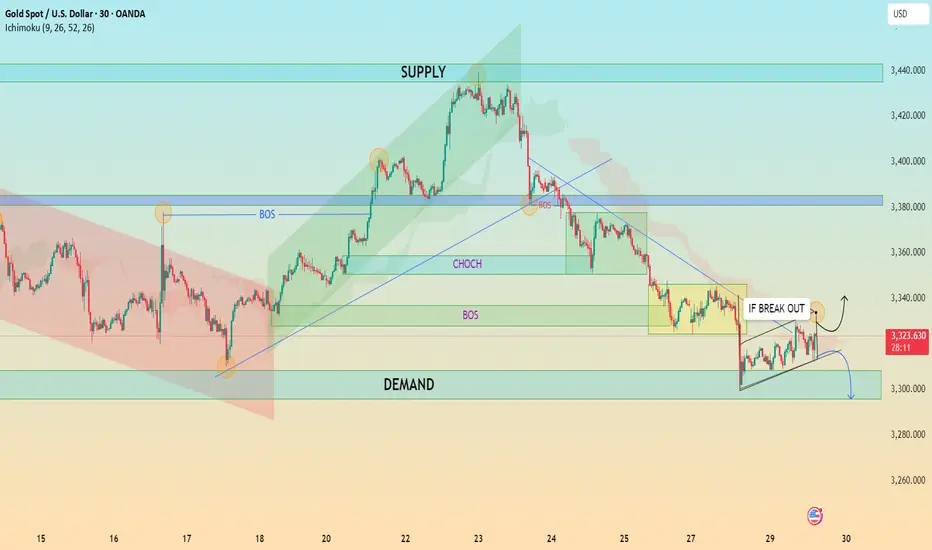
XAU/USD Analysis – Critical Breakout Zone Approaching 30M Chart📈 XAU/USD Analysis – Critical Breakout Zone Approaching (30-Minute Chart)
🔍 Technical Overview:
Chart Type: 30-minutes
Indicators: Ichimoku Cloud
Key Structures: Supply & Demand Zones, CHoCH, BOS, Trendlines, Triangle Formation
🔑 Key Market Observations:
🟢 Demand Zone (Support) ~ $3,300 – $3,310
This area has been tested multiple times and has shown strength in absorbing selling pressure.
A bullish triangle formation is converging into this zone, suggesting a potential breakout point is near.
🔴 Supply Zone (Resistance) ~ $3,375 – $3,390
Repeated price rejection from this zone marks it as a strong institutional-level resistance.
Price needs a clean breakout and volume confirmation to push through this level.
📉 Break of Structure (BOS) & Change of Character (CHoCH):
BOS and CHoCH levels are clearly marked, showing a trend shift from bullish to bearish (post-supply test).
The last CHoCH aligns with a lower high, reinforcing bearish dominance unless invalidated.
📐 Symmetrical Triangle Formation:
Price is squeezing between higher lows and lower highs, coiling before a significant breakout.
Two scenarios are outlined:
Bullish Breakout: Clear move above triangle resistance → test of supply.
Bearish Breakout: Breakdown → revisit demand zone or even drop toward $3,280–$3,270.
☁️ Ichimoku Cloud:
Price is currently testing the lower boundary of the Ichimoku cloud.
A bullish breakout into/above the cloud may act as confirmation of a reversal attempt.
💡 Potential Trade Setups:
✅ Bullish Case:
Trigger: Break and close above $3,335 with volume.
Target 1: $3,375 (Supply Zone)
Target 2: $3,440 (Extended Target)
Invalidation: Rejection from triangle top and close below $3,310.
❌ Bearish Case:
Trigger: Break and close below $3,310 (triangle breakdown).
Target 1: $3,280
Target 2: $3,260
Invalidation: Bullish breakout of triangle and flip of previous CHoCH level.
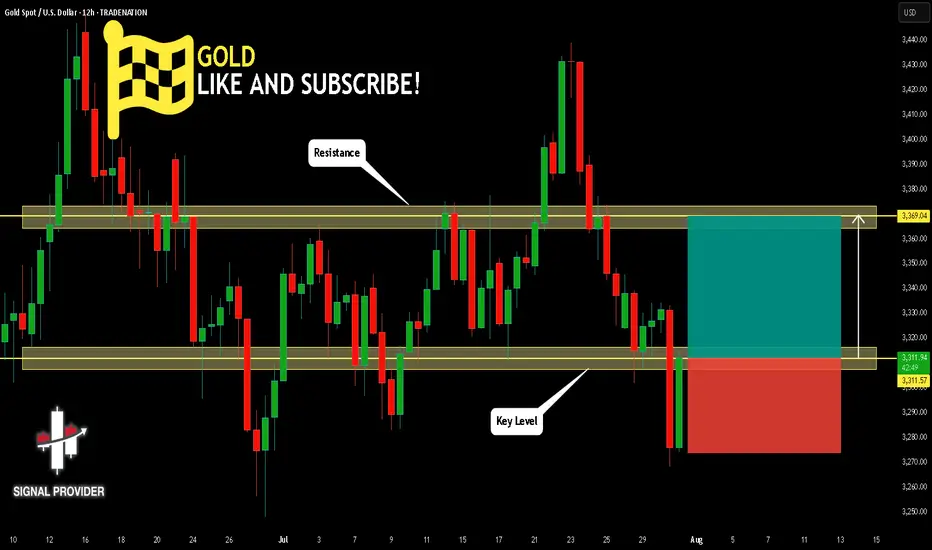
GOLD Will Go Higher From Support! Buy!
Here is our detailed technical review for GOLD.
Time Frame: 12h
Current Trend: Bullish
Sentiment: Oversold (based on 7-period RSI)
Forecast: Bullish
The market is testing a major horizontal structure 3,311.57.
Taking into consideration the structure & trend analysis, I believe that the market will reach 3,369.04 level soon.
P.S
The term oversold refers to a condition where an asset has traded lower in price and has the potential for a price bounce.
Overbought refers to market scenarios where the instrument is traded considerably higher than its fair value. Overvaluation is caused by market sentiments when there is positive news.
Disclosure: I am part of Trade Nation's Influencer program and receive a monthly fee for using their TradingView charts in my analysis.
Like and subscribe and comment my ideas if you enjoy them!
Gold at intraday critical levelIf stays below 3308, Sell target 3257
If breaks above 3308 with significant H1 close, buy target 3334. Apply risk management to enjoy trading at its best.

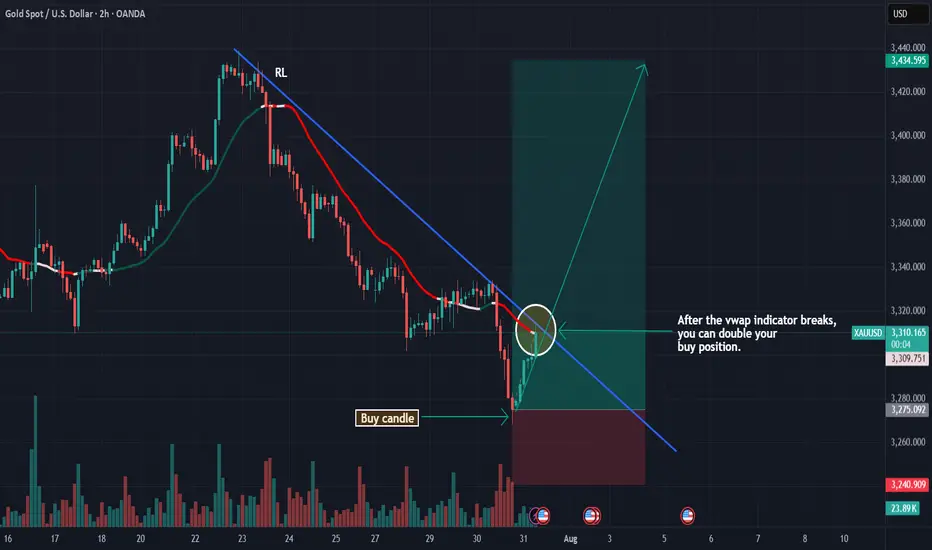
XAUUSD: UptrendOn XAUUSD as you can see on the chart we would have a good uptrend. After the vwap indicator breaks, you can double your buy position.
GOLD USDHI GUYS.
H4 CHART here we see on going buys for sculppers and scul [ping sells around the coner.
forcus on the big pictucture more distance more pips as soon as h4 ,h2,h1 forms a (DB)
DOUBLE BOTTOM then we make entries on long position buys to clear upper area(3400,3439).

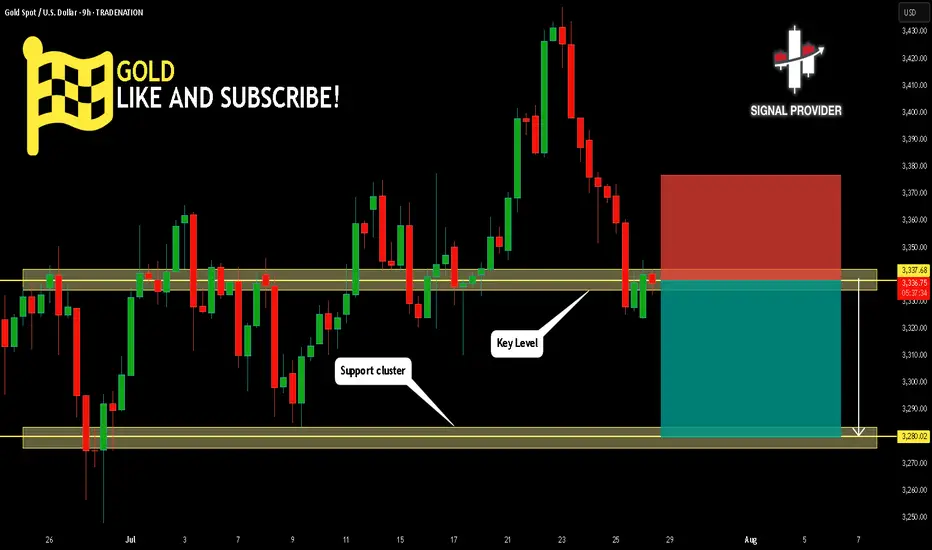
GOLD Will Move Lower! Sell!
Here is our detailed technical review for GOLD.
Time Frame: 9h
Current Trend: Bearish
Sentiment: Overbought (based on 7-period RSI)
Forecast: Bearish
The market is testing a major horizontal structure 3,337.68.
Taking into consideration the structure & trend analysis, I believe that the market will reach 3,280.02 level soon.
P.S
The term oversold refers to a condition where an asset has traded lower in price and has the potential for a price bounce.
Overbought refers to market scenarios where the instrument is traded considerably higher than its fair value. Overvaluation is caused by market sentiments when there is positive news.
Disclosure: I am part of Trade Nation's Influencer program and receive a monthly fee for using their TradingView charts in my analysis.
Like and subscribe and comment my ideas if you enjoy them!