Gold Price Update – Bearish Flag Signals Possible Drop AheadGold is currently trading around $3,324, showing consolidation after a recent decline from the $3,345 region. The chart shows a bearish flag pattern forming after the sharp drop, indicating potential continuation of the downtrend. If gold fails to break above this region, sellers may push the price lower towards $3,301 and possibly $3,275.
The descending trend line adds further bearish pressure, limiting upside momentum unless gold decisively breaks and holds above $3,345. Overall, gold remains under short-term bearish sentiment, with the focus on support retests. Any bullish momentum will only be confirmed if the price closes above the flag and trendline resistance.
Key Points
Resistance Zones: $3,328 (0.618 Fib), $3,345 (flag top).
Support Zones: $3,301 (Fib base), $3,284, and $3,275 (bearish extension).
Trend Outlook: Short-term bearish unless price breaks above $3,345 with volume.
Bearish Targets: $3,301 → $3,284 → $3,275.
Bullish Invalidations: Break and close above $3,345 may shift bias to bullish.
Note
Please risk management in trading is a Key so use your money accordingly. If you like the idea then please like and boost. Thank you and Good Luck!
Futures market

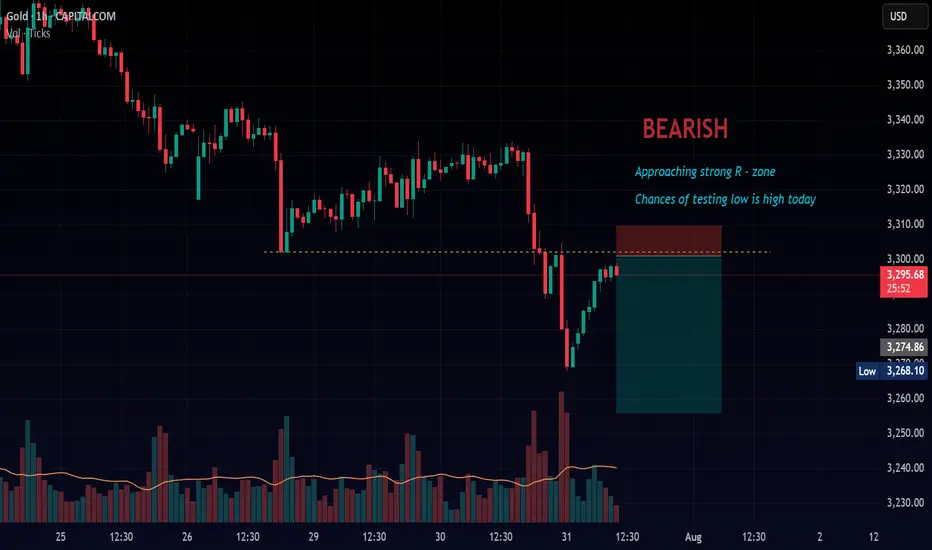
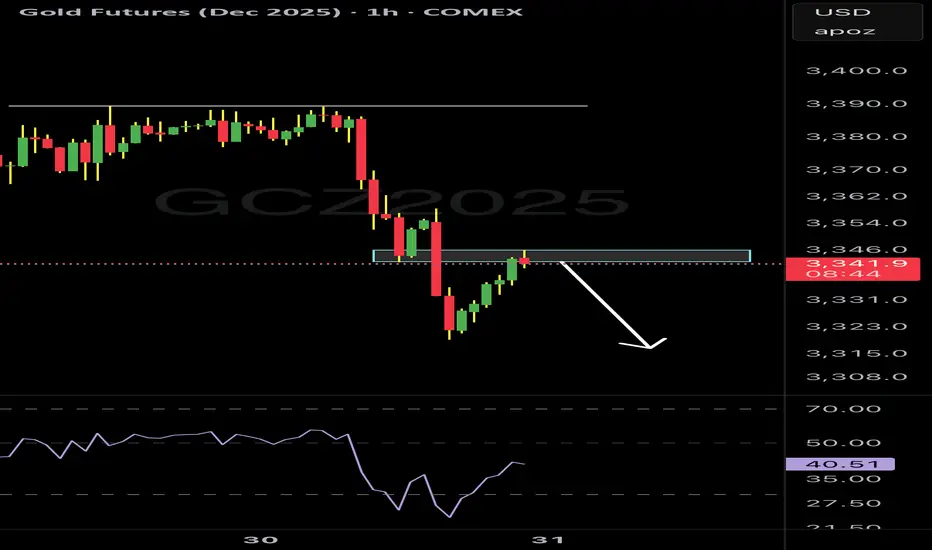
Gold Bearish OpportunityStrong bearish momentum
Close below 3300 could trigger further sell off
Possibility of liquidity & volatility is high due to monthly close - Stay Cautious
Xausd techinical analysis.Xausd techinical analysis next move posibale at h1 time frame not finchinical advice.

Beyond the Chart – GOLD Market Technical Analysis🧠 OANDA:XAUUSD Market Outlook: Gold (XAU/USD)
✅ Bullish Case (Upside Bias)
• Price has reclaimed multiple Fair Value Gaps (FVGs) on the way up.
• Holding above the 0.382 Fib level (3293) indicates moderate bullish momentum.
• A confirmed breakout above 3301 (0.5 Fib) may open the path to key resistance levels:
• 3308 (0.618 Fib)
• 3314 (0.705 Fib)
• 3319 (0.786 Fib)
📌 This move is likely a retracement rally within a broader downtrend — unless price reclaims above 0.786 with strength, confirming a shift in structure.
⸻
🛠️ Trading Plan
• Bullish Setup: Long above 3301, targeting 3308 → 3314, with tight stops.
• Bearish Setup: Look for rejection patterns at 3308–3314 zone, targeting a move back to the 3280 area.
⸻
📘 Disclaimer: This is educational content and not financial advice. Always do your own analysis and manage your risk accordingly

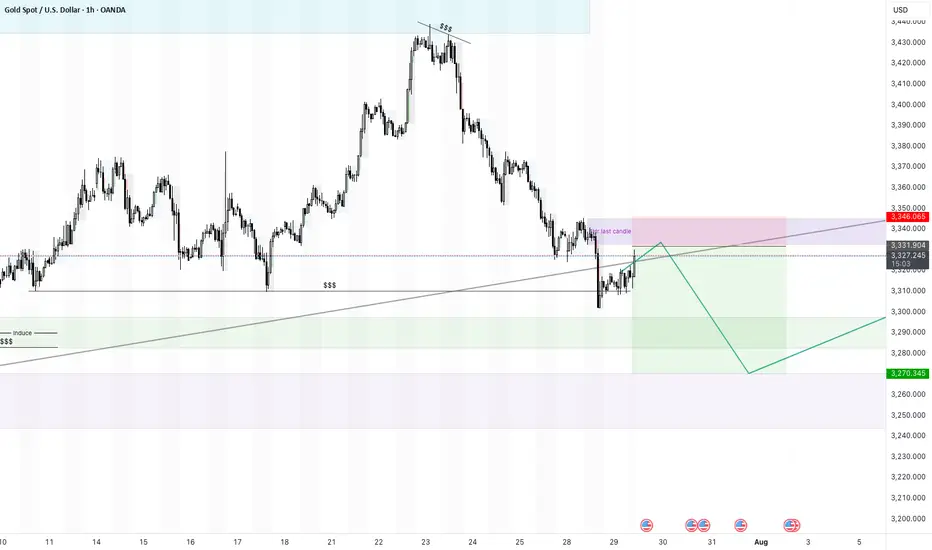
XAUUSD - 29/7/25 - continued bearish There was quite strong bearish momentum yesterday during the US session. Going into Asian session and London session today there is a consolidation bullish. There is a 4 hour zone marked out where i am looking for a retest and continuation bearish to a key zone below where a reversal pivot is expected and then continuing bullish with the larger trend.
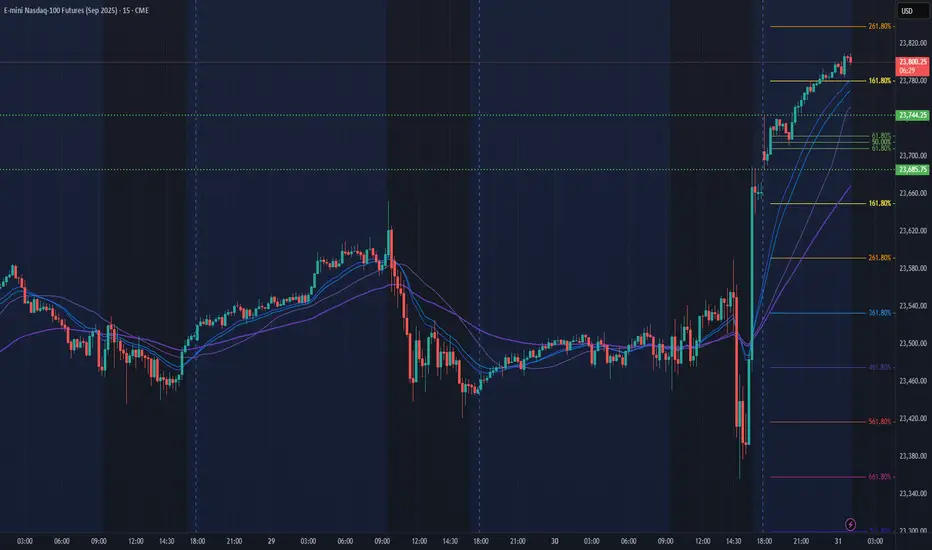
NQ Power Range Report with FIB Ext - 7/31/2025 SessionCME_MINI:NQU2025
- PR High: 23744.25
- PR Low: 23686.00
- NZ Spread: 130.5
Key scheduled economic events:
08:30 | Initial Jobless Claims
- Core PCE Price Index (MoM|YoY)
09:45 | Chicago PMI
New ATHs through Asian hours
Session Open Stats (As of 12:25 AM 7/31)
- Session Open ATR: 244.46
- Volume: 32K
- Open Int: 283K
- Trend Grade: Long
- From BA ATH: -0.6% (Rounded)
Key Levels (Rounded - Think of these as ranges)
- Long: 23811
- Mid: 22096
- Short: 20383
Keep in mind this is not speculation or a prediction. Only a report of the Power Range with Fib extensions for target hunting. Do your DD! You determine your risk tolerance. You are fully capable of making your own decisions.
BA: Back Adjusted
BuZ/BeZ: Bull Zone / Bear Zone
NZ: Neutral Zone
GOLD to all time highsIt is ready
a bitch wave one correction seems to be over so get ready to hit 4.000
GG
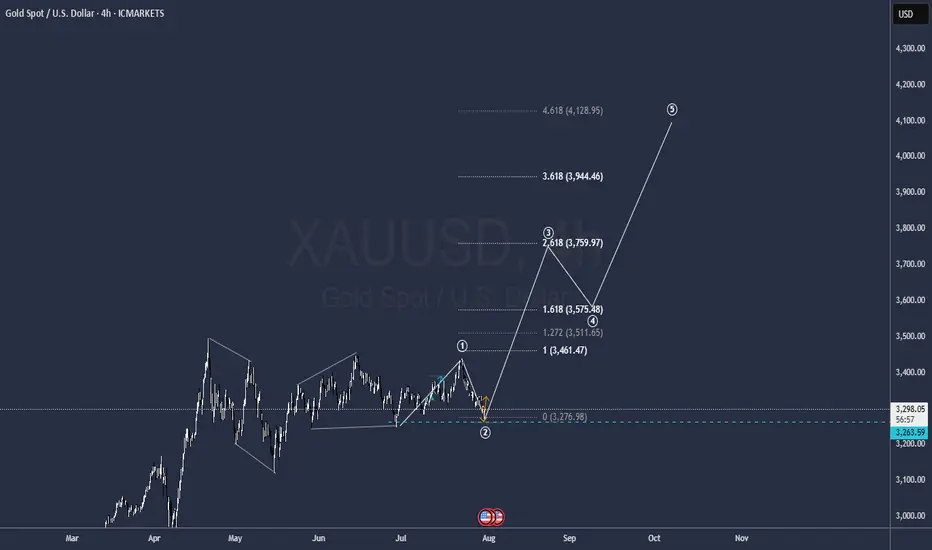
Gold (XAUUSD) – H1 Wave 5 in Progress | Bearish Setup Building📉 Gold (XAUUSD) – H1 Wave 5 in Progress | Bearish Setup Building
🕐 Timeframe: H1
🔍 Strategy: Elliott Wave + Support/Resistance + AO Divergence
The market has likely initiated Wave 5 on the H1 timeframe following a clean 5-wave structure. We’re now watching for the internal corrective Wave 4 of Wave 5 to complete.
📌 Key Zone to Watch:
Fibonacci Level 2.618 lines up with a previous support-turned-resistance zone — a high-probability reversal area.
Awesome Oscillator (AO) shows convergence, signaling weakening bullish momentum.
🔧 Execution Plan:
Waiting for M15 break of structure to confirm the end of the corrective sub-wave.
Will look to enter sell on confirmation of bearish continuation.
🎯 Target Zone:
The shaded green area below marks a strong support zone — potential TP area for Wave 5 completion.

The Federal Reserve maintains a neutral stanceAs the Federal Reserve maintains its neutral monetary policy stance despite acknowledging slowing economic growth, the gold market is attempting to reclaim the $3,300 per ounce mark.
As expected, the Fed kept interest rates unchanged, maintaining them within a range of 4.25% to 4.50%. The most notable change in the Fed's monetary policy statement was a slight downward revision of its assessment of the economy, noting that growth in the first half of the year slowed from the "solid pace" seen in June.
In its monetary policy statement, the Fed stated: "While volatility in net exports continues to impact the data, recent indicators suggest that the growth of economic activity has moderated somewhat in the first half of the year."
The market's initial reaction to the Fed's statement was renewed volatility in gold prices. On Wednesday (July 30), spot gold closed at $3,274.88, down $51.47, or 1.55%, with an intraday low of $3,268.02. In early Asian trading on Thursday, spot gold rebounded to around $3,296, putting it within reach of the previous support level of $3,300.
While the Federal Reserve maintained its neutral monetary policy stance, dissent began to emerge within the committee. Fed Governors Bowman and Waller both voted in favor of a rate cut at this meeting.
However, analysts noted that the split vote was unsurprising, as both committee members had been outspoken about their dovish views.
With the Fed's decision unsurprising, Michael Brown, senior market analyst at Pepperstone, predicts the Fed will be slightly more hawkish this year than the market currently anticipates.
Despite the Fed's current neutral stance, the market still expects the Fed to cut interest rates twice this year, starting as early as September.
"My baseline forecast remains that the resilient nature of the labor market and continued tariff-induced price pressures will keep the Fed on the sidelines for now," Brown said. "My view remains that only one 25 basis point rate cut is likely this year, likely at the December meeting." OANDA:XAUUSD ACTIVTRADES:GOLD EIGHTCAP:XAUUSD FOREXCOM:GOLD EIGHTCAP:XAUUSD
Aussie Shorts Looks Promising This is a pullback trend trade anticipating trend continuation. Entry is based on LVN (low volume node) for entry. Also looking on the footprint chart there is a high volume node with -ve delta that was traded at 0.64715.
If the sellers return to defend that price then this pullback should give some strong rejection once we pierce the entry zone and send bulls packing.
TP1 - First swing low
TP2 - Value area low of the range, which also is in confluence with the ExoFade peak on the 1HR timeframe. ExoFade peaks always gets taken out in a strong trend, that's why i love using them as price targets for exits. ExoFade is free on Tradingview for those curious about it. Just search for it.

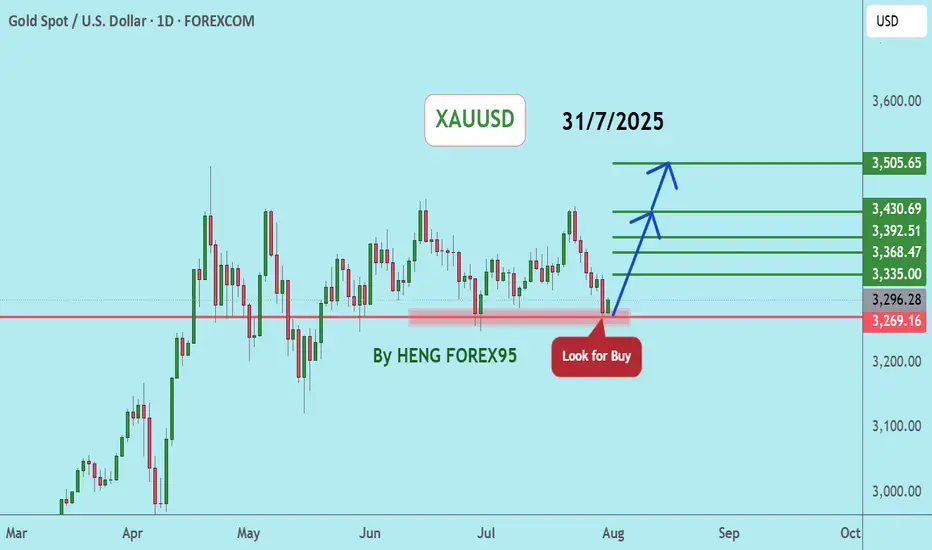
Is the gold correction over?✏️Yesterday's D1 candle closed above the Breakout 3363 zone. This shows that the buyers in the US session are still strong. There is a possibility of a liquidity sweep in the Tokyo and London sessions, then in the New York session, Gold will recover and increase again. The uptrend is really broken when Gold confirms a close below 3345. In this case, we have to wait for 3320 to confirm the BUY point. The gold uptrend at this time also needs new momentum to be able to move towards ATH 3500.
📉 Key Levels
Support: 3345-3320
Resistance: 3373-3418
Buy zone: 3345 (bullish wave structure maintained); BUY DCA break 3373
Buy zone: 3320 (Strong support zone)
Target: 3417
Leave your comments on the idea. I am happy to read your views.

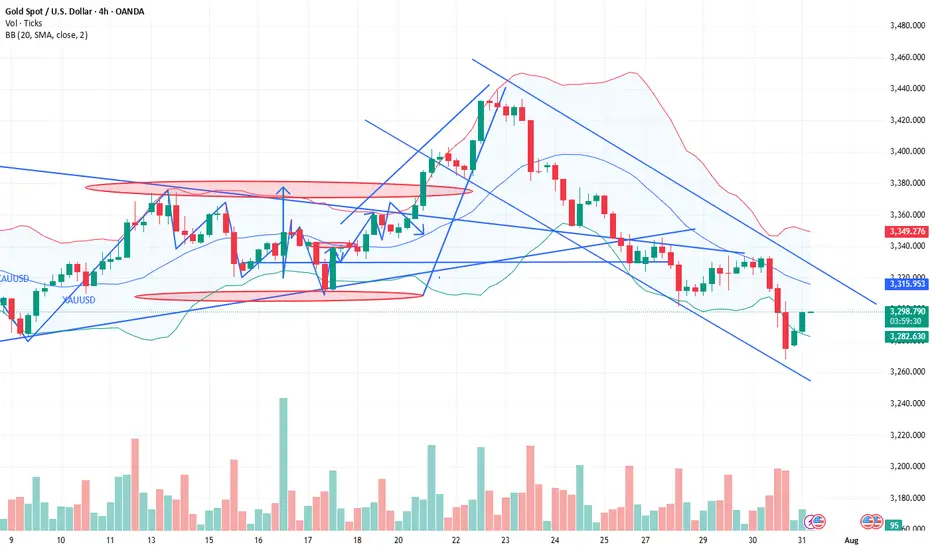
Gold breaks price channel, officially starts falling✏️ OANDA:XAUUSD price has officially broken the bullish wave structure and broken the bullish channel. A corrective downtrend has begun to form. If there is a pull back to the trendline today, it is considered a good opportunity for sell signals.
The liquidity zone 3250 is the target of this corrective downtrend. The 3283 zone also has to wait for confirmation because when the market falls and the momentum of the decline, the number of FOMO sellers will be very strong. The opposite direction is when closing back above 3375, Gold will return to the uptrend.
📉 Key Levels
SELL zone 3343-3345
Target: 3250
BUY trigger: Rejection candle 3285
Buy zone: 3251
Leave your comments on the idea. I am happy to read your views.

downtrend below 3300 , after ADP-NF⭐️GOLDEN INFORMATION:
The Federal Reserve’s policy statement noted that economic activity has slowed in the first half of the year, although the unemployment rate remains low and inflation is still “somewhat elevated.” The Fed reaffirmed its commitment to achieving maximum employment and returning inflation to its 2% target, while also acknowledging that “uncertainty around the economic outlook remains elevated.”
Earlier data showed that U.S. GDP grew in the second quarter, but underlying details painted a softer picture. Consumer spending cooled, and business investment declined significantly. According to Reuters, most economists now forecast full-year GDP growth at 1.5%, below the Fed’s 1.8% projection.
⭐️Personal comments NOVA:
Gold prices reacted negatively as the FED kept interest rates unchanged and Chairman POWELL's hawkish stance. Selling pressure below 3300 is being maintained.
⭐️SET UP GOLD PRICE:
🔥SELL GOLD zone: 3360- 3362 SL 3367
TP1: $3350
TP2: $3340
TP3: $3330
🔥BUY GOLD zone: $3249-$3247 SL $3242
TP1: $3258
TP2: $3270
TP3: $3285
⭐️Technical analysis:
Based on technical indicators EMA 34, EMA89 and support resistance areas to set up a reasonable SELL order.
⭐️NOTE:
Note: Nova wishes traders to manage their capital well
- take the number of lots that match your capital
- Takeprofit equal to 4-6% of capital account
- Stoplose equal to 2-3% of capital account
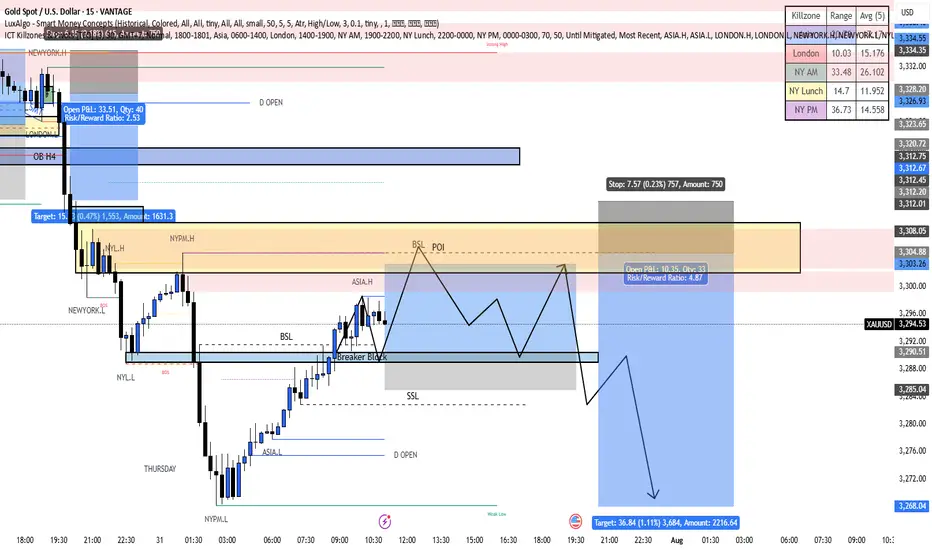
XAUUSD Thursday Chart Market Structure & Context
Timeframe: 15-Minute (M15)
Overall Trend: Bearish after a confirmed Break of Structure (BOS) to the downside
Current Price Action: In a retracement phase toward a premium supply zone
Bias: Expecting a liquidity sweep upward, followed by a strong sell-off
🧱 Key Structure Zones
NYL.H & NYL.L: High and Low of the previous New York session
ASIA.H & ASIA.L: High and Low of the Asia session
NYPM.H & NYPM.L: High and Low of the New York PM session
🔍 Critical Levels & POIs
Breaker Block (Dark Gray Box)
Formed after price swept buy-side liquidity and then broke structure upward
Expected to act as a support zone for a temporary buy or a reaction point
BSL POI (Buy-Side Liquidity - Point of Interest)
A manipulated breakout area targeted by smart money
Expected to entice FOMO buyers before a sharp reversal downward
Sell-Side Liquidity (SSL)
Located below the current breaker block
This is the final liquidity target for a continuation sell move
📈 Expected Price Behavior
Price is currently retracing upward
Projected Scenario:
Price moves up to tap into the BSL POI zone (around 3,303–3,305)
Price rejects the POI, forming a potential distribution range
Breakdown from the range initiates a sell-off
Targeting final support / liquidity sweep around 3,268.04
🎯 Trade Setup & Plan
Bias: Sell after a liquidity sweep above key highs
Entry Trigger: Upon clear rejection from the BSL POI zone
Stop Loss: Above BSL POI (~3,307–3,309)
Take Profit: 3,268.04, yielding a Risk-to-Reward Ratio ~4.67
⏰ Killzone Timing (SMC Timing Model)
NY AM Killzone (14:00–19:00 GMT+7)
→ Ideal for entries; likely where liquidity manipulation occurs
NY Lunch & PM
→ Potential for distribution phase completion and sell-off
📌 Additional Notes
Price action reveals a clean FVG (Fair Value Gap) and a completed BSL sweep
Final downside target aims for the NYPM Low, identified as a weak low
Rejection from the breaker block is crucial; confirmation via BOS/CHoCH on lower TF is preferred
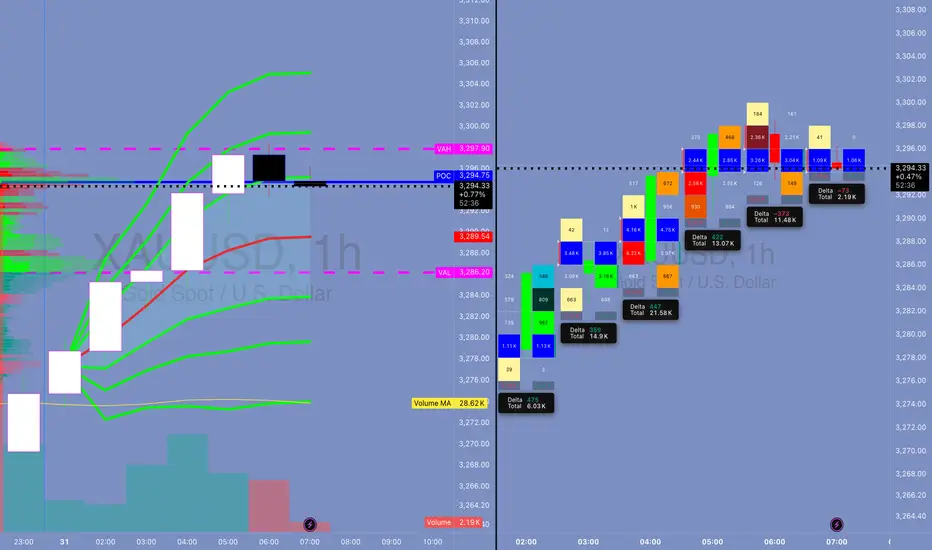
MACRO CONTEXT & NEWS FLOW IMPACT — "WHY THE HELL IT MOVED"🔥 I. MACRO CONTEXT & NEWS FLOW IMPACT — "WHY THE HELL IT MOVED"
Yesterday’s move was a classic institutional fakeout followed by controlled accumulation. Today is retest day. Watch VWAP and order flow like a hawk. Don’t chase, wait for reversion and load at value.
📅 Date: July 30, 2025
📰 Event:
US Employment Cost Index: Lower than expected
Core PCE: Cooled off
Market Implication: Fed easing is now on the table.
DXY Weakens → Real yields drop → Gold gets bought like crazy.
👊 Institutional Logic:
Rate-sensitive assets (Gold, Bonds) exploded after the release.
Algorithmic reaction to macro signal: DXY down → XAU bid hard → MegaBar explosion.
BUT institutions needed liquidity to enter big → they faked a breakdown first.
That’s institutional deception 101.
📉 II. DAILY CHART ANALYSIS — THE BIG BOYS' GAMEBOARD
🗺️ Structure:
Price dropped from 3,355 to 3,258 in 3 days — a high-velocity markdown.
On July 30, Price printed a Megabar reversal (Massive range, delta-flush, volume spike).
VAH = 3,294.90 capped upside.
POC = 3,288.91, and VAL = 3,282.90 held beautifully.
🔍 Institutional Pattern:
This is a classic “Flush > Absorb > Mark-up” sequence.
Textbook from “Technical Analysis and Stock Market Profits”:
“Volume confirms intention, range confirms commitment. A wide bar with climax volume at low implies the exhaustion of sellers and transfer of ownership.”
🔑 Key Daily Stats:
📉 Delta Flush: -584K
🔁 Reversal Delta: +70K
🔊 Volume spike: >450K (Well above 30-day volume MA)
💡 Inference:
This bar did not print because of retail buying. It’s smart money rebuying from panic sellers.
⏱️ III. 4H / 1H TIMEFRAME: ORDERFLOW & REACCUMULATION
📌 4H Chart:
📍 Megabar with -191K delta near 3,258 (Volume: 191.14K)
Immediate absorption by dark blue and green delta bars — this was not retail reversal.
VWAP reversion in play — price gravitates toward 3,294 (VWAP anchor zone)
🔁 1H Chart:
Rapid stair-stepping: Each hourly candle had higher lows and strong deltas.
Volume built from super-POC 3,289 to super-VWAP 3,295.25.
Final hour: exhaustion wick → distribution into resistance.
🧠 Institutional Tactic:
They used Volume by Price congestion to hold price between FVRP bounds:
Low Volume Nodes (LVNs) = acceleration zones
High Volume Nodes (HVNs) = consolidation + absorption zones
🔍 IV. 15M / MICROSTRUCTURE — WHERE THE GAME WAS REALLY PLAYED
🔬 VWAP Stack Analysis:
VWAP: 3,294.61
D-VWAP: 3,289.30
Super-VWAP Cluster held price in check — real institutional price magnet.
🔄 Delta Flow (15m):
Delta climbed from -3.15K → +3.21K in 1.5 hours.
Imbalance flipped bullish near POC.
🎯 FPVR Mapping (Volume Profile Right Side):
Thickest distribution volume occurred at 3,287 – 3,295
Value tightly packed = fair price.
Institutions are loading in value, not chasing.
⚙️ V. INDICATOR & MOMENTUM SIGNALS — INSTITUTIONAL CONFLUENCE ZONES
Tool Signal
VWAP Anchored VWAP tagged and respected — classic institution level
SMA50 Capped daily move (3,342) — still a long-term bearish lid
HMA5/9 Bullish crossover on 15m/1H – signals momentum alignment
Volume MA Volume climax confirms effort at lows, signaling phase change
🔩 VI. TECHNICAL SEQUENCING OF EVENTS (STEP BY STEP)
Asia Session: Tight range, price floats around VAL (3,282)
London Session: Fake breakdown to 3,258 – traps late shorts
NY Pre-News: Choppy price action within FRVP range
Macro News Drop: Megabar → -191K delta flush
Next Candle: Delta flips +21.2K → Absorption confirmed
Price Walks Up: Controlled bid to VWAP
End of Day: Distribution at VAH → price capped by VWAP band
💣 Final move = algorithmic mean reversion + VWAP auction completion
🧬 VII. ADVANCED ORDERFLOW INTERPRETATION
⚔️ MEGABAR (The Trap Setup):
Volume = 191K+
Delta = -191K (yep, full-on flush)
What happened?
→ Late shorts + stop runs + SL hunters got rekt.
→ Institutions absorbed, switched algo, and reversed.
🧱 FVRP (Fair Value Range Profile):
Defined by VAL (3,282.90) and VAH (3,294.90)
Institutions play inside this range for risk efficiency
They accumulate low and distribute high within it
🔄 Delta Rotation:
Delta Rotation = Shift from Negative Accumulation → Positive Distribution
Classic rotation confirms phase transition
🧠 VIII. INSTITUTIONAL OBJECTIVE (WHAT THEY WANTED)
Primary Goal: Create liquidity void below → Enter large long positions
Secondary Goal: Return to VWAP zone and unload
Tertiary Goal: Signal to market: "We're in control, stay out or get punished"
This is textbook Volume Profile Auction Theory in motion.
🎯 IX. HYPOTHETICAL TRADE SETUP (EDUCATIONAL PURPOSE ONLY)
🧾 Trade Plan: Institutional VWAP Reversion Play
Order Type: Buy Limit
Entry: 3,287.00
Stop Loss: 3,279.00 (below VAL & invalidation)
Take Profit: 3,300.00 (Super-VAH zone)
Confidence: 85%
R/R: 1:1.6
💡 Justification:
Entry at POC + SMA50 cluster
Stop below structural invalidation zone
Target near major supply
This is the exact playbooks funds run during reaccumulation rotations
🧠 X. EDUCATIONAL TAKEAWAY — WHAT YOU SHOULD LEARN
Volume is truth. If volume spikes at lows, it’s not weak hands — it’s smart money flipping.
VWAP is magnet. Everything mean-reverts back to VWAP in controlled auctions.
Delta tracks aggression. Sharp delta reversals = algorithm switch.
Megabar = signal. Huge candle + volume + delta = possible phase shift.
FRVP = roadmap. Price doesn’t move randomly — it moves to balance imbalances.
🔚 CONCLUSION — YESTERDAY’S LESSON
July 30, 2025 wasn’t just a bullish day — it was a textbook institutional deception-reversion cycle. If you understand:
How the news was used
How the megabar printed
How the volume clustered
How the VWAP held
… then you’re not trading blindly.
You’re trading with the damn architects of the market.
gold has reach daily supportMomentum is still bearish however selling low is not advisable.
so there are certain point of interest that we want to look for as gold currently is at the support level. a strong one

XAUUSDUpdate:
Gold Price Trend: As per our previous analysis on July 28, 2025, the price has now tested the support at 3,269. We expect that if the gold price can hold above 3,249, the gold price trend will remain bullish. We recommend considering buying in the red zone.
🔥Trading futures, forex, CFDs and stocks carries a risk of loss.
Please consider carefully whether such trading is suitable for you.
>>GooD Luck 😊
❤️ Like and subscribe to never miss a new idea!

Gold rinse and repeatSimple, more shorts on gold as it looks like a rinse and repeat from previous sessions price action
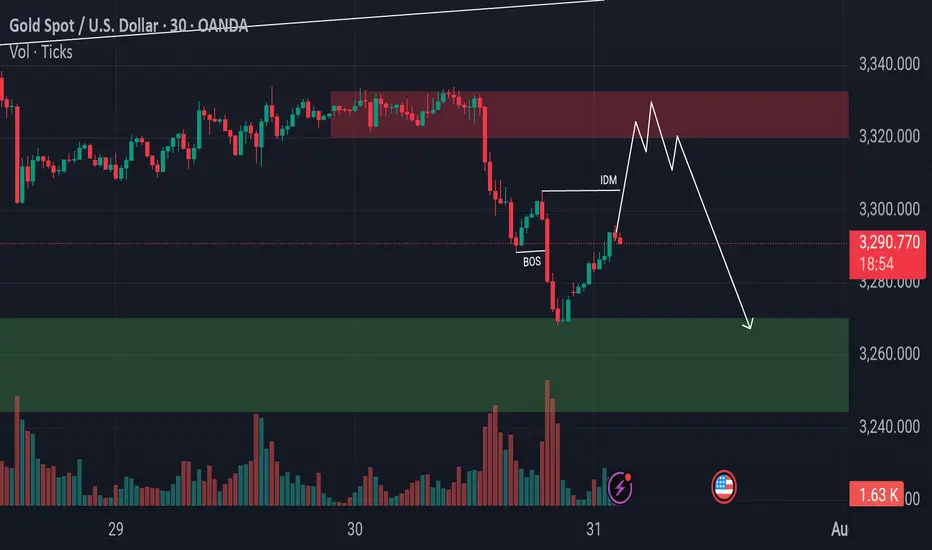
Gold Bulls Charging to 3305 But What’s Waiting There?Gold has recently taken support from the lower levels and has also shown a Break of Structure (BoS) to the downside. Currently, there is Imbalance and Internal Draw on Liquidity (IDM) resting around the 3305 level. The market appears to be moving upward to mitigate that imbalance. It's important to closely monitor this zone, as once the market reaches and fills this area, there is a high probability of a potential rejection or bearish move from that level
Gold Exhausted it Self Trying To take liquidity From The ATHFOREXCOM:XAUUSD
I'd Wait for a Retest On 3.333 For a short With That We have to confirm That the OB on 3.269 breaks With a Good 4h candle, we can Target 3.200 going From there

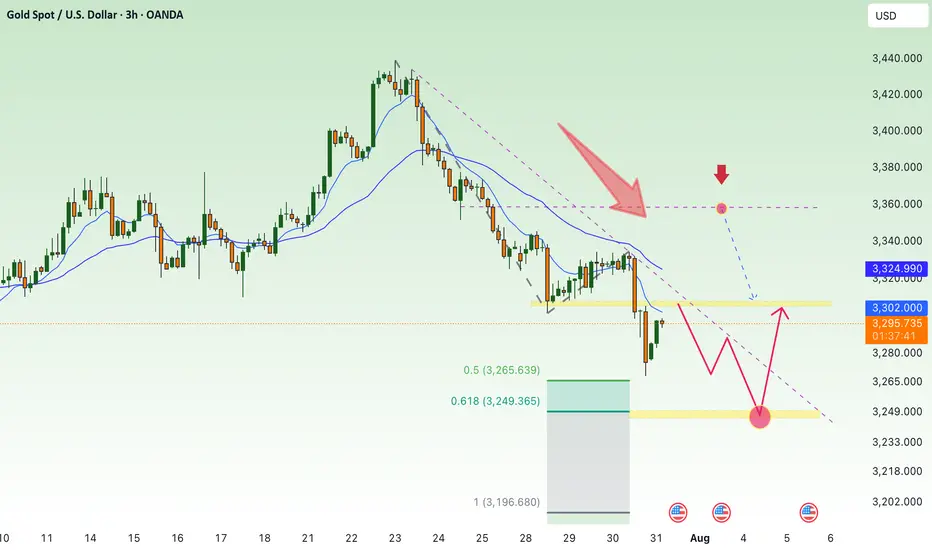
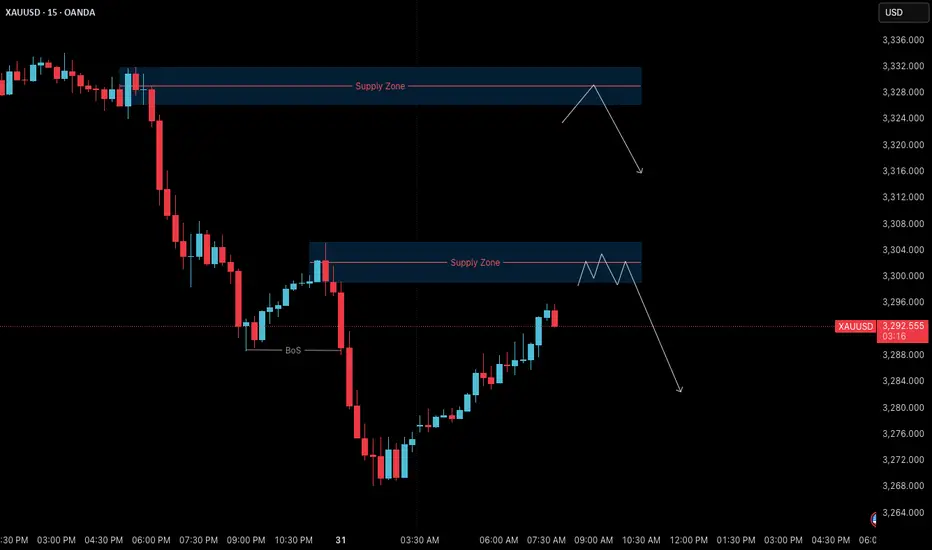
Gold 31 July – Bearish Bias Holds, Watching Supply ZonesGold (XAUUSD) Analysis – 31 July
Market structure is now aligned across both higher and lower timeframes:
H4: Bearish
M15: Bearish
This alignment strengthens the probability of trend-continuation setups in favor of the dominant downtrend.
🔄 Current Market Behavior:
The M15 chart is currently in a pullback phase, retracing toward its previous lower high and approaching a key supply zone.
📍 Key Supply Zones to Watch:
Zone 1 – Immediate Supply Zone (3299 – 3305)
• First area of interest where price may react.
• If respected and followed by M1 confirmation, a short setup could be initiated.
• Watch for signs of exhaustion or sharp rejection.
Zone 2 – Higher Supply Zone (3326 – 3332)
• If the first zone fails, this becomes the next high-probability area.
• Well-aligned with the broader bearish structure — expect stronger reaction potential.
• Suitable for cleaner high RR short trades if price reaches this level.
✅ Execution Plan:
• Observe how price behaves inside the marked zones.
• Only plan short entries after M1 confirmation — this adds precision and prevents premature entries.
• Stay patient. Let the market come to you and reveal intent before acting.
📌 Summary:
Bias: Bearish
Structure: H4 and M15 both support downside bias
Zones in Focus:
– Primary: 3299–3305
– Secondary: 3326–3332
Execution: Wait for confirmation before entering.
Risk-Reward: Maintain 1:3 RR minimum (e.g., 40 pip SL, 120 pip TP).
Let the structure guide your setups — not impulse.
📘 Shared by ChartIsMirror
XAUUSD Expecting Selling Movement After retesting the zone, sellers stepped in again confirming Rejection Selling
Price is now breaking out of the pattern to the downside, signaling potential continuation
Targets
First Target: 3300
Second Target 3275
As long as price stays below the rejection zone, bearish momentum remains valid. Watch for volume confirmation and follow price structure closely
