Technical Analysis - Gold (XAU/USD) - 4H ChartI’ve dissected the market using Elliott Wave theory and uncovered key signals that most overlook. Here's my breakdown:
## 📌 **Setup Overview*
I'm tracking a complex wave structure that hints at the final stage of a corrective pattern, setting the stage for a potential bullish rebound.
## 🎯 **Entry Strategy**
I’ve identified a prime buy zone around **3,350USD**—just above current market levels. This isn’t just a number—it's where price action and wave theory converge. High-probability setup with a tight stop. Above 3,380
## 🧭 **Projected Move**
While I’m eyeing short-term upside, the larger wave pattern suggests the potential for a deeper correction targeting the **3120.000 USD** area. I’m preparing for both scenarios to stay ahead of market sentiment.
---
Futures market

GOLD recovers after many days of declineOANDA:XAUUSD has recovered after several days of declines. Investors will focus on the Federal Reserve's interest rate decision on Wednesday, which is expected to cause significant market volatility.
Gold hit a three-week low of $3,301 an ounce on Monday, before recovering somewhat on Tuesday after falling for a fourth straight day as the dollar erased some of its earlier gains, boosting demand for the precious metal.
Falling US Treasury yields and a weak US jobs report also prompted investors to buy gold.
Data released by the U.S. Labor Department on Tuesday showed the number of jobs added fell in June after two straight months of gains.
The number of jobs added in June fell to 7.44 million from a revised 7.71 million in May. The median forecast of economists in a survey was 7.5 million.
Focus on the Federal Reserve's decision
The Federal Reserve will announce its interest rate decision at 01:00 IST on Thursday; Federal Reserve Chairman Powell will hold a press conference on monetary policy at 01:30 IST on the same day.
The market generally expects the Federal Reserve to keep interest rates unchanged, with the focus on whether Fed Chairman Powell's speech will provide any clues about the timing or pace of future rate cuts.
The market sees a very low chance of a rate cut in July and a roughly 40% chance of another rate cut in September, up from about 10% last month, according to the Chicago Mercantile Exchange's FedWatch tool. Investors will be closely watching the statement and Fed Chairman Powell's remarks at his post-meeting press conference for fresh clues on the timing of the next rate cut.
- If Powell opens the door to a rate cut in September, citing the recent trade deal as a reason to ease uncertainty, US Treasury yields could fall immediately, paving the way for gold prices to rise.
- On the other hand, if Powell avoids committing to a rate cut at this meeting, citing recent rising inflation data, gold prices could fall.
Gold typically performs well in low-interest-rate environments because it does not pay interest and its appeal increases when returns from other assets decline.
Technical Outlook Analysis OANDA:XAUUSD
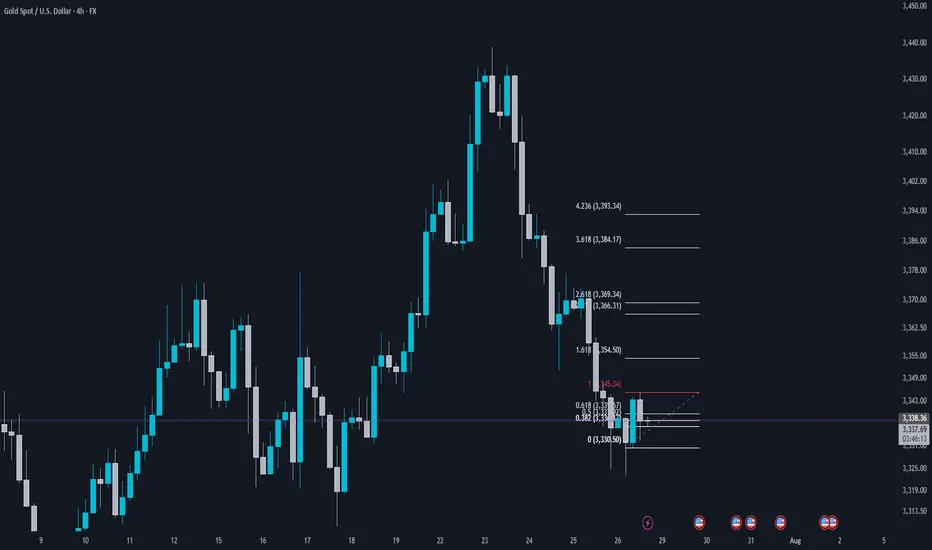
Gold has recovered from the key $3,300 price point and is holding above $3,310, which is also the nearest support. However, the current recovery is not technically enough to create a short-term uptrend, or conditions for a sustained price increase. In terms of position, gold is under pressure with the 21-day EMA as the nearest resistance at around $3,340 – $3,350. If gold falls below the 0.382% Fibonacci retracement level, it will be eligible to open a new downtrend with a target of around $3,246 in the short term, more than the 0.50% Fibonacci retracement level.
On the other hand, RSI is below 50, and the current 50 level acts as momentum resistance in the short term. If RSI slopes down, it will signal bearish momentum with more downside ahead. For gold to qualify for bullish expectations, it needs to at least push price action above EMA21, then retrace back to the price channels and finally break above the 0.236% Fibonacci retracement level to confirm bullish conditions. The upside target could be towards $3,400 in the short term, more like $3,430 – $3,450.
For the day, the technical outlook for gold prices tends to lean more towards the downside, with the following notable points listed.
Support: 3,310 – 3,300 – 3,292 USD
Resistance: 3,340 – 3,350 – 3,371 USD
SELL XAUUSD PRICE 3376 - 3374⚡️
↠↠ Stop Loss 3380
→Take Profit 1 3368
↨
→Take Profit 2 3362
BUY XAUUSD PRICE 3280 - 3282⚡️
↠↠ Stop Loss 3276
→Take Profit 1 3288
↨
→Take Profit 2 3294
Gold's Strong Moves: Will the Bears Take Over?Hello everyone, Kevinn here!
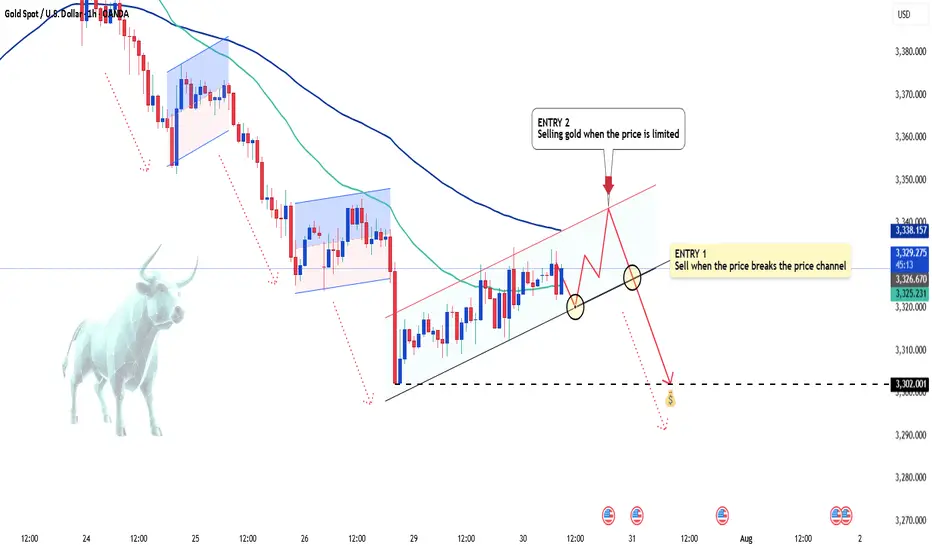
Today, gold continues to experience significant fluctuations in the new week, with XAU/USD currently hovering around 3,325 USD. Amid the strong rise of the USD, the gold market has seen a sharp adjustment. However, the medium-term trend still seems to favor the bears.
The main reason for the turbulence in gold prices is the strengthening of the U.S. dollar, following strong economic news from the U.S. that points to a clear recovery. The stronger USD has made gold more expensive for international investors. Additionally, the market is awaiting further moves from the Fed regarding interest rate policies, which is limiting the flow of capital into gold.
Looking at the technical chart, we can see that although gold has shown a slight uptick, bearish pressures are still lurking. Indicators and patterns suggest that gold may break its rising price channel, with a high likelihood of further declines. The next support level could be around 3,310 USD, and if broken, gold may continue to fall toward 3,300 USD or lower.
Based on the signals from the chart, ENTRY 1 strategy would be to sell when the price breaks the upward channel. Additionally, if the price pulls back to the upper limit zone, ENTRY 2 could present another potential selling point.
For today's strategy, I expect gold to decrease. What do you think? Share your thoughts in the comments!
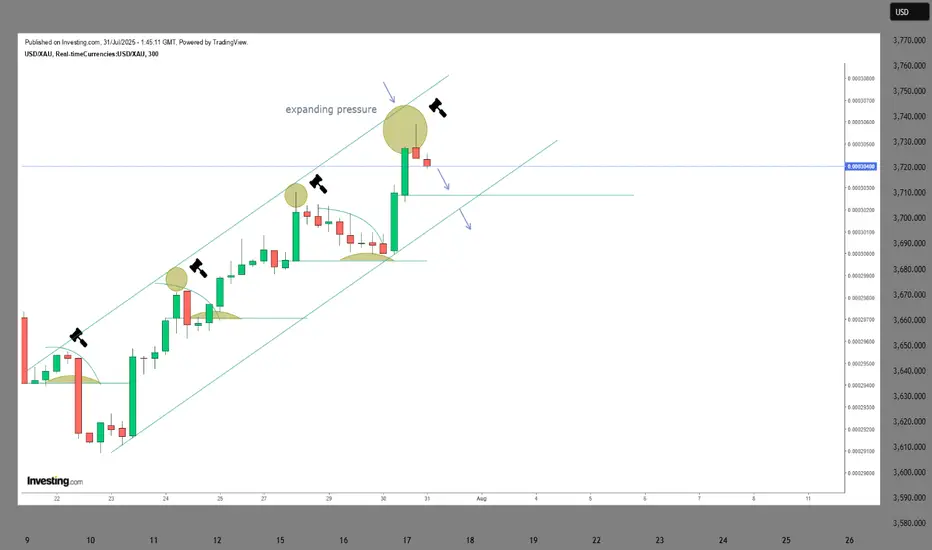
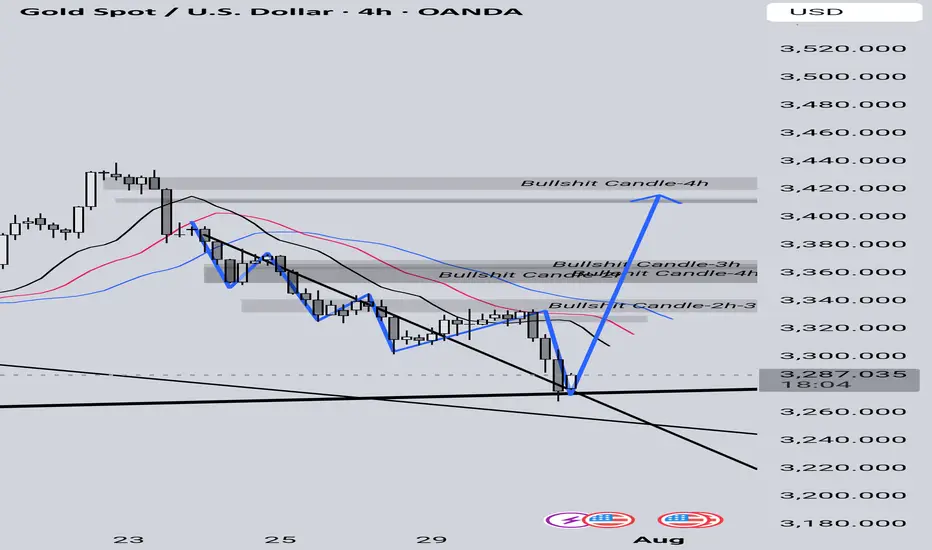
GOLD prep work to ATH retap has started. seed at 3270!First thing first.
Diagram above is in reverse metrics (USDXAU)
--------
GOLD, has been met with some well deserved respite on price growth after a series of parabolic highs this past few weeks. And this healthy trims are warranted in the grand scheme of things -- to sustain its upward trajectory. A price rest is definitely welcomed.
Now based on our latest daily metrics, gold is showing some low key hints of shift -- it may not be visible to 99% of traders -- but it is there now to magnify.
Diagram above is in reverse metrics (USDXAU). It is currently showing some pressure expansion for bears and hinting of prep work to reverse.
This is a precursor of a massive structure change-- for that elusive upside continuation.
On the daily metrics, we got some hop signals here as well from -- first one in a while. Price baselines detaching itself from the descending trend line. There maybe something here now. A good zone to seed on the most discounted bargain levels -- with safety.
Spotted at 3260.
Interim mid target: ATH at 3500
Long term. 4k++
Trade safely.
TAYOR.
Gold Bounces From Support — Reversal Starting?Gold just wicked into support and is showing early signs of a reversal.
📌 Stoch RSI curling up from oversold
📌 Price bounced clean from the demand zone
⏱️ Timeframe: 1H
#gold #xauusd #tradingstrategy #quanttradingpro #stochrsi #tradingview #supportresistance

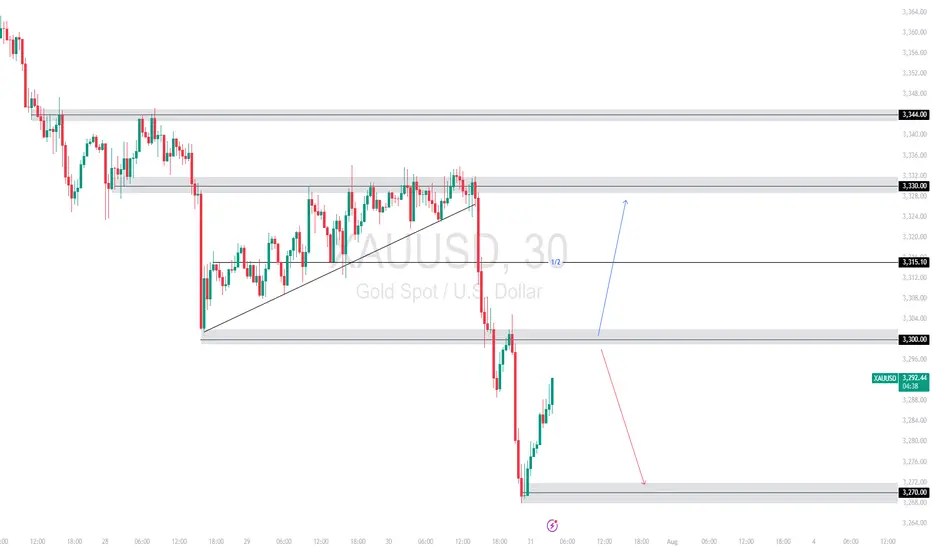
SHORT-TERM TECHNICAL ANALYSIS FOR GOLDXAUUSD broke down sharply from the 3,330 🔽 resistance zone, violating trendline support and slicing through 3,300 🔽. Price has now found temporary support at 3,270 🔽 and is attempting a retracement.
Support Levels: 3,270 🔽
Resistance Levels: 3,300 🔼, 3,315 🔼, 3,330 🔼
Bias:
🔼 Bullish: If price breaks and retests above 3,300, a push toward 3,315 or even 3,330 is possible.
🔽 Bearish: Failure to reclaim 3,300 could lead to continued downside toward 3,270 or even lower.
📛 Disclaimer: This is not financial advice. Trade at your own risk.
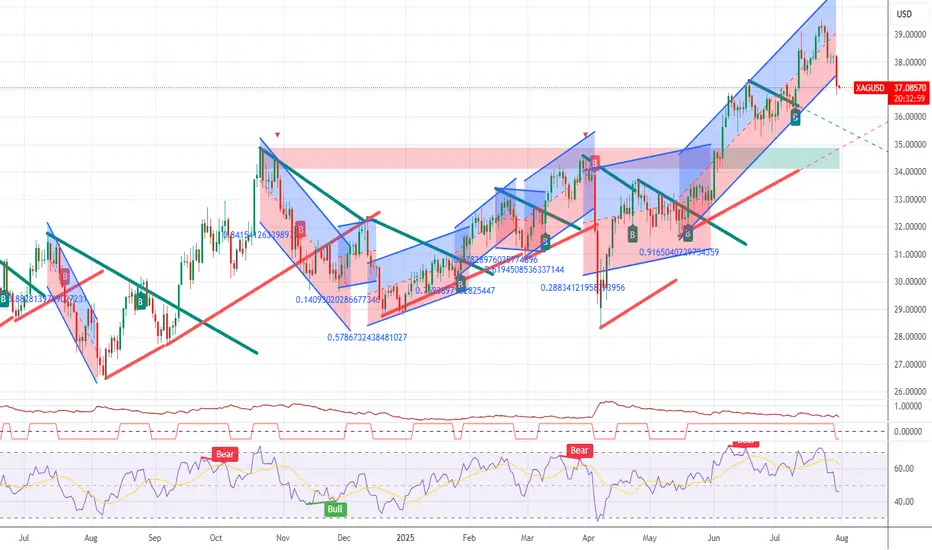
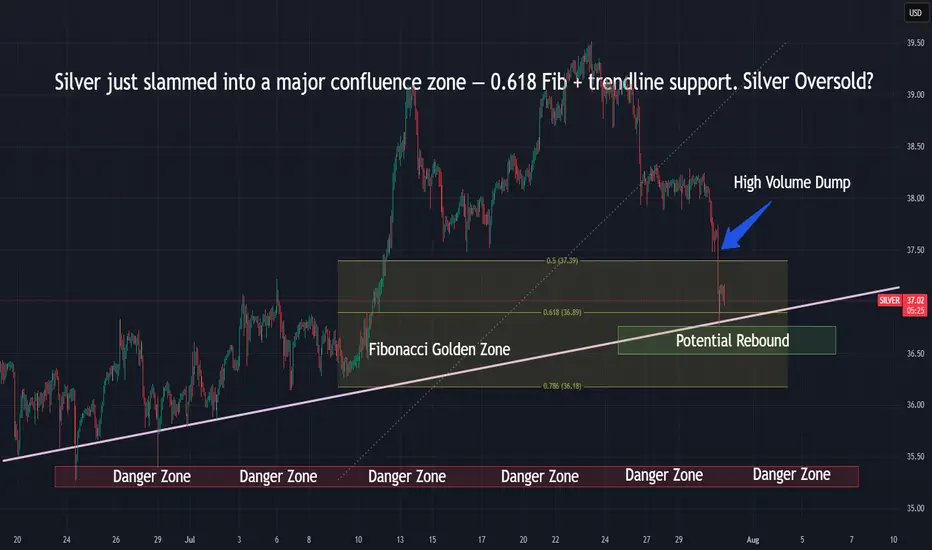
Silver Hits Fibonacci Support — Rebound or Dump?Silver just slammed into the 0.618 Fib — a key reversal zone.
📌 Eyes on bounce or breakdown toward the danger zone below $36
⏱️ Timeframe: 1H
#silver #xagusd #fibonacci #commodities #tradingstrategy #tradingview #quanttradingpro
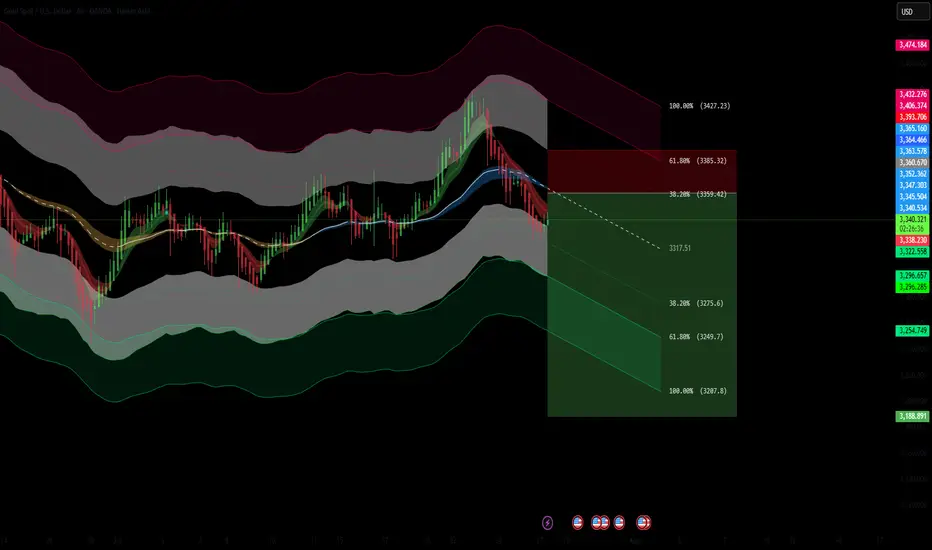
XAUUSD – 4H Short Setup AnalysisGold (XAUUSD) has broken below the dynamic support zone of the Keltner Channel structure and is currently trading beneath the 200 EMA zone, signaling bearish momentum. Price has rejected the upper resistance band near 3385, forming a lower high and triggering a short entry at the 38.2% Fibonacci retracement zone.
📉 Trade Idea (Short Bias)
Entry: Around 3360
TP1: 3317 (key support zone)
TP2: 3275 (38.2% Fib ext)
TP3: 3208 (100% extension target)
SL: 3385 (61.8% Fib retracement)
Confluences:
Price rejection from upper channel
200 EMA trend resistance
Clean bearish structure with momentum confirmation
Fib confluence adds precision to entry and target levels
If momentum sustains below 3360, further downside is likely toward the 3200 zone.
Sell at 3280 to 3240 buy at 3240 to 3400Gold is in a strong sell-off due to the volumes offered so that the strongest party, China, can buy from the maximum can bring them profits, which is the maximum point at June 30.
Gold’s Next Move: Bounce or Breakdown?Gold is pulling back after breaking the 3,360 USD resistance on the 6-hour chart. Price is currently testing the nearest fair value gap (3,370–3,380), but upside momentum is stalling, partly due to unfilled supply zones above.
A retest of the lower FVG near 3,340 will be key. Holding above this level could trigger renewed buying, while a break below may invalidate the bullish structure.
Traders should closely monitor whether downside gaps continue to fill and how price behaves near support zones. Lack of strong liquidity could lead to a false breakout.

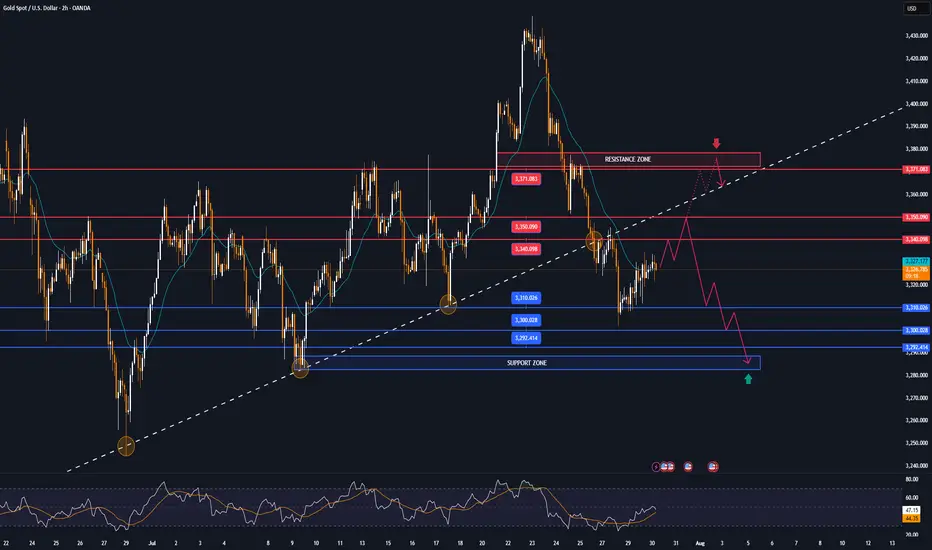
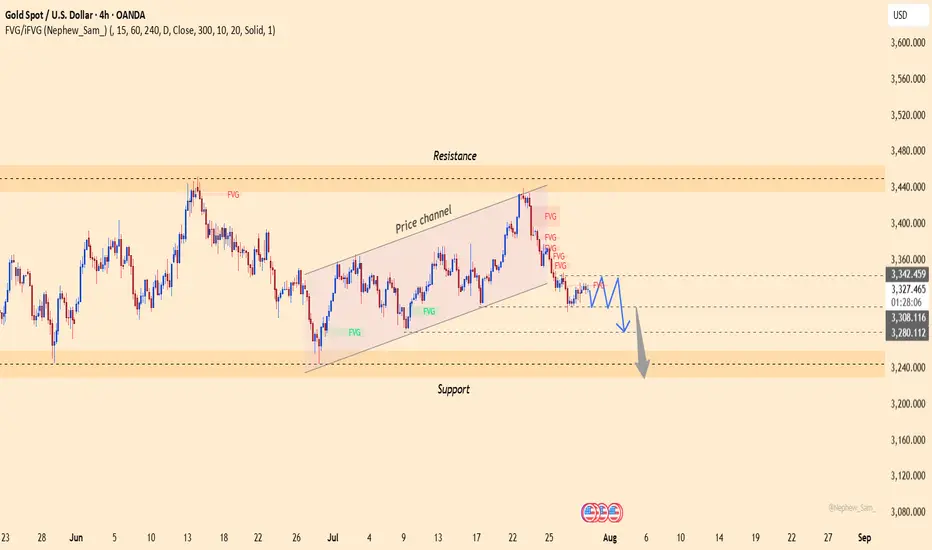
XAUUSD – Downtrend Continues as USD StrengthensGold remains under significant pressure as the U.S. dollar continues to gain strength following a series of positive economic data from the U.S. Specifically, GDP grew by 2.5%, beating expectations, while ADP Non-Farm Employment data also came in strong. This suggests the U.S. economy remains resilient, supporting the Fed's hawkish stance and keeping the dollar strong.
On the 4H chart, XAUUSD has broken below the previous ascending price channel and is now trading under the 3,340.400 resistance zone – an area packed with unfilled FVGs. The current price structure leans bearish, with any rebounds likely to be temporary pullbacks.
If USD strength continues, gold could drop further toward the support zone at 3,279.200 or even lower near 3,240.
Trading Strategy: Focus on SELL
Entry: Around 3,325 – 3,340.400 upon price rejection signals.
Target: 3,279.200 or lower.
Stop-loss: Above 3,342.459
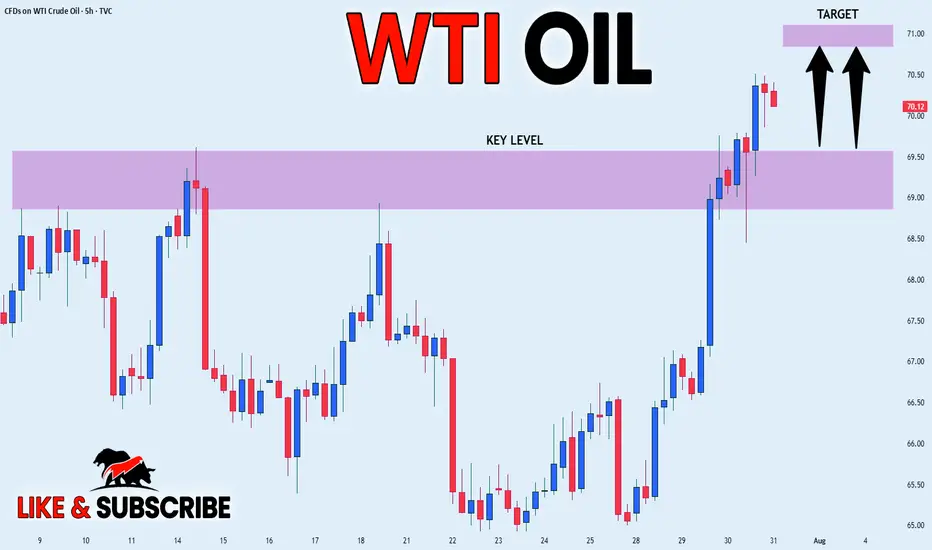
USOIL GROWTH AHEAD|
✅CRUDE OIL broke the key
Structure level of 69.50$
While trading in an local uptrend
Which makes me bullish biased
And I think that after the retest of the broken level is complete
A rebound and bullish continuation will follow
LONG🚀
✅Like and subscribe to never miss a new idea!✅
Disclosure: I am part of Trade Nation's Influencer program and receive a monthly fee for using their TradingView charts in my analysis.
XAUUSD Long SetupXAUUSD has shown good sign on the zone and possible movement has been shown in the analysis. Consider it take the setup with keeping your risk management in consideration.
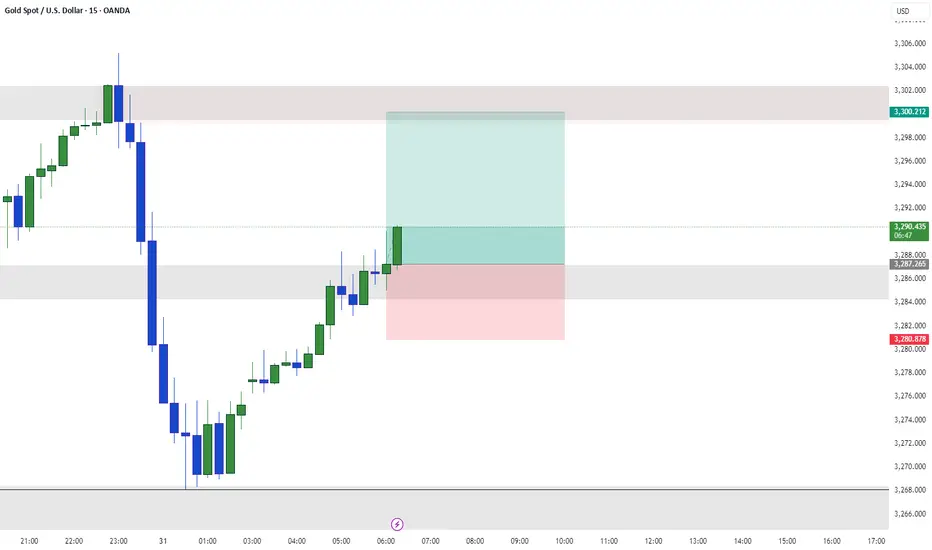
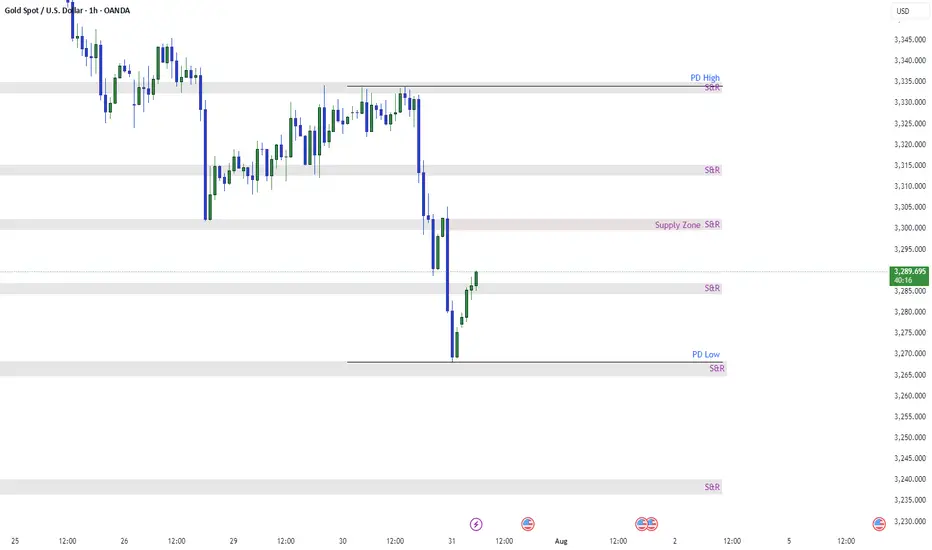
XAUUSD 1H AnalysisGold experienced a strong selloff, breaking multiple key S&R levels and forming a clear bearish structure. Currently, price is reacting from the PD Low + 1H demand zone (~3265) and pulling back.
🔍 Key Zones:
PD High – 3335: Major resistance / Supply
Supply Zone – 3295–3305: Key area to watch for bearish reaction
Current Resistance – 3285: Price testing this minor S&R level now
PD Low – 3265: Strong bullish reaction zone
📌 Potential Setups:
Sell Setup: If price enters 3295–3305 (Supply Zone) and forms rejection on 15M/1H → short toward 3265.
Buy Setup: If price breaks and holds above 3305, look for retest and continuation toward 3335.
Scalp Long: Small pullback toward 3275–3270 could offer intraday long up to 3295–3300.
📈 Bias: Still bearish unless price reclaims and sustains above 3305.
Patience is key — let price come to zone and wait for confirmation.
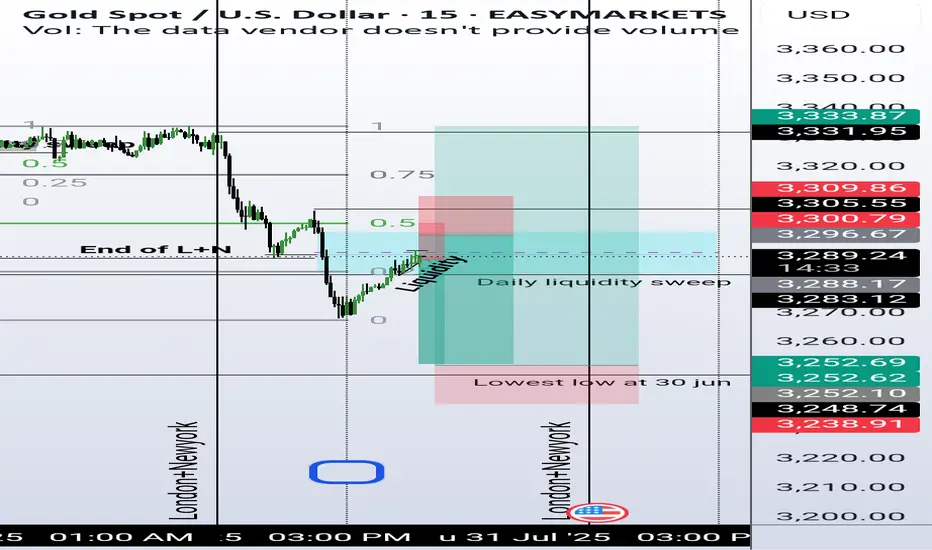
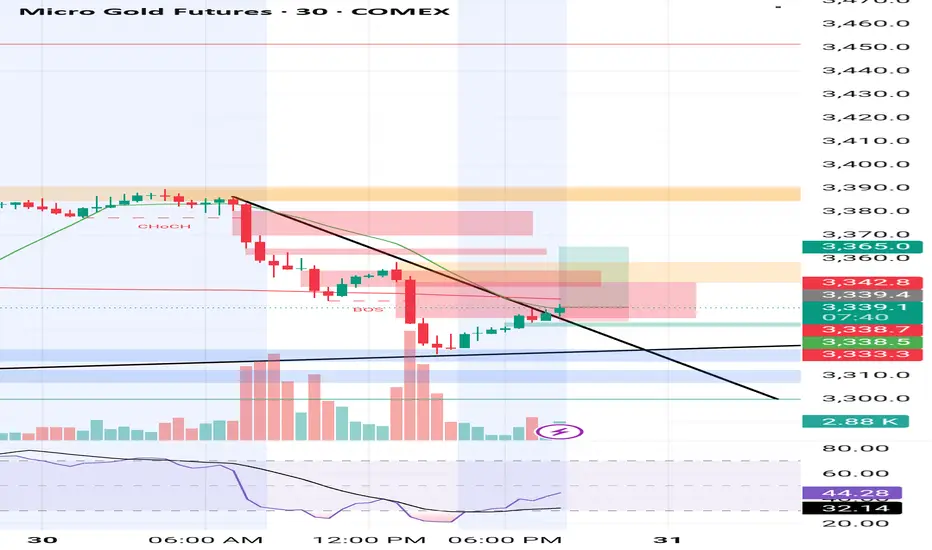
Daily Analysis- XAUUSD (Thursday, 31st July 2025)Bias: Bearish
USD News(Red Folder):
-Average Hourly Earnings m/m
-Non-Farm Employment Change
-Unemployment Rate
-ISM Manufacturing PMI
Notes:
- No rate cut imposed, no decision made on September rate cut
- Looking for continuation to the downside
- Potential SELL if there's
confirmation on lower timeframe
- Pivot point: 3310
Disclaimer:
This analysis is from a personal point of view, always conduct on your own research before making any trading decisions as the analysis do not guarantee complete accuracy.
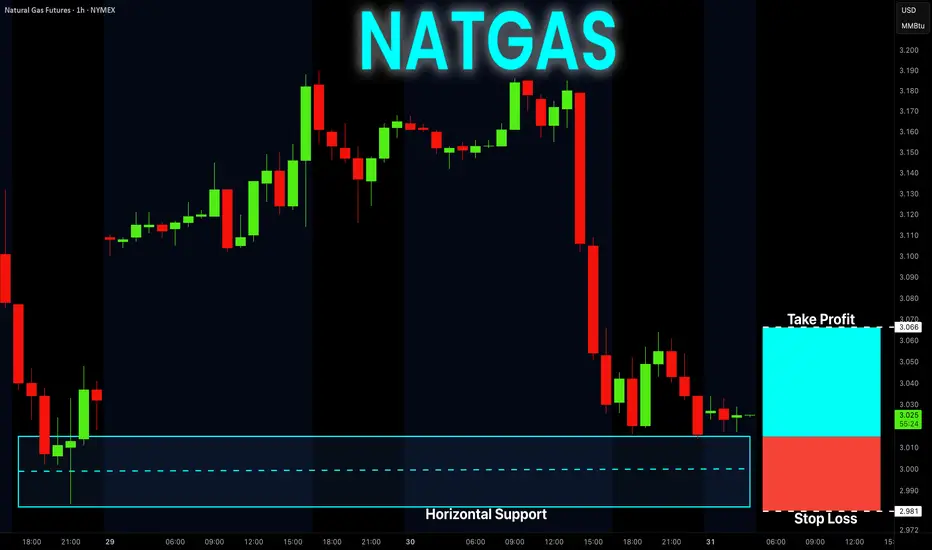
NATGAS Free Signal! Buy!
Hello,Traders!
NATGAS went down and
Almost reached the horizontal
Support of 3.014$ from where
We can enter a long trade
With the Take Profit of 3.066$
And the Stop Loss of 2.981$
Buy!
Comment and subscribe to help us grow!
Check out other forecasts below too!
Disclosure: I am part of Trade Nation's Influencer program and receive a monthly fee for using their TradingView charts in my analysis.

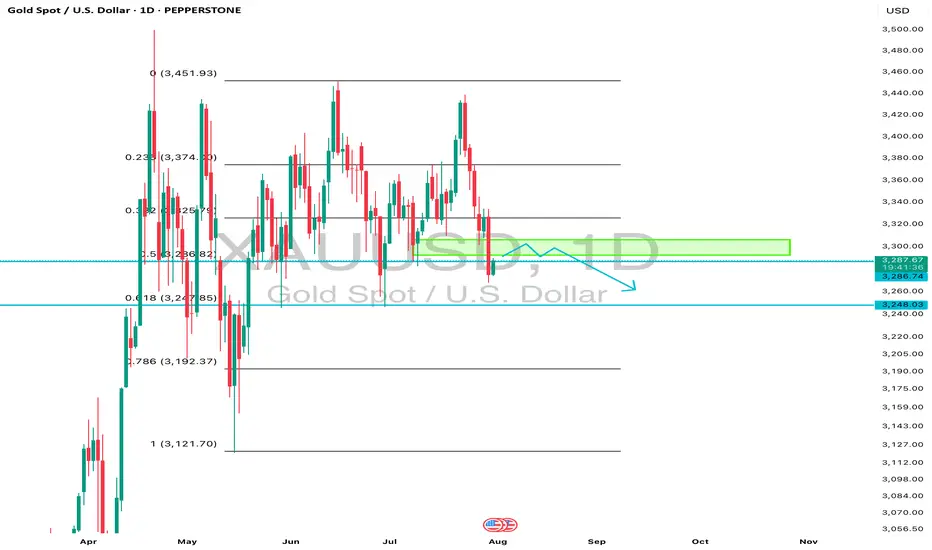
Gold Price Outlook: A Deeper Correction Ahead?Hello everyone! What are your thoughts on the current gold market?
Gold's decline is picking up speed, with the price now testing the 3,320 USD level. A stronger U.S. dollar, coupled with recent developments in the U.S.-EU trade agreement, has significantly reduced demand for gold as a safe-haven asset.
From a technical perspective, the break below the rising price channel is a key signal. It could mark the beginning of a deeper correction, as oscillators are starting to show negative momentum, indicating that the path of least resistance is now downward.
Looking ahead, all eyes will be on Wednesday’s FOMC decision. The market will be watching closely for any signs of a rate cut roadmap from the Federal Reserve, especially during Powell’s press conference. Additionally, several important U.S. macroeconomic data releases this week could provide new momentum for the USD and play a crucial role in shaping gold's next move.
What are your thoughts on where gold is heading? Let us know in the comments below!

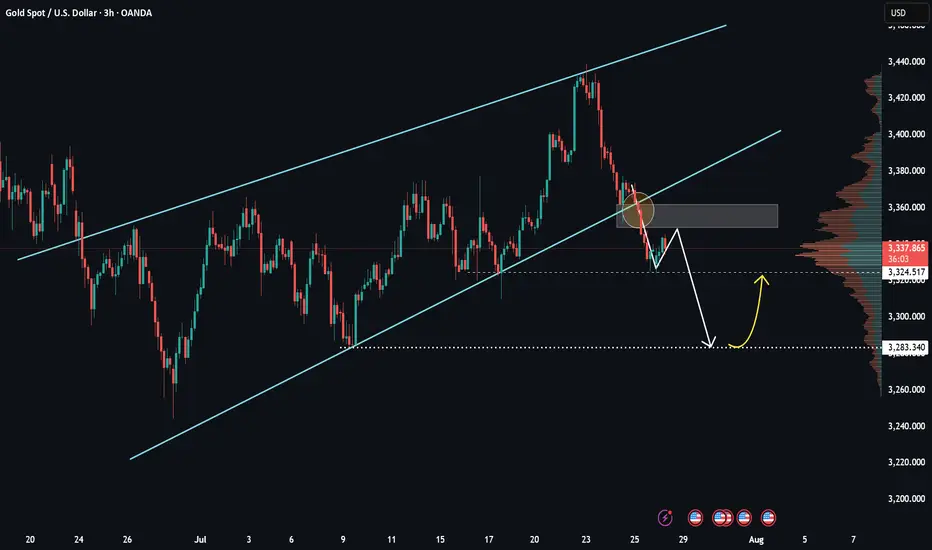
XAUUSD – Weak recovery, selling pressure still dominatesHello everyone! What do you think – is it time to buy or sell gold?
After clearly breaking the ascending trendline late last week, gold made a slight rebound from the 3,325 zone. However, in my view, this bounce was relatively weak and mostly technical in nature.
Currently, price is retesting a key confluence area around 3,345–3,355, which includes the previous trendline and a nearby resistance zone.
If we see a clear rejection candle form at this level, there's a high chance the price may reverse and continue its downward trend. The short-term target I’m watching is 3,300 USD – and if that level doesn’t hold, we could see stronger reactions near 3,283.
According to the VRVP indicator, volume is concentrated around lower price levels, suggesting that liquidity is still sitting near previous lows. Structurally, the market continues to form lower highs and lower lows, and with the EMA sloping downward, my primary bias remains to SELL on rallies within the trend.
XAUUSD long day trade idea hello
day trading idea long up to 3372-3383 price zone
fibonaci levels , maybe 3390
Gold Buy I think gold is still a buy . It formed tripple bottom and retest has been done... time to fly ATH
Silver ShortSI1! is now net short on the regression break.
Gold has not followed at this time.
I am not taking this trade directly.