Gold Buy I think gold is still a buy . It formed tripple bottom and retest has been done... time to fly ATH
Futures market
Silver ShortSI1! is now net short on the regression break.
Gold has not followed at this time.
I am not taking this trade directly.
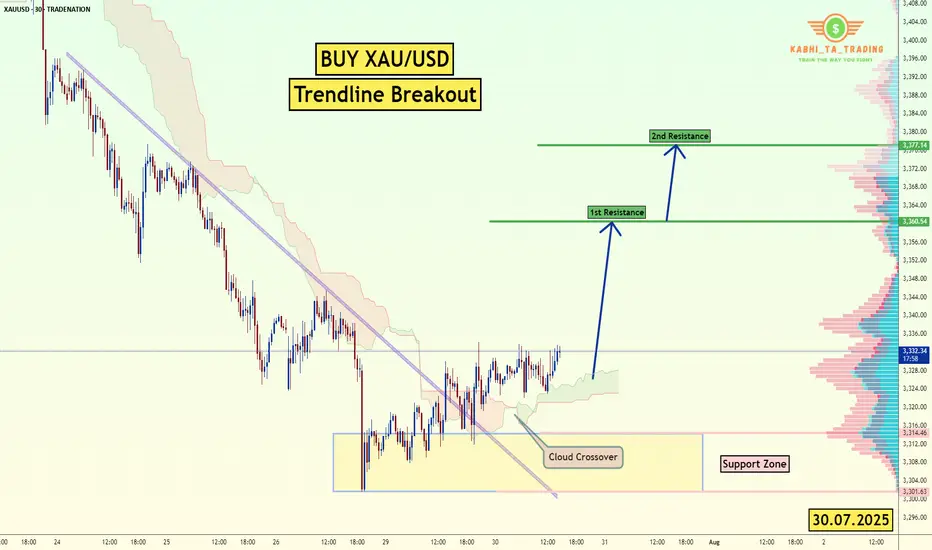
XAU/USD Trendline Breakout (30.07.2025)The XAU/USD pair on the M30 timeframe presents a Potential Buying Opportunity due to a recent Formation of a Trendline Breakout Pattern. This suggests a shift in momentum towards the upside and a higher likelihood of further advances in the coming hours.
Possible Long Trade:
Entry: Consider Entering A Long Position around Trendline Of The Pattern.
Target Levels:
1st Resistance – 3360
2nd Resistance – 3377
🎁 Please hit the like button and
🎁 Leave a comment to support for My Post !
Your likes and comments are incredibly motivating and will encourage me to share more analysis with you.
Best Regards, KABHI_TA_TRADING
Thank you.
Disclosure: I am part of Trade Nation's Influencer program and receive a monthly fee for using their TradingView charts in my analysis.
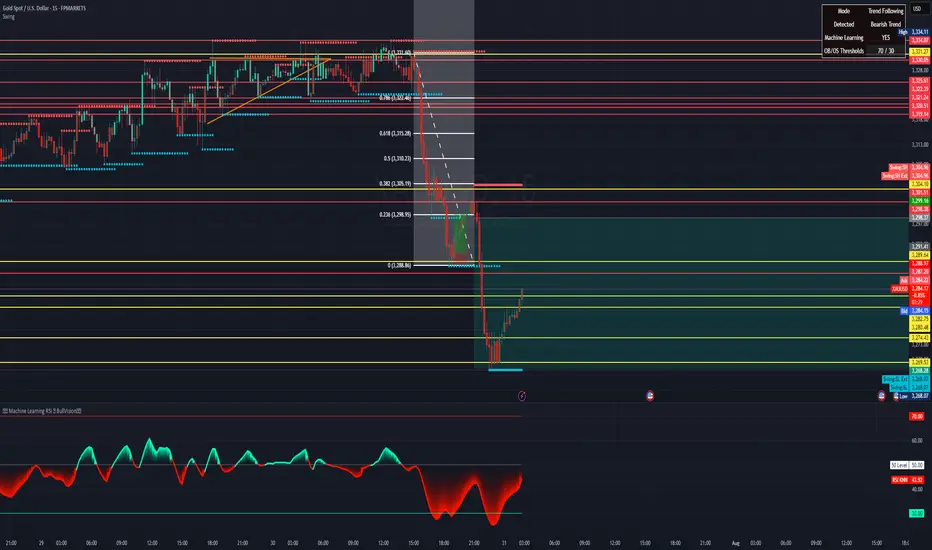
July 31, 2025 - XAUUSD GOLD Analysis and Potential OpportunitySummary:
The Fed held interest rates unchanged, and Powell’s remarks reduced the likelihood of a rate cut in September — this is fundamentally bearish for gold. Until new fundamental developments emerge, the strategy remains: sell on rallies into resistance.
After reviewing the 4H chart, I see two possible scenarios:
Price continues down to 3245, pulls back to 3283, then resumes the drop toward 3245 or even lower.
Price pulls back immediately toward 3300, then resumes the downtrend toward 3245.
These are ideal cases — I will still wait for clear confirmation before taking action.
🔍 Key Levels to Watch:
• 3323 – Resistance
• 3309 – Resistance
• 3300 – Psychological level
• 3283 – Key resistance
• 3268 – Short-term support
• 3260 – Support
• 3245 – Major support
• 3233 – Support
📈 Intraday Strategy:
• SELL if price breaks below 3268 → target 3265, then 3260, 3255, 3250
• BUY if price holds above 3283 → target 3289, then 3295, 3300, 3305
👉 If you find this helpful or traded using this plan, a like would mean a lot and keep me motivated. Thanks for the support!
Disclaimer: This is my personal view, not financial advice. Always use proper risk control.

As Always GOLD Dumped During New York Session!We anticipated GOLD to dump and look for entries in AoO (Area Of Opportunity). But, I got stopped out before the dump happened. So far so good with the dump.
Why I didn't take another entry?
It comes down to my trading plan, price dumped out of my entry time range 8 am - 5 am New York local time.

Will Gold Dump New York Session?As you can tell from the chart, I am waiting for price action to break below its latest swing low (bearish FVA).If it does so, then I will be looking for my entries within the Area of Opportunity (AoO). Targeting the nearest swing low.

WE GOT THE SWEEP ON GOLD!!!!THIS is the move I was waiting for! we got the full sweep on levels. looking for price to flip back to bullish pressure from here. Now we just wait for the entry to show as we move into the Asian Killzone.

SMC ✅ Strengths:
• Previous mitigation of institutional interest zones (1H FVG).
• BOS (Break of Structure) indicating bullish intent.
• Entry located at the 5M OB, which coincides with support and fake out (consistent with liquidity re-entry).
• TP is aligned with the previous resistance and distribution zone, which provides a good RR (2.23).
Good luck Traders

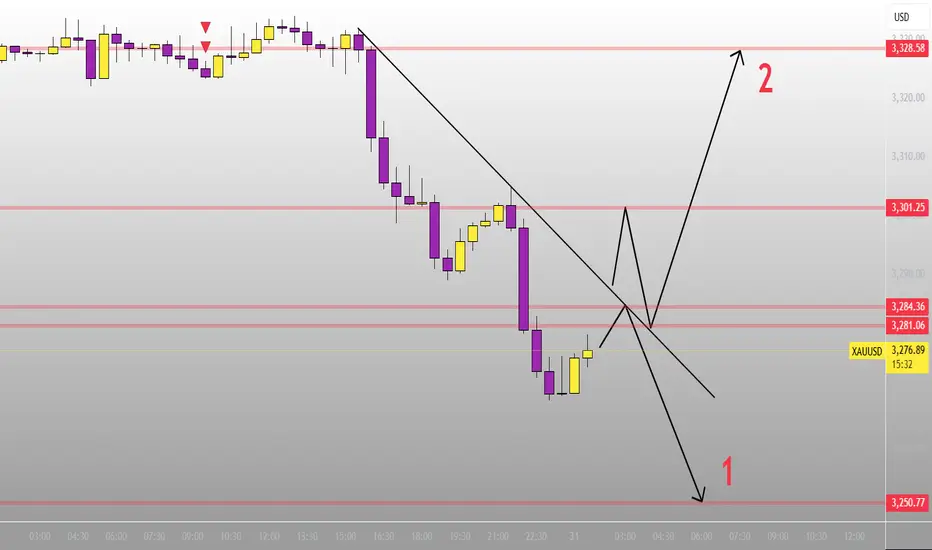
XAUUSD Update CONSOLIDATIONAfter bullish rejection, Gold make a new lower and break 3283 support level.
Now it seemslike bounce to make a correction and retest 3305 resistance.
If 3305 reject, price will continue moving downside and retest 3245 support.
If it break 3245...it will continue to find it support, near 3205 support zone.
Have a blessing day !

Potentially more volatilityThe daily chart in the S&P 500 implies the possibility of additional volatility as more fundamental news is revealed on Thursday and Friday. The bias currently is for continuation to the upside.

Gold Intraday Trading Plan 7/31/2025Gold behaved as expected yesterday. It broke the channel and fell heavily, breaking both 3300 and 3280 supports. The bearish momentum is very strong right now.
I am looking for selling opportunity from 3300 and target 3255, which is my weekly target.

XAUUSD
XAUUSD Updated in 30M :
After the big drop in gold, two scenarios can be predicted for this precious metal.
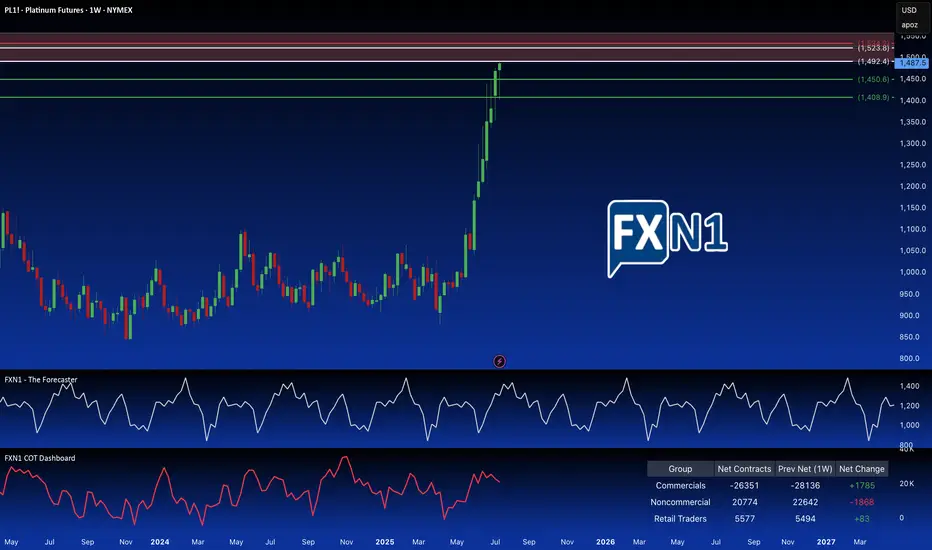
Platinum: Breaking the Supply Barrier?I'm adding a second Platinum position. Price has hit a strong weekly supply area, also a significant monthly supply zone. I'm anticipating a reversal here, as non-commercial holdings are decreasing, and seasonal patterns suggest a potential trend change. To further capitalize on potential upside, I've placed a pending order above the primary supply zone, at a slightly higher, but still relevant. These are older, established and fresh supply zones.
(Note: Reducing the chart size may help to better visualize the long-term significance of these overlapping areas.)
✅ Please share your thoughts about PL1! in the comments section below and HIT LIKE if you appreciate my analysis. Don't forget to FOLLOW ME; you will help us a lot with this small contribution.
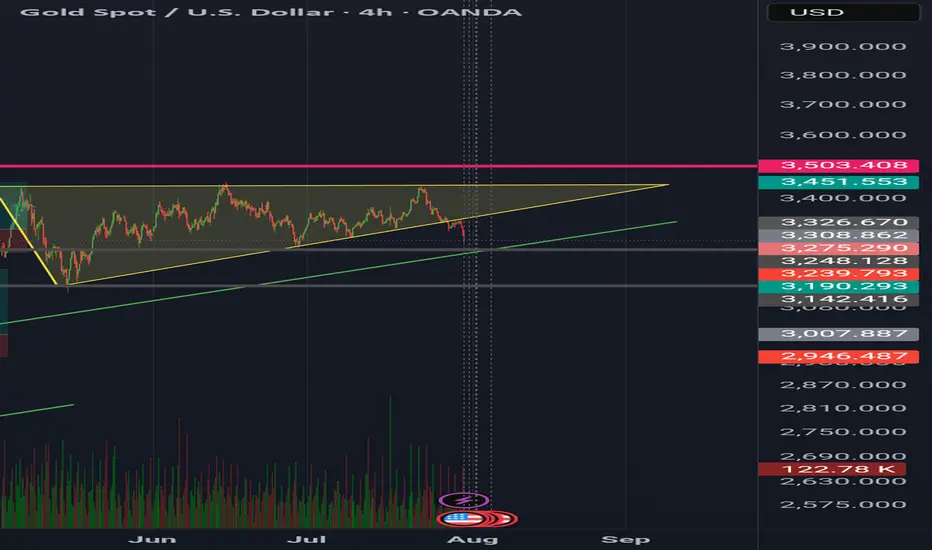
Gold Wave Analysis – 30 July 2025- Gold falling inside wave b
- Likely fall to support level 3250.00
Gold is under bearish pressure after the price broke the two upward-sloping support trendlines from May and February.
The breakout of these support trendlines accelerated the active short-term correction b – which belongs to the impulse wave 3 from June.
Gold can be expected to fall further to the next round support level 3250.00 (former low of waves 2 and (b) from May and June).
MGC Bear Flag or Dead Cat Bounce? Tokyo’s About to DecideClean structure forming on MGC after a heavy impulse sell during NY session. We’re now consolidating below VWAP in what looks like a textbook bear flag or descending wedge.
We had a sharp breakdown from the highs with no real attempt to reclaim the structure. Price is now compressing underneath the 9/21 EMAs and VWAP clear bear pressure. Volume POC from this range is sitting around 3,332.7, and price can’t even sniff it. Fibonacci 50% retrace off the sell leg aligns with POC stacked resistance.
Entry marked at 3,318.4, targeting a breakdown into 3,268.4 roughly the measured move from the flag.
Quant Confluence:
- Under VWAP
- Below 9 & 21 EMA
- Fib 50% rejection
- Bear flag structure
- POC rejection zone
If I'm Wrong:
If price closes above 3,332.7 (POC) or breaks and holds above VWAP, the bear thesis weakens significantly. Flip long only on a full structure reclaim.

GoldXau usd daily analysis
Time frame 4 hours
Maybe Earthquake in the east of Russia 🇷🇺 makes a revolution in the markets .
I never open a short or long position in this times.
I'm waiting and watching the markets.
I think the grey lines are the reverse point
So I must wait now
XAUDUSD SELL LIMITSymbol: XAU/USD
Timeframe: 15 Minutes (15m)
Trade Direction: Short (Sell)
Exact Entry Price:
3,295.254
Entry Rationale: This point is located within the FVG (Fair Value Gap) and at the 78.0% Fibonacci level (Optimal Trade Entry - OTE zone), which has a high potential for a price reaction and attracting sell orders.
Exact Stop Loss:
3,305.953
Stop Loss Rationale: This price is set slightly above the high of the bearish Order Block and also above the Swing High at 3,302.658 to protect the trade from a potential liquidity grab (Stop Hunt).
Exact Take Profit (TP1):
3,270.916
Take Profit Rationale: This target is set at the recent low. This area acts as a sell-side liquidity pool and is the next logical target for the price after pulling back to the supply zone.

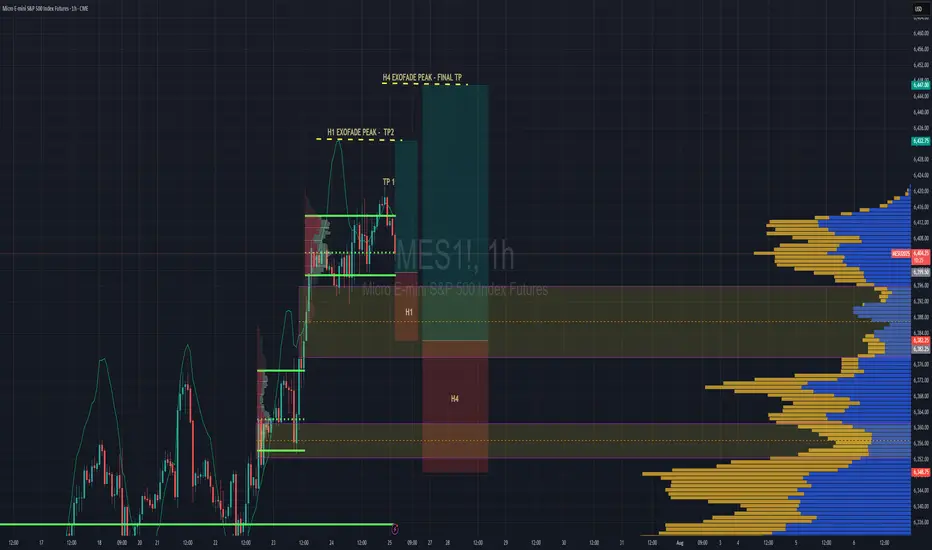
S&P 500 Intraday & Swing Entries H1 entry is close to getting activated for intraday.
If you want a swing trade then wait for H4 entry (you might be waiting a while obviously)
Reason for entries - We have broken out of Balance since July 25th and currently in a trend phase until we establish a new value area, or return to the one we broke out from.
So since Trend and Momentum is UP, then we should find Low Volume Areas to enter in the direction of the trend for a classic pullback entry trade.
07/30/25 Trade Journal, and ES_F Stock Market analysis EOD accountability report: +960
Sleep: 5 hours
Overall health: still struggling with sleep due to heat waves
VX Algo System Signals from (9:30am to 2pm)
— 8:30 AM Market Structure flipped bearish on VX Algo X3!✅
— 9:45 AM Market Structure flipped bullish on VX Algo X3! ✅
— 10:30 AM Market Structure flipped bullish on VX Algo X3!❌
— 11:30 AM Market Structure flipped bearish on VX Algo X3!❌
— 12:00 PM VXAlgo NQ X1DD Buy Signal, ✅
— 12:30 PM Market Structure flipped bullish on VX Algo X3!✅
What’s are some news or takeaway from today? and What major news or event impacted the market today?
I have started to noticed that the last 3 days, we have been getting false triggers on market structure signals and it almost feels MM are trying to do it to break people's algo that trade on that.
This is a good reminder that no matter how successful the signal has been for the last 30 days, you still need to have risk management. additionally, it's also a good way to test people's faith and trick new traders in going back to doing random things because it makes them think market can behave randomly and nothing works.
this is why i always tell people to religiously test out a system for 30 days before giving up.
News
*FEDERAL RESERVE SKIPS RATE CUT, KEEPS FED FUNDS RATE AT 4.50%
What are the critical support levels to watch?
--> Above 6410= Bullish, Under 6400= Bearish

XAUUSD Long@3275 TP@3350 SL@3243XAUUSD
Long@3275
TP@3350
SL@3243
It is better to long XAUUSD@3275 as the price hold above the dow theory of daily and weekly timeframe. Good risk/reward ratio. Target for 3350.

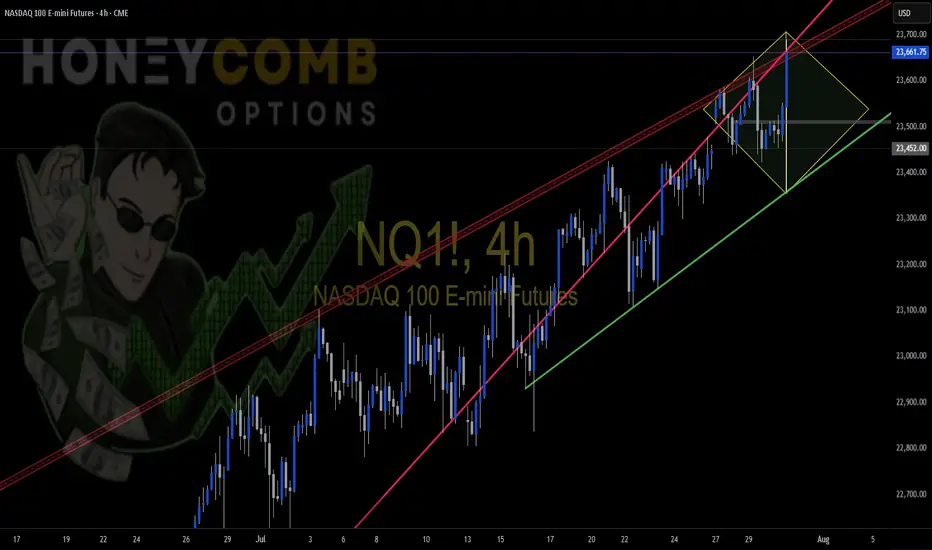
NQ Possible Diamond Top FormationPossible Diamond Top formation. This is a long play, and it may not be completed. I just wanted to show everyone what I see. Trade Safe
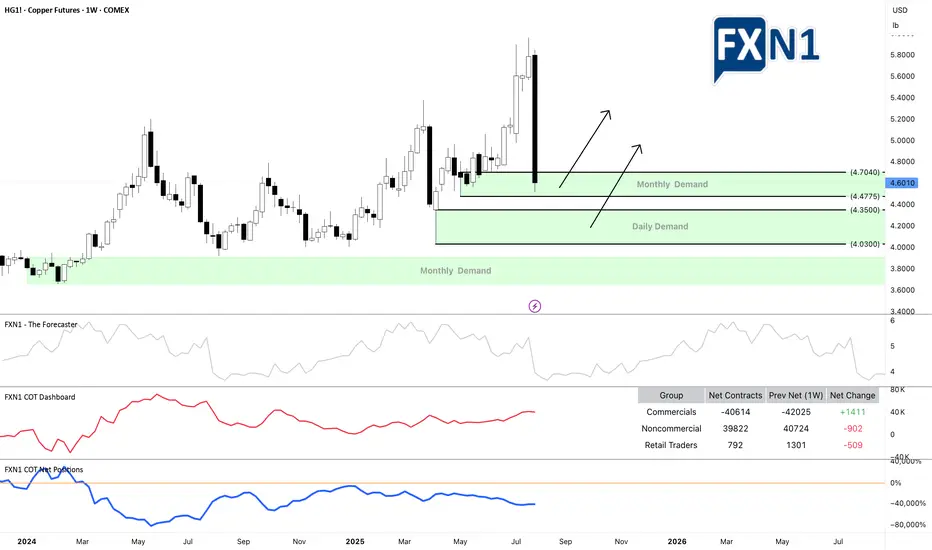
Copper: Trump Signs Tariffs on Imports Amid National Security...President Donald Trump signed a proclamation on Wednesday that imposes tariffs on copper imports, citing concerns over national security.
The White House announced that the new policy will introduce a 50% tariff on semi-finished copper products and other copper-derived goods that are highly dependent on the metal.
These tariffs are scheduled to come into effect on August 1, as outlined in a White House fact sheet.
In terms of market dynamics, copper is currently within a monthly demand zone, with a daily demand area also identified for setting pending orders. The potential impact on prices could be twofold: a possible upward movement driven by the discount effect on the metal, or continued decline following President Trump's announcement.
What are your thoughts on how these tariffs might influence copper prices moving forward?
✅ Please share your thoughts about HG1! in the comments section below and HIT LIKE if you appreciate my analysis. Don't forget to FOLLOW ME; you will help us a lot with this small contribution.